
Gold & Precious Metals
Gold & Silver Mining Stocks Hold Well Despite Metals’ Correction
Despite a lukewarm, lackluster first half of the year, Gold has so far risen by 13 percent in 2012, nothing to sneeze at. The price of gold rose by about $215 in 2012, with most of the gains, $165 worth, having materialized in the last two months. This was after the U.S. Federal Reserve announced its plan to resume buying bonds to prop up the economy. The underlying bullish case for gold remains intact, given the prospect of indefinite loose monetary policy. Central banks have been supporting gold this year and it’s no wonder. They are well aware of the soon-to-be-enforced reserve requirements that call for greater holdings in gold. There is also demand from key consumers such as China and India.
Gold mining is also experiencing strikes. Members of South Africa’s biggest union this week rejected a proposal by the nation’s largest gold companies to raise wages and end strikes that have crippled the industry. This is affecting about 41 percent of South Africa’s gold output.
While some mining companies see decreases in their outputs due to strikes, their direct competitors may benefit from this situation as investors rebalance their mining stock portfolios and substitute the less profitable companies with more successful ones. If the latter are included in popular indices (HUI, XAU), the latter are likely to show strength, especially given the open-ended QE.
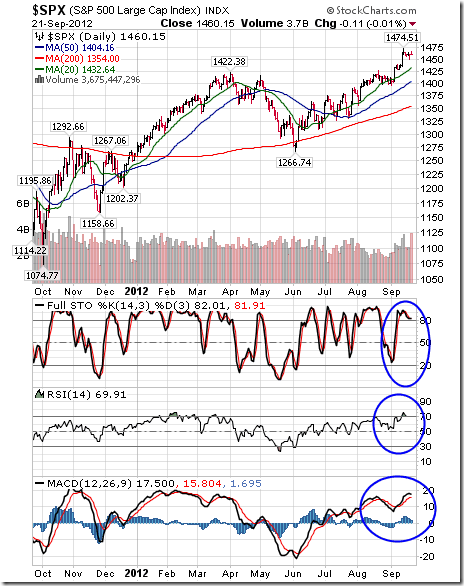
The Quantitative Easing program will likely help to boost prices of virtually all stocks (and make the fall of the worst performing ones milder). Let’s take a look if that was really the case recently (charts courtesy by http://stockcharts.com.)
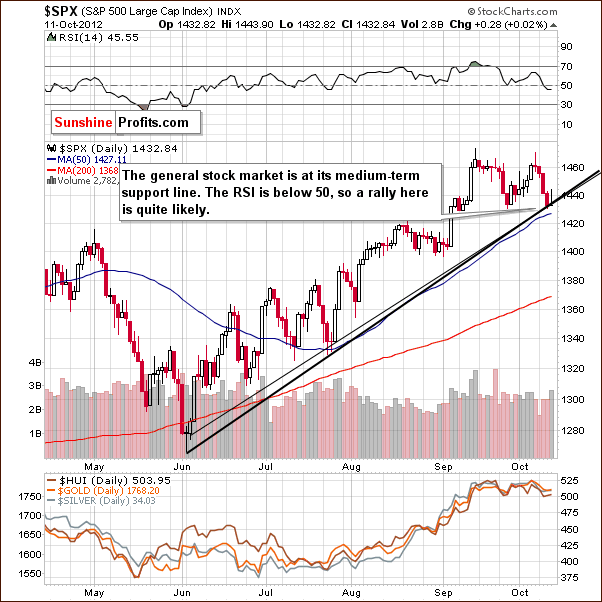
The above S&P 500 Index chart does not include this week’s price action, but as we now know, stocks rallied and the S&P 500 is now above 1450.
Stocks have temporarily moved below the support lines that you can see on the above chart, but they have quickly moved higher and the situation looks bullish once again. The short-term trend simply remains up.
Let’s now have a look at the intermarket correlations to see how the situation on the general stock market could influence precious metals and mining stocks.
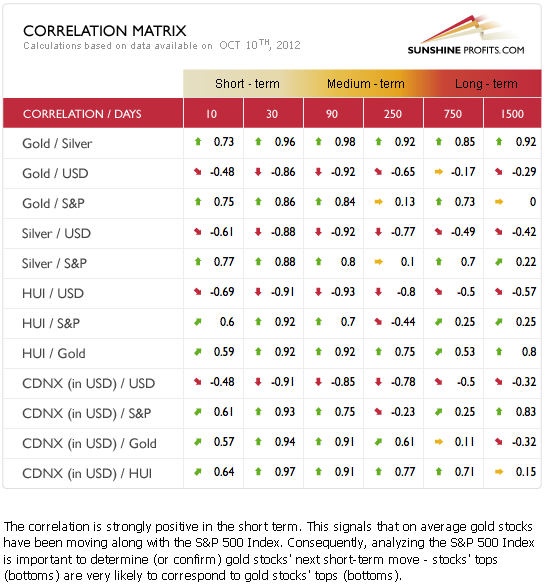
The Correlation Matrix is a tool which we have developed to analyze the impact of the currency markets and the general stock market upon the precious metals sector. Once again we see the classic correlations this week as the USD Index is negatively correlated with the precious metals and the metals are positively correlated with the general stock market. The highest correlation in the past 30 days has been between the miners and stocks.
Please note that last week the miners did not decline as much as stocks did. While the correlation coefficient for the 30 trading days was very big, the one based on the past 10 trading days was only 0.6. Last week, mining stocks were simply not responding to the negative signals from the general stock market, which is unusual since they are normally highly correlated with stocks. With stocks now moving higher, the picture is quite positive for the miners in the short term – at least based on the general stock market and miners’ correlation with it.
Are the miners themselves holding well?
Yes, they are.
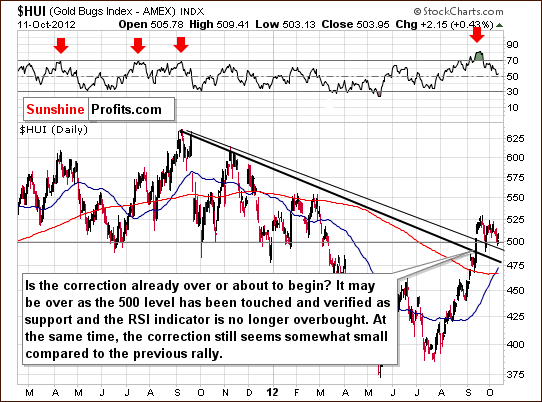
On the above medium-term HUI Index chart (proxy for gold stocks), we see that the mining stocks didn’t decline below 500 last week and they, as surprising as it may seem, are above 500 also today even though gold and silver declined significantly on Monday.
Does it mean that the correction in the precious metals sector is over? Not necessarily – there are factors that need to be considered in addition to examining the picture in the HUI Index and S&P 500 to say that, however, it does seem very likely that the mining stocks will be a very good investment once the correction is indeed over. Assets that hold well during a correction are often the same assets that outperform when the correction ends and markets start to rally.
Summing up, the short-term outlook for the general stock market is bullish as stock prices moved back above the support line this week and the implications for mining stocks are bullish. The correction in the precious metals market may not be over at this point, but when it is over, miners might finally outperform the underlying metals once again.
In order to make sure that you won’t miss any of our free essays, we strongly suggest that you sign up for our gold & silver investment mailing list. Sign up today and you’ll also receive 7 days of access to our premium updates, market alerts, premium charts and tools. You’ll also receive 12 best practice e-mails as a starting bonus.
Thank you for reading. Have a great and profitable week!
Przemyslaw Radomski, CFA
Editor
Article Posted on October 16th by:
Jordan Roy-Byrne, CMT (Trendsman) is a Chartered Market Technician, a member of the Market Technicians Association and from 2010-2011 an official contributor to the CME Group, the largest futures exchange in the world. He is the publisher and editor of TheDailyGold Premium, a publication which emphaszies market timing and stock selection for the sophisiticated investor.
Since January 2010, The Daily Gold Premium Model Portfolio is up 129% compared to GDX (+15%) and GDXJ (+6%). Jordan’s work has been featured in CNBC, Barrons, Financial Times Alphaville, Kitco and Yahoo Finance. He is quoted regularly in Barrons. Jordan was a speaker at PDAC 2012, the largest mining conference in the world and is a speaker for Cambridge House and Hard Assets conferences. Jordan earned a degree in General Studies with a concentration in International Economic Development. Jordan also lived and worked in Southeast Asia for 3 years in order to study economic development from an emerging market perspective. In his spare time he enjoys spending time with Mrs. Trendsman.
Contact: Jordan @ TheDailyGold.com

The entry point for the seasonal trade in North American equity markets (on average during the past 61 years: October 28th) is rapidly approaching. The expected short term correction from mid-September has happened, but has yet to show signs of bottoming. Watch short term technical indicators for signs of an intermediate bottom. Sectors to consider include due to their favourable seasonality starting by the end of October include technology, agriculture, forest products, transportation, industrials, steel, consumer discretionary and China.
Interesting Charts
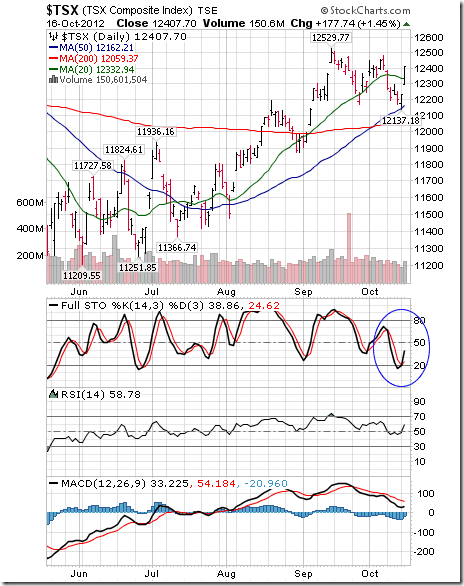
Short term momentum indicators for broadly based equity indices are recovering from oversold levels (notably a move by Stochastics above the 20% level). Typical of technical action at the start of the period of seasonal strength for equity markets!


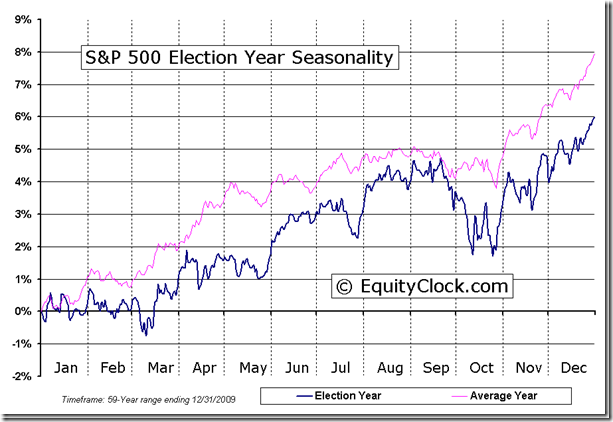
The recovery is happening at an interesting time, just before the U.S. Presidential election when equity markets typically start an intermediate upside move lasting until at least Inauguration Day in the third week in January.
A word of caution about individual equities! Responses to third quarter reports released yesterday were exceptional, particularly by stocks reporting after the close. Most companies are reporting slightly higher than consensus earnings. However, many are missing consensus revenue estimates. Of companies that reported before the close yesterday, State Street gained 2.0% and Johnson & Johnson improved 1.4%. However, Goldman Sachs fell 1.3% and UnitedHealth Group slipped 0.6%. Responses to reports released after the close were downright scary. CSX added 1.7%. However, IBM plunged 3.5%, Intel dropped 2.2%, Linear Technology fell 4.0%, Apollo plunged 7.6% and Intuitive Surgical gave up 4.8%. Today and tomorrow are the days when the most S&P 500 companies are reporting third quarter results. Look for lots of volatility.
About the Great Author of this Daily Report – Don Vialoux
Don Vialoux has 37 years of experience in the Investment Industry. He is a past president of the Canadian Society of Technical Analysts (www.csta.org) and a former technical analyst at RBC Investments. Don earned his Chartered Market Technician (CMT) designation from the Market Technician Association in 1995. His CMT paper entitled “Seasonality in Canadian Equity Markets” was published in the Spring-Summer 1996 edition of the MTA Journal. Don also has extensive experience with Exchange Traded Funds (also know as Index Participation Units) as well as conservative option strategies. In 1990 he wrote a report that was released in the International Federation of Technical Analyst Journal entitled “Profiting from a Combination of Technical and Fundamental Analysis”. The report introduced ” The Eight Phases of the Stock Market Cycle”, an investment concept that continues to identify profitable entry and exit points for North American equity markets. He is currently a member of the Toronto Society of Fundamental Analyst’s Derivatives Committee. Now he is the author of a daily letter on equity markets available free on the internet. The reports can be accessed daily right here at www.dvtechtalk.com.


Maybe it is too much to say the global financial system is coming apart at the center, but I don’t think it’s too much to say global cooperation is close to complete breakdown based on the recent dismal IMF meeting.

 I hate reading junk postings so let me start by saying that if you’re not interested in finding out the techniques that Tyler Bollhorn used in September to make money on 90% of his trades or finding out how you can literally take 15 minutes a month to significantly improve your investment results then don’t read another word – and please forgive the interruption.
 - A two month subscription to his daily newsletter and trade alert, normally a $118 cost, (for new subscribers only)
- PLUS a two months Stockscores Advanced membership, regularly a $58 cost, (again for new Stockscores members only).
- PLUS I am working one other special bonus for attendees that I’ll tell you about at the event.

PERSPECTIVE
As the saying goes, this is being written while at sea. Can’t help but think of Rod Stewart’s”Sailing”, but the Atlantic is quiet today and the sun is shining – making it rather nice for walking round the deck. Three times around amounts to a little more than a mile.
(Ed Note: Bob’s take on Stocks, Interest Rates, Commodities & his Wrap below)
Last week’s theme was that high level thinking in the orthodox seems to be changing. Some academics are calling our post-bubble contraction as the “Bernanke Depression”, which is appropriate. In the “cause and effect” world of orthodox thinking the financial agent “on watch” gets the credit for a natural boom and those on duty during a natural depression get the blame.
In the 1920s Treasury Secretary Mellon was celebrated as the greatest “since Alexander Hamilton” and was condemned during the bust. The next to be celebrated was Robert Rubin, who headed the treasury during the “Dot-com Mania”. And what did he and his sidekick Summers do deserve the accolade. They added fuelish amounts of gasoline to a financial conflagration.
Of course it the same thing can be said about Bernanke, but global assets have been deflating since the 2007 Bubble completed.
The other aspect of change is that some involved in policymaking have been uttering some commonsense about insane Fed ambition. Prudent people, such as Charles Prosser who heads up the Philadelphia Fed said as much a week ago. We invite readers to send in the examples they see. We will keep a tally.
Then you have the “Incurables” such as Paul Krugman who has been non-stop in calling for even greater central bank recklessness. Krugman’s error has been the popular notion that the Fed is THE perfect policy instrument. In certain circles this has been popular since the Fed opened its doors in January 1914, and the record has been a series of boom and busts. The most interesting of which have been the great financial manias, such as climaxed in 1929 and 2007.
This fascinating because each set of interventionists believed they were “charting new waters”, when they were replicating old bubble behaviour. Including the boast from previous bubble that “nothing can go wrong”. In 1873 it was that the US did not have a central bank and was not on a gold standard. Then in 1929 the agency that would prevent bad things from happening was the “new” Federal Reserve System. What’s more, it would keep the good times rolling.
Why?
Because the previously celebrated agency – the Treasury System – was gone. It had been the cause of so much financial distress and economic malaise.
Actually this melancholy condition is the feature of every post-bubble contraction. With the “new” Fed this would be impossible.
In fulfilling the record of financial history, 2007 clocked the main features of the conclusion of a classic bubble. At the time, the abilities of existing agencies where boasted as being proof against bad things. And then to use the establishment’s own descriptions, the worst recession since the 1930s followed. This was followed by the weakest recovery – since the 1930s.
Despite massive attempts at “stimulus” the first recovery out of a classic crash was weak. Even worse it is now being more widely seen as ending.
If history continues to guide, sometime soon, the establishment should begin to condemn the “old and disastrous” Federal Reserve System. This would be followed by a tout about a more perfect agency that really will be designed to prevent bad things.
During the initial and shocking crisis the media was full of stories that a bigger Fed would have prevented the problem. That doesn’t count, what will be needed is the tout about a new and different agency.
Time will tell.
STOCK MARKETS
Stock markets rallied as Romney came out on top after the debate. However, the action remains in a topping pattern following impressive momentum and sentiment readings accomplished around September 14th.
The following chart shows the interaction between the S&P and the VIX. Key negative divergences are detailed along with important stock market highs.
On this model all that is needed for completion is that the VIX rally above 15.5. This would be a “sell” signal.
The VIX is now at 14.3.
CREDIT MARKETS
Not much change over the past week. After a magnificent rush of narrowing, junk vs treasuries widened significantly and have paused late in the week. A test of the “high” would confirm a reversal to widening spreads.
A slowing global economy will impair the ability of corporations to service debt obligations.
While junk has bounced a little, long treasuries have declined in price a little. The former is working on a top and the latter are stair-stepping down.
For the shorter maturities there has been some volatility in the Ted-Spread. With narrowing that ran “forever” – well since the end of the dislocations that ended late last year – the action reached a very oversold on the weekly RSI.
The degree of oversold suggest this week’s volatility could be setting up a trend change. And any change in the curve along with change in spreads would be critical.
COMMODITIES
Most commodities have rebounded from the slide that began around September 14. The CRB declined from 321 to 302 and this week made it to 311. Although tied to the “good news” about the advance in Romney’s campaign, it should be considered as a normal test of the high.
Within this Ag prices (GKX) have been stair-stepping down.
WRAP
This is being written on board the Queen Mary 2 on the way to Southampton and the internet hook up has been irregular. So this edition has taken a couple of days to get this far. Ross will be able to update the Gold and Silver sector as opportunities arrive.
We are in the mid-Atlantic enjoying an interesting ride. Sunny and cloudy day with a Force 9 wind blowing, which is described as a “strong gale” with “very rough” seas. The wave height ranges from 14 to 18 feet. Sometimes the spray reaches Deck 8 which has the wooden surface that has been so nice to walk around. Three laps amounts to a little over a mile. With the “tunes” on the walk has been enjoyable, but there is too much spray today. This deck seems to be about 30 feet above the ocean. Considering the thought processes of the liberal-left, this could be considered as “proof” of rising sea levels.
The library is very nicely appointed, with comfortable arm chairs looking out over the bow.There is also an exercise room – offset by a number of bars and dining rooms.
By unusual circumstance, Lois and I “dined” with the captain last evening. One has to be booked into a high-end suite to dine at the captain’s table. We had found a nice table next to the window and were enjoying a pleasant Shiraz-Viognier. Then along came the captain (in a very smart uniform) and his wife who sat at the table next to us. We had an interesting conversation, but brief as the storm was increasing and he was returning to the bridge. Probably for the night.
Better get this finished while we still have sat hook up.

INSTITUTIONAL ADVISORS
TUESDAY, OCTOBER 16, 2012
BOB HOYE
PUBLISHED BY INSTITUTIONAL ADVISORS
The following is part of Pivotal Events that was
published for our subscribers October 5, 2012.
SIGNS OF THE TIMES
“German business confidence unexpectedly fell to the lowest in two and a half years.”
– Bloomberg, September 24
“Consumers and countries continued to pull money out of banks in Spain.”
– Dow Jones, September 26
* * * * *
BOB HOYE, INSTITUTIONAL ADVISORS
E-MAIL bhoye.institutionaladvisors@telus.net
WEBSITE: www.institutionaladvisors.com

-
I know Mike is a very solid investor and respect his opinions very much. So if he says pay attention to this or that - I will.
~ Dale G.
-
I've started managing my own investments so view Michael's site as a one-stop shop from which to get information and perspectives.
~ Dave E.
-
Michael offers easy reading, honest, common sense information that anyone can use in a practical manner.
~ der_al.
-
A sane voice in a scrambled investment world.
~ Ed R.
Inside Edge Pro Contributors

Greg Weldon

Josef Schachter

Tyler Bollhorn

Ryan Irvine

Paul Beattie

Martin Straith

Patrick Ceresna

Mark Leibovit

James Thorne

Victor Adair