Bonds & Interest Rates

The Good, Bad and Ugly…..of Deflation

Screen Shot 2012-10-15 at 2.30.41 PM

badugly

Inflation in the U.S. has historically been a wartime phenomenon, including not only shooting wars but also the Cold War and the War on Poverty. That’s when the federal government vastly overspends its income on top of a robust private economy—obviously not the case today when government stimulus isn’t even offsetting private sector weakness. Deflation reigns in peacetime, and I think it is again, with the end of the Iraq engagement and as the unwinding of Afghanistan expenditures further reduce military spending.

Chronic Deflation

Few agree with my forecast of chronic deflation. They’ve never seen anything but inflation in their business careers or lifetimes, so they think that’s the way God made the world. Few can remember much about the 1930s, the last time deflation reigned. Furthermore, we all tend to have inflation biases. When we pay higher prices, it’s because of the inflation devil himself, but lower prices are a result of our smart shopping and bargaining skills. Furthermore, we don’t calculate the quality-adjusted price declines that result from technological improvements in many big-ticket purchases. This is especially true since many of those items, like TVs, are bought so infrequently that we have no idea what we paid for the last one. But we sure remember the cost of gasoline on the last fill-up a week ago.

Doubts

Furthermore, many believe widespread deflation is impossible and that rampant inflation is assured in future years because of continuing high federal deficits, regardless of any long-run budget reform. And annual deficits of over $1 trillion are likely to persist in the remaining five to seven years of deleveraging, as I explain in my recent book, The Age of Deleveraging. The 2% annual real GDP growth I see persisting is well below the 3.3% needed to keep the unemployment rate stable. So to prevent high and chronically rising unemployment, any Administration and Congress—left, right or center—will be forced to spend a lot of money to create a lot of jobs.

But big federal deficits are inflationary only when they come on top of fully-employed economies and create excess demand. That’s obviously not true at present when large deficits are reactions to private sector weakness that has slashed tax revenues and encouraged deficit spending. Indeed, the slack in the economy in the face of persistent trillion dollar-plus deficits measures the huge size and scope of the offsetting deleveraging in the private sector, as noted earlier.

The deleveraging, especially in the global financial sector and among U.S. consumers, will be completed in another five to seven years at the rate it is progressing. At that point, the federal deficit should fade quickly, assuming a war or other cause of oversized government spending doesn’t intervene. The resumption of meaningful economic growth will reduce the pressure for economic stimuli and rising incomes and corporate profits will spur revenues. Serious work on the postwar baby-related bulge in Social Security and Medicare costs will also depress the deficit.

Good Deflation

A decade ago in my two Deflation books, I distinguished between two types of deflation—the Good Deflation of excess supply and the Bad Deflation of deficient demand. Good Deflation is the result of important new technologies that spike productivity and output even as the economy grows rapidly. Bad Deflation results from financial crises and deep recession, which hype unemployment and depress demand.

I’ve been forecasting chronic good deflation of excess supply because of today’s convergence of many significant productivity-soaked technologies such as semiconductors, computers, the Internet, telecom and biotech that should hype output. Ditto for the globalization of production and the other deflationary forces I’ve been discussing since I wrote the two Deflation books and The Age of Deleveraging. As a result of rapid productivity growth, fewer and fewer man-hours are needed to produce goods and services. The rapid productivity growth so far this decade is likely to persist (Chart 1).

101112-01

While I’ve consistently predicted the good deflation of excess supply, I said clearly that the bad deflation of deficient demand could occur—due to severe and widespread financial crises or due to global protectionism. Both are now clear threats.

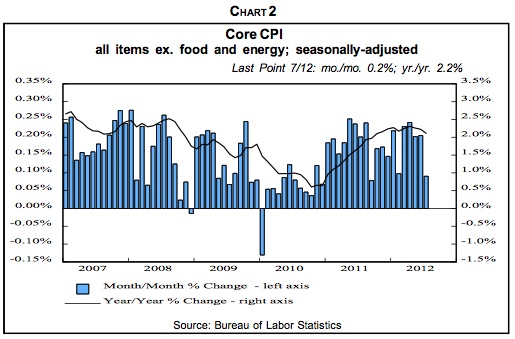
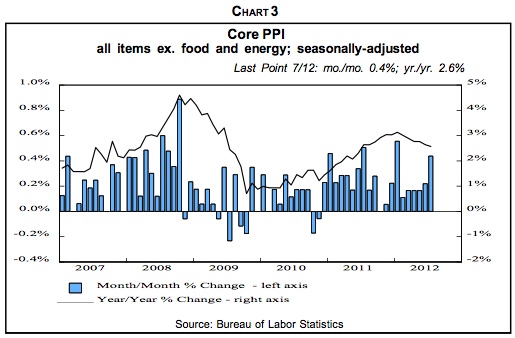
My forecast is that the unfolding global slump will initiate worldwide chronic deflation. A number of indicators point in that direction. Sure, much of the recent weakness in the PPI and CPI has been due to falling energy and food prices. Excluding these volatile items, prices are still rising but at slowing rates (Charts 2 and 3). Consumer price inflation is also falling abroad in the U.K. and the eurozone.

101112-02

101112-03

After China’s huge stimulus program in 2009 in response to the global recession and nosedive in exports to U.S. consumers, the economy revived, but so did inflation. Double-digit food price jumps were especially troublesome in a land where many live at subsistence levels. So in response to the surge in inflation and the real estate bubble, Chinese leaders tightened economic policy, driving down CPI inflation to a 2.0% rise in August vs. a year earlier. But, in conjunction with the weakening in export growth, that is pushing China toward a hard landing of 5% to 6% economic growth, well below the 7% to 8% needed to maintain stability.

Back in the States, inflationary expectations, as measured by the spread between 10-year Treasury yields and the yield on comparable Treasury Inflation-Protected Securities are narrowing.

Other Varieties

Besides rises or falls in general price levels, which most think about when they hear “inflation” or “deflation,” there are six other varieties, maybe more.

Commodity Inflation/Deflation. In the late 1960s, the mushrooming costs of the Vietnam War and the Great Society programs in an already-robust economy created a tremendous gap between supply and demand in many areas. The history of low inflation rates for goods and services, we’ll call it CPI inflation for short, in the late 1950s and early 1960s, apparently created a momentum of low price advances that kept CPI inflation from exploding until about 1973. But by the early 1970s, commodity prices started to leap and spawned a self-feeding up surge. Worried that they’d run out of critical materials in a robust economy, producers started to double and triple order supplies to insure adequate inventories. That hyped demand, which squeezed supply, and prices spiked further. That spawned even more frenzied buying as many expected shortages to last forever.

At the time, even before the 1973 oil embargo, I was lucky enough to realize that what was occurring was not perennial shortages but massive inventory-building. I found a parallel in post-World War I when wartime price and wage controls were removed and wholesale prices skyrocketed about 30% in one year as double and triple ordering hyped inventories amid frenzied demand and fears of shortages. Then all those inventories arrived and sired the 1920-1921 recession, the sharpest on record, and wholesale prices collapsed. Armed with this history, I correctly forecast the 1973-1975 recession and said it would be the worst since the 1930s, which it proved to be. Arriving inventories swamped production, especially in late 1974 and early 1975, so production nosedived.

Another Commodity Bubble

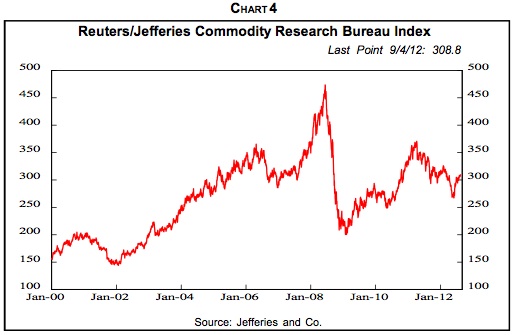
It’s probably no coincidence that China’s joining the World Trade Organization at the end of 2001 was followed by the commencement of another global commodity price bubble that started in early 2002 (Chart 4). And it has been a bubble, in my judgment, based on the conviction that China would continue to absorb huge shares of the world’s industrial and agricultural commodities. The shift of global manufacturing toward China magnified her commodity usage as, for example, iron ore that previously was processed into steel in the U.S. or Europe was sent to China instead.

101112-04

Peak Oil

Crude oil has been the darling of the commodity-shortage crowd, and when its price rose to $145 per barrel in July 2008, many became convinced that the world would soon run out of oil.

But they discounted the fact that reserves are often underestimated since oil fields produce more than original conservative estimates. Nor did they expect conventional and shale natural gas, liquefied natural gas, the oil sands in Canada, heavy oil in Venezuela and elsewhere, oil shale, coal, hydroelectric power, nuclear energy, wind, geothermic, solar, tidal, ethanol and biomass energy, fuel cells, etc. to substitute significantly for petroleum.

Recent Weakness

The weakness in commodity prices, starting in early 2011, no doubt has been anticipating both a hard landing in China and a global recession. In my view, the foundation of the decade-long commodity bubble is crumbling, and the unfolding of a hard landing in China and worldwide recession will depress commodity prices considerably, even from current levels, as disillusionment replaces investor enthusiasm.

Wage-Price Inflation/Deflation. A second variety of inflation is a particularly virulent form, wage-price inflation in which wages push up prices, which then push up wages in a self-reinforcing cycle that can get deeply and stubbornly embedded in the economy. This, too, was suffered in the 1970s and accompanied slow growth. Hence the name, stagflation. As with commodity inflation, it was spawned by excess aggregate demand resulting from huge spending and the Vietnam War and Great Society programs on top of a robust economy.

Back then, labor unions had considerable bargaining strength and membership. Furthermore, American business was relatively paternalist, with many business leaders convinced they had a moral duty to keep their employees at least abreast of inflation. Most didn’t realize that, as a result, inflation was very effectively transferring their profits to labor. And also to government, which taxed underdepreciation and inventory profits. The result was a collapse in corporate profits’ share of national income and a comparable rise in the share going to employee compensation from the mid-1960s until the early 1980s.

The Peak

The wage-price spiral peaked in the early 1980s as CPI inflation began a downtrend that has continued. Voters rebelled against Washington, elected Ronald Reagan and initiated an era of government retrenchment. The percentage of Americans who depend in a significant way on income from government rose from 28.7% in 1950 to 61.2% in 1980, but then fell to 53.7% in 2000. Furthermore, the Fed, under then-Chairman Paul Volcker, blasted up interest rates, and negative real borrowing costs turned to very high positive levels.

As inflation receded, American business found itself naked as the proverbial jaybird with depressed profits and intense foreign competition. In response, corporate leaders turned to restructuring with a will. That included the end of paternalism towards employees as executives realized they were in a globalized atmosphere of excess supply of almost everything. With operations and jobs moving to cheaper locations offshore and with the economy increasingly high tech and service oriented, union membership and power plummeted, especially in the private sector.

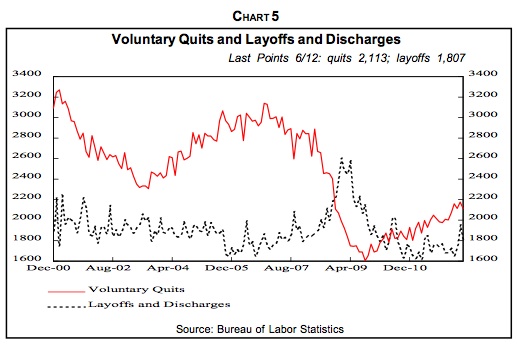
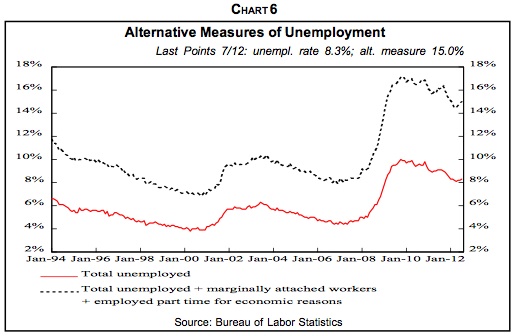
In today’s unfolding deflation, the wage-price spiral has been reversed. Contrary to most forecaster expectations, but forecast in my two Deflation books, wages are actually being cut and involuntary furloughs instituted for the first time since the 1930s. In inflation, oversized wages can be cut to size by simply avoiding pay hikes while inflation erodes real compensation to the proper level. But with deflation, actual cuts in nominal pay are necessary. Note that as wage cuts and furloughs become increasingly prevalent, the layoff (Chart 5) and unemployment numbers (Chart 6) will increasingly understate the reality of the declines in labor compensation.

101112-05

101112-06

Financial Asset Inflation/Deflation. Perhaps the best recent example of financial asset inflation was the dot com blowoff in the late 1990s. It culminated the long secular bull market that started in 1982 and was driven by the convergence of a number of stimulative factors. CPI inflation peaked in 1980 and declined throughout the 1980s and 1990s. That pushed down interest rates and pushed up P/Es. American business restructured and productivity leaped.

A Secular Down Cycle

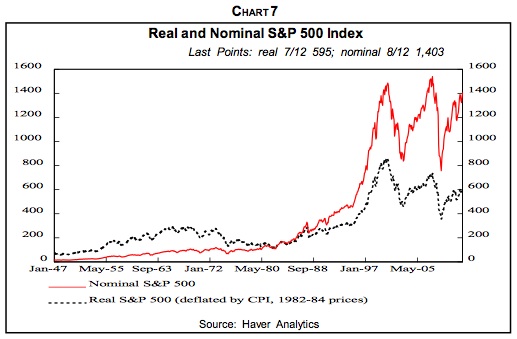
The robust economy upswing that drove the 1982-2000 secular bull market ended in 2000, as shown by basic measures of the economy’s health. Stocks, which gauge economic health as well as fundamental sentiment, have been trending down since 2000 in real terms (Chart 7). At the rate that deleveraging worldwide is progressing, it will take another five to seven years to be completed with equity prices continuing weak on balance during that time. Employment also peaked out in 2000 even after accounting for lower although rising labor participation rates by older Americans. Household net worth in relation to disposable (after-tax) income has also been weak for a decade.

101112-07

The Federal Reserve’s Survey of Consumer Finances, just published for 2007-2010, reveals that median net worth of families fell 39% in those years from $126,400 to $77,300, largely due to the collapse in house prices. Average household income fell 11% from $88,300 to $78,500 in those years with the middle-class hit the hardest. The top 10% by net worth had a 1.4% drop in median income, the lowest quartile lost 3.7% but the second quartile was down 12.1% and the third quartile dropped 7.7%.

Households reacted to too much debt by reducing it. In 2010, 75% of households had some debt, down from 77% in 2007, according to the Fed survey. Those with credit card balances fell from 46.1% to 39.4% but late debt payments were reported by 10.8% of households, up from 7.1% in 2007. With house prices collapsing, debt as a percentage of assets climbed to 16.4% in 2010 from 14.8% in 2007. Financial strains reduced the percentage that saved in the preceding year from 56.4% in 2007 to 52% in 2010.

Nevertheless, the gigantic policy ease in Washington in response to the stock market collapse and 9/11 gave the illusion that all was well and that the growth trend had resumed. The Fed rapidly cut its target rate from 6.5% to 1% and held it there for 12 months to provide more-than ample monetary stimulus. Meanwhile, federal tax rebates and repeated tax cuts generated oceans of fiscal stimulus as did spending on homeland security, Afghanistan and then Iraq.

As a result, the speculative investment climate spawned by the dot com nonsense survived. It simply shifted from stocks to commodities, foreign currencies, emerging market equities and debt, hedge funds, private equity—and especially to housing. Homeownership additionally benefited from low mortgage rates, loose lending practices, securitization of mortgages, government programs to encourage home ownership and especially to the conviction that house prices would never fall.

Investors still believed they deserved double-digit returns each and every year, and if stocks no longer did the job, other investment vehicles would. This prolongs what I have dubbed the Great Disconnect between the real world of goods and services and the speculative world of financial assets.

Treasurys

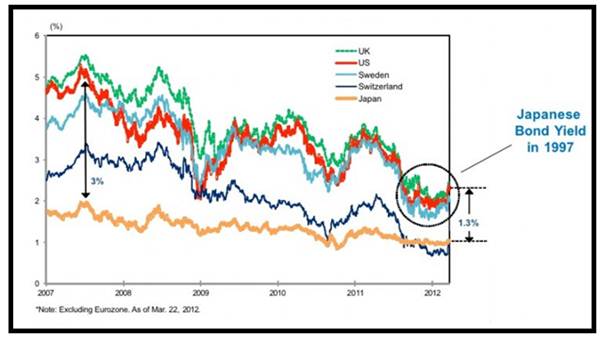
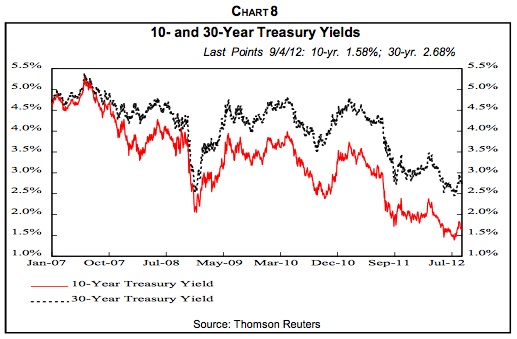
I hope you’ll recall my audacious forecast of 2.5% yields on 30-year Treasury bonds and 1.5% on 10-year Treasury notes, made at the end of last year when the 30-year yield was 3.0%. Those levels were actually reached recently (Chart 8), and I now believe the yields will fall to 2.0% and 1.0%, respectively, for the same reasons that inspired my earlier forecasts. The global recession will attract money to Treasurys as will deflation and their safe-haven status. Sure, Treasurys were downgraded by Standard & Poor’s last year, but in the global setting, they’re the best of a bad lot.

101112-08

The deflation in interest rates has spawned significant side effects. It’s a zeal for yield that has pushed many individual and institutional investors further out on the risk spectrum than they may realize. Witness the rush into junk bonds and emerging country debt. Recently, investors have jumped into the government bonds of Eastern European countries such as Poland, Hungary and Turkey where yields are much higher than in developed lands. The yield on 10-year notes in Turkish lira is about 8% compared to 1.4% in Germany and 1.6% in the U.S.

The inflows of foreign money has pushed up the value of those countries’ currencies, adding to foreign investor returns. And some of these economies look solid relative to the troubled eurozone—Poland avoided recession in the 2008-2009 global financial crisis. But the continuing eurozone financial woes and recession may well drag the zone’s Eastern European trading partners down. And then, as foreign investors flee and their central banks cut rates, their currencies will nosedive much as occurred in Brazil.

Tangible Asset Inflation/Deflation. Booms and busts in tangible asset prices are a fourth form of inflation/deflation. The big inflation in commercial real estate in the early 1980s was spurred by very beneficial tax law changes earlier in the decade and by financial deregulation that allowed naïve savings and loans to make commercial real estate loans for the first time. But deflation set in during the decade due to overbuilding and the 1986 tax law constrictions. Bad loans mounted and the S&L industry, which had belatedly entered commercial real estate financing, went bust and had to be bailed out by taxpayers through the Resolution Trust Corp.

Nonresidential structures, along with other real estate, were hard hit by the Great Recession and remain weak as capacity remains ample and prices of commercial real estate generally persist well below the 2007 peak. The two obvious exceptions are rental apartments and medical office buildings. Returns on property investments recovered from the 2007-2009 collapse, but are now slipping.

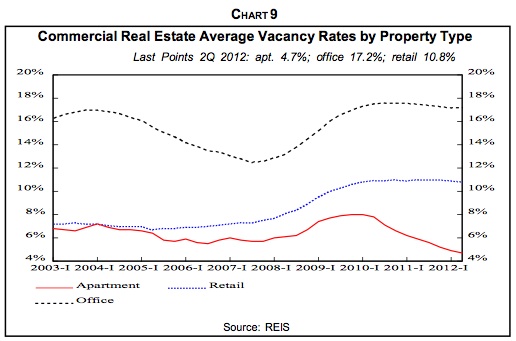
Retail vacancy rates remain high (Chart 9) due to cautious consumers and growing online sales. Rents remain about flat. Ditto for office vacancies due to weak employment and the tendency of employers to move in the partitions to pack more people into smaller office spaces. The office vacancy rate in the second quarter was 17.2%, the same as the first quarter, down slightly from the post-financial crisis peak of 17.6% in the third quarter of 2010 but well above the 2007 boom level of 13.8%. In the second quarter, office space occupancy rose just 0.12% from the previous quarter compared to 0.18% in the first quarter.

101112-09

Housing Woes

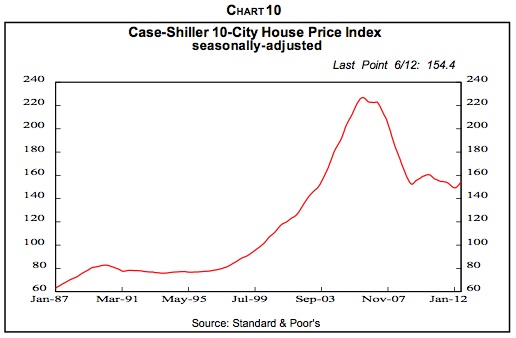
House prices have been deflating for six years, with more to go (Chart 10). The earlier housing boom was driven by ample loans and low interest rates, loose and almost non-existent lending standards, securitization of mortgages which passed seemingly creditworthy but in reality toxic assets on to often unsuspecting buyers, and most of all, by the conviction that house prices never decline.

101112-10

I expect another 20% decline in single-family median house prices and, consequently, big problems in residential mortgages and related construction loans. In making the case for continuing housing weakness, I’ve persistently hammered home the ongoing negative effect of excess inventories on house sales, prices, new construction and just about every other aspect of residential real estate.

Spreading Effects

That further drop would have devastating effects. The average homeowner with a mortgage has already seen his equity drop from almost 50% in the early 1980s to 20.5% due to home equity withdrawal and falling prices. Another 20% price decline would push homeowner equity into single digits with few mortgagors having any appreciable equity left. It also would boost the percentage of mortgages that are under water, i.e., with mortgage principals that exceed the house’s value, from the current 24% to 40%, according to my calculations. The negative effects on consumer spending would be substantial. So would the negative effects on household net worth, which already, in relation to after-tax income, is lower than in the 1950s.

Currency inflation/deflation. We all normally talk about currency devaluation or appreciation. This is, however, another type of inflation/deflation and like all the others, it has widespread ramifications. Relative currency values are influenced by differing monetary and fiscal policies, CPI inflation/deflation rates, interest rates, economic growth rates, import and export markets, safe haven attractiveness, capital and financial investment opportunities, attractiveness as trading currencies, and government interventions and jawboning, among other factors. In recent years, Japan, South Korea, China and Switzerland have all acted to keep their currencies from rising to support their exports and limit imports.

The U.S. dollar has been strong of late, resulting from its safe haven status in the global financial crisis. Furthermore, the U.S. economy, while slipping, is in better shape than almost any other—the best of the bunch. I believe the global recession will persist and the greenback will continue to serve this role. Furthermore, the greenback is likely to remain strong against other currencies for years as it continues to be the primary international trading and reserve currency. The dollar should continue to meet at least five of my six criteria for being the dominant global currency:

1. After deleveraging is complete, the U.S. will return to rapid growth in the economy and in GDP per capita, driven by robust productivity.

2. The American economy is large and likely to remain the world’s biggest for decades.

3. The U.S. has deep and broad financial markets.

4. America has free and open financial markets and economy.

5. No likely substitute for the dollar on the global stage is in sight.

6. Credibility in the buck has been in decline since 1985, but may revive if long-run government deficits are addressed and consumer retrenchment and other factors shrink the foreign trade and current account deficits.

Inflation By Fiat. Way back in 1977, I developed the Inflation by Fiat concept, which gained media attention in that era of high wage-price inflation. This seventh form of inflation encompassed all those ways by which, with the stroke of a pen, Congress, the Administration and regulators raise prices.

The continual rises in the minimum wage is a case in point. So, too, are high tariffs on imported Chinese tires. Agricultural price supports keep prices above equilibrium. As a result, the producer price of sugar in the U.S. is 28 cents per pound compared to the 19 cents world price. Federal contractors are required to pay union wages, which almost always exceed nonunion pay, as noted earlier, another example of inflation by fiat.

Environmental protection regulations may improve the climate, but they increase costs that tend to be passed on in higher prices. The Administration says its new fuel-economy standards of 54.5 miles per gallon by 2025 will cost $1,800 per vehicle but industry estimates put it at $3,000. The cap and trade proposal to reduce carbon emissions is estimated to cost each American household $1,600 per year, according to the Congressional Budget Office. Pay hikes for government workers must be paid in higher taxes sooner or later, and can spill over into private wage increases—although state and local government employee pay is moving back toward private levels, as discussed earlier. Increases in Social Security taxes raise employer costs, which they try to pass on in higher selling prices.

There was some deflation by fiat in the 1980s and 1990s. One of the biggest changes was requiring welfare recipients to work or be in job-training programs. That reduced the welfare rolls from 4.7% of the population in 1980 to 2.1% in 2000, while the overall number that depended on government for meaningful income dropped from 61.2% to 53.7%. But now, as an angry nation and left-leaning Congress and Administration react to the financial collapse, Wall Street misdeeds and the worst recession since the Great Depression, the increases in government regulation and involvement in the economy have been substantial. And with them, more inflation by fiat—at least unless there is a major change of government control with the November elections.

(Excerpted from Gary Shilling’s INSIGHT newsletter. For more information, visit www.agaryshilling.com)

John Mauldin, Editor
Outside the Box
JohnMauldin@2000wave.com

By John F. Mauldin
Outside the Box is a free weekly economic e-letter by best-selling author and renowned financial expert, John Mauldin. You can learn more and get your free subscription by visiting www.JohnMauldin.com.

Please write to johnmauldin@2000wave.com to inform us of any reproductions, including when and where copy will be reproduced. You must keep the letter intact, from introduction to disclaimers. If you would like to quote brief portions only, please reference www.JohnMauldin.com.

John Mauldin, Best-Selling author and recognized financial expert, is also editor of the free Thoughts From the Frontline that goes to over 1 million readers each week. For more information on John or his FREE weekly economic letter go to:http://www.frontlinethoughts.com/

To subscribe to John Mauldin’s E-Letter please click here:http://www.frontlinethoughts.com/subscribe.asp


Slick Smart & Superior Returns in Mining & Exploration Stocks

The major financial markets are dominated by large funds that behave like lemmings—follow the herd and suffer the consequences. Investors should not fall for the commonly held myth that all professionals have an edge over smaller institutional and individual investors. In this exclusive Gold Report interview, Roger Wiegand, editor ofTrader Tracks Newsletter, discusses the criteria he uses to select the best mining and exploration companies. He then explains how moderate trading within a mostly buy-and-hold portfolio can lead to superior returns without the downsides that lemming behavior can cause.

COMPANIES MENTIONED : CANASIL RESOURCES INC. : GLOBAL MINERALS LTD. : GOLD STANDARD VENTURES CORP. : MAG SILVER CORP. : NEWMONT MINING CORP. : PRETIUM RESOURCES INC. : SEABRIDGE GOLD INC. : SILVER STANDARD RESOURCES INC. : TIMMINS GOLD CORP. : AURIZON MINES LTD. :BARKERVILLE GOLD MINES LTD.COMSTOCK MINING INC.CREAM MINERALS LTD.DNI METALS INC.EVOLVING GOLD CORP.FRANCO-NEVADA CORP.
 

The Gold Report: We are going to talk about “lemming investing,” the theme of your most recent newsletter. Who or what are lemmings and how does their behavior drive the market?

Roger Wiegand: The lemmings that drive the market primarily are the big funds, typically mutual funds that manage 401(k) and individual retirement accounts. Most of those funds are set up on a buy-and-hold basis. There are hedge funds with lemming behavior as well, but the hedge funds are more often traders. They are creating a track record of lemming investing as well because of their huge size—billions and billions of dollars. The other sector of the market is the retail investor, with approximately 30% of the market.

The lemming investor market would be most all of the funds and all of the smaller investor’s money. The large funds primarily invest money for the smaller investors (being the lemmings). They really control what’s going on, and they compose 70% of the market. And they do, in fact, establish the trend. Non-lemming investors are those with large accounts who trade for their own pockets and the pockets of the seven figure and larger trader/investors. This is the sector leading/driving the market with mutual fund managers investing lemming money.

TGR: In your recent newsletters, you discuss commonly held investment myths. Near the top of the list was that the largest “professionals” always have special insight unavailable to smaller professionals and individuals. Is that what you’re stating here?

RW: That’s correct. The reason we wrote the article about the lemmings is that we think the old paradigm of buy and hold forever is not a good way to go. That’s not to say that you can’t buy stocks and hold them for an extended period. What we like people to do on our recommendations in ourTrader Tracks Newsletter is to purchase stocks on a buy-and-hold basis and then trade in and out up to twice a year based upon the two annual cycle changes. One of those, of course, would be to sell in May and go away. The other would be the re-entry after the summer, but then you have to deal with the September-October period when the stock markets tend to have a risk of large corrections. We called the correction this fall, and we hit it right on the day. We said it would be on Sept. 24. It was a mild correction. In other words, the buying stopped, and prices fell a bit.

The presidential election is interfering with market direction right now. People are confused as to what may or may not happen. We have the overriding negative problems of a slowdown in Asia, a major slowdown in Europe and a mild slowdown in the U.S. The U.S. broader stock market has generally been holding up pretty well. We think that it will be propped up and levitated at least until the voting is over on Nov. 6. After that, reality may hit home in many markets depending upon who is elected president. I don’t think it realistically matters in the short term in any way, except for the psychology of the market. While there will clearly be an impact, it is not clear what that impact will be. Wall Street favors a Romney election but historically the markets have done better after a Democrat has been elected. This time is indeed different on numerous factors.

Resolution of the European debt situation is also adding to the overall market indecisiveness. Spain and some of the other neighboring countries have serious problems and we don’t fully know how bad is bad. Since we talked on this interview, new meetings and media outflow from Europe tell us they are frightened and afraid to remark on the true status. However, the International Monetary Fund stated a very dire warning on Oct. 8, 2012, using the word “alarming.”

TGR: So the lemming behavior you’re witnessing now is that the larger funds deploying capital are ignoring or glossing over the major macroeconomic problems worldwide?

RW: The big players understand fundamental problems, but they also have so much power that they can move the market, for example, by buying the S&P 500 for market support. Other strategies they use to keep markets artificially high include not selling off entire positions or very selective selling of the weakest issues. The funds can also protect long positions by buying put options. They have been doing this for years and have a lot of computing power to back up their analysis. For example, if they felt the market was going to sell off 10% in October, they would want to buy options to the extent they could cover themselves on just that 10%. That sounds like a lot of money, but it’s not really because the puts are leveraged. This is like buying an insurance policy to protect the overall investments.

TGR: You advocate a “modified” buy-and-hold strategy to your subscribers. That is, a traditional buy-and-hold strategy with seasonal trading. Does that mean you are biased toward the long side with minimal short exposure?

RW: That’s correct. We like to trade. We trade both stock and futures, and we prefer the long side. Occasionally, we will short. Our short trades haven’t been bad, but they haven’t produced the kinds of returns we have gotten on the long side. Our strategy is focused on the long side. When we see downside pressure coming, we recommend put options, profit taking and scaling back positions to reduce exposure and lock in profits. Once the correction is done, we go back in and buy.

TGR: This month’s newsletter had a multi-decade chart of the Wilshire 5000, which you called bearish. Are you negative on equities in general?

RW: The Wilshire is getting near a peak, and that chart is a very long (yearly) chart. I prefer to use monthlies for the big picture. The monthly is telling us we have a bear market in front of us. The question is how much of a bear market is it? I’m not totally against stocks, but our preference is in precious metals and energy stocks, as well as some currencies. I believe we are in a rotation away from junior stocks and moving toward intermediates. That doesn’t mean there aren’t good juniors out there. We have many good juniors in our newsletter and on our list, and we do prefer them. But we also suggest that people trade them and be very selective.

TGR: What is your strategy with juniors?

RW: We look for the junior explorers with these criteria:

1) Superior management.

2) Well financed. (Juniors in the fall of 2012 need to be well financed because if a junior company has to go back into the market and raise more capital, it could be vulnerable.) If it’s sitting with enough cash to work with a burn rate that will help it manage the business for two or three years, I think it is going to be in good shape. We have several stocks in that category in the newsletter.

3) Good geopolitics and geography. We’ve gotten very selective about geopolitics and geography. There is much of the world where we prefer not to go anymore. We currently favor most of Canada, part of Alaska, northeast Nevada, and we like Mexico. It is a relatively short list.

4) Proximity to a major operator. This is really important. If you’re going to hang on to a junior stock and a company follows the rules, we really prefer that it’s sitting next door or in close proximity to a senior miner that’s in operation. Mine building is tough work. It is best to follow a successful company that has worked out the infrastructure and politics. We all know what’s happened to the cost of building mines and infrastructure over the last 6 to 12 months. One of my suggested companies had an initial estimate of $95 million (M) to build its mine. It went back and reconfigured it—then all of a sudden $95M became $440M. That’s a drastic increase due to inflation, availability of money and many other factors. If you have the first three criteria worked out, this point becomes critical – you need an obvious buyer for that property. We have had several examples of this situation that have worked out quite nicely.

TGR: Having a built-in exit strategy for a junior is a great way to cap off a winning investment. How about entry strategies? Are you more interested in silver or gold at present?

RW: We like both. From a futures trading standpoint, gold may be easier. However, given the high gold to silver ratio, there is probably more upside in the silver market. For stocks, there are a lot of companies to choose from. Because we spend a lot of time analyzing these companies, we are comfortable recommending silver juniors for greater leverage. But we have some gold companies that are doing exceedingly well, too.

TGR: Are there specific companies that you think highlight all these points: management, financing, geopolitics and exit strategy in the precious metals sector?

RW: I have several that I know well. The first is a fairly new one for us—Global Minerals Ltd. (CTG:TSX.V; DPF:FSE). It has a property in Eastern Europe, which is out of our preferred geography, but I would call this a “special situation” on that criterion. Global is located in Slovakia, which is not only Westernized, it is also mining friendly. Global Minerals has an old mine that has millions of ounces of silver. The mine was inoperative, but is being re-opened and dewatered. It has expanded underground exploration and is increasing resources. The development is progressing nicely. We got on it at approximately $0.30/share. The last I saw, it’s about $0.44/share. It has so much metal in that mine, and all the conditions are set up for a great operation—mining friendly community, good country, a lot of good things going on.

TGR: Are there any companies closer to your mostly North American geography criterion that you think are interesting?

RW: One of our favorites is Pretium Resources Inc. (PVG:TSX; PVG:NYSE). We know the management. We know the property. Robert Quartermain is the president and CEO of the company. He completed very successful development projects with Silver Standard Resources Inc. (SSO:TSX; SSRI:NASDAQ). He bought these Pretium properties from Silver Standard and is building up Pretium. Next door is Seabridge Gold Inc. (SEA:TSX; SA:NYSE.MKT) with 42 million ounces (Moz) gold Proven. There is no senior miner in that district. I believe that a senior will come in and buy Seabridge and Pretium all in a package. I think that it’s looking like probably a minimum size of 50 Moz gold, if not more. Pretium is well financed and has extremely strong management with great experience. It went in there with a plan this last summer, with 50 geologists and engineers, three helicopters, and it was planning 70,000 meters of drilling. The company continues to find glory holes in that property. When Pretium bought it from Silver Standard, many glory holes were proven already and on the books by top geologists. Of course, Bob Quartermain is a geologist as well. We think that one could be at least a double or triple.

TGR: Regarding geopolitical risk, overall, Canada is a low risk jurisdiction, but portions of British Columbia might be riskier than some people are comfortable with. Is the political climate of B.C. better than most investors think?

RW: I think that the question about having problems with political situations was more of a concern in past years, maybe even as recent as a year or two ago. But a lot of that is starting to fade away. I think much has to do with the fact that communities are looking for jobs. The mining industry is labor intensive. Consequently, if they can start up a mine and be successful, it’s a real plum for the local community economically. Political pressure that drives job creation and tax revenue to the province is an advantage for the Pretium property.

TGR: Pretium already has a large market cap; do you still think there’s an upside?

RW: Pretium has many advocates. A top New York analyst several months ago, when the stock was around $8–9/share, did a fine report and was looking for a price on the shares of around $33/share. We’re looking at a price of about $38/share. We’re not that far from where he is.

TGR: What other junior companies are you keeping your eye on?

RW: Another of our favorites was a junior, and it is now more of an intermediate. That is MAG Silver Corp. (MAG:TSX; MVG:NYSE) in Mexico. MAG Silver also has joint ventures with another company on this list, Canasil Resources Inc. (CLZ:TSX.V). MAG Silver’s idea is to build a very large property position. It is looking to build a 100 Moz silver property, which would rival Peñoles (BMV:PE&OLES), which is one of the top miners in Mexico and the world. MAG Silver has a lot of cash. Management is composed of very smart people and is very experienced. Mexico, especially northern Mexico, is one of the top places to be for silver. We like the company. We like the whole situation. That one is a recent recommendation in our letter. We came in last July at about $8.77/share. The stock is up at around $12/share and still going up. If the silver prices continue to rise, it will continue to do better.

TGR: Do most of its projects wrap up into one district play, because the company website lists many projects? How do you interpret it?

RW: It has many scattered projects, but the main area of interest is really one senior-type play. It is advancing several projects on its own and with partners. We just think it’s a fabulous opportunity. Peter Megaw is the top geologist there. He’s a colleague and a friend, a person whom I admire greatly. He has a fantastic reputation in the business and knows Mexico like the back of his hand. The company has been very responsive in explaining every facet of the project to investors and we think it’s great.

TGR: Any other interesting companies that you want to mention?

RW: One is Timmins Gold Corp. (TMM:TSX.V; TGD:NYSE.MKT). It’s in northern Mexico. Bruce Bragagnolo is the CEO of that company. He has done work as an attorney with many mining companies in Vancouver for many years. Obviously, that experience showed him a lot of the pluses and minuses of the industry, and he started this company not that long ago. It is an operator, but I would call it a junior based upon price, which is running around $3/share. We recommended it back in February at $1.22/share. That particular company and that stock have been excellent for our readers, traders and investors. We’ve had some of them in and out of Timmins four or five times. Some people just buy it and sit on it. If you’re going to do a buy and hold, that would be one of the few that I would put in that category simply because it is a producer now. It employs about 650 people. The mine continues to expand. It has done everything right from the standpoint of starting and running a business. Timmins’ management is superior. We would look for that stock to do much better. It’s what I would call a good, growing stock.

TGR: Would a producer be more conducive to your modified buy-and-hold, limited trading strategy because a producer might track the underlying bullion price closer without some of the drill result-type spikes that you would see with others?

RW: That’s a good point. That’s one of the reasons why we like Timmins. Normally, with a company like Timmins, the shares might be $10, $15 or $20, but it is a young company, and it is growing quickly. But, as a producer, not just an explorer, Timmins has everything in position to continue to produce and to grow, yet is priced today somewhat like a junior company would be. It’s common for us to see these junior stocks in the $1–3 range and we see a lot of growth on the upside. Its advantages include superior management, solid financing, low-risk geography and being a producer. By being a producer it doesn’t have to go out and raise money, even though it is priced like an explorer.

TGR: All the midtier and senior miners need to start somewhere. Do you have any other examples?

RW: We are excited about Gold Standard Ventures Corp. (GSV:TSX.V; GDVXF:OTCQX) in Nevada. It has a property next door to the big senior miner, Newmont Mining Corp. (NEM:NYSE), in the Carlin Trend. That is Newmont’s Rain mine and it is doing well. Some years ago, its chief geologist told management that it was trying to buy this property. In fact, Newmont was trying to get it for 15 years, but somebody else won the prize. The group that owns it now has done a fabulous job in exploration and startup. Not only that, it hired the senior geologist from Newmont to be the consulting geologist on this project. I view the Gold Standard Ventures property as an extension of what Newmont is already mining. That’s just the way it’s viewed.

TGR: What is the name of that district?

RW: It’s called the Railroad area.

TGR: And it just added the Pinion property to the south of that, correct?

RW: Yes. As you know, that whole region, generally for the big operators, has been an incredible producer. I can’t remember the number on the amount of gold and metals they’ve pulled out of that region, but it’s just fabulous. It’s the southern end of the Carlin Trend.

Another point on Gold Standard Ventures, which encouraged me early on, is the fact that there’s a very wealthy Canadian investor who bought in early, who owns 20% of the stock. He has a history of success in investing in these companies. By owning 20% of the stock, that stock probably isn’t going to move until there is a merger, a sale or a something. Consequently, that’s a big floor underneath the price of the shares. We think that one is a top opportunity. We like it a lot.

TGR: Even though it ran quite a bit over the last year, you still think there’s upside?

RW: Yes. In our opinion as non-geologists, the property could offer a lot more in values.

TGR: In a situation like this, how would you build a position given that you are periodically trading your buy-and-hold strategy? Do you wait for pullbacks or jump in right away?

RW: We wait for a pullback. Normally, when we recommend a junior company, we are looking to find in our technical work—we are technicians—an opportunity that appears to offer a position for the shares to appreciate 25% in three months. That’s our minimum goal when we initiate a position. Sometimes the price runs faster—sometimes we get 100% or more. Then you have another decision, and that is, are you going to sell part or all? But the core of the strategy is the 25% target. Over the longer view, if you had a company like Timmins, if you wanted to hold it, and that’s one of the ones that I would prefer to hold, I would be looking to make at least 100%, but you’re probably going to have a longer timeline. You’re going to have to look at maybe a year to two years. However, based upon Timmins’ performance over time, they can run fast with the gold price too.

TGR: You’ve given the readers some really good ideas. Do you want to summarize what you think investors should keep in mind when they’re trying not to be lemmings?

RW: One important consideration investors need to keep in mind is the volume of trading in juniors. If you’re going to sell, you’re going to have to sell into strength. If you wait for a peak in gold or silver, you may not have many buyers for a junior mining stock. With certain juniors, you want to buy and hold, knowing full well you could get a 50% haircut, but then it will turn around and go right back up again. The other thing is if you buy the stock and you make a triple and you see a correction coming, it may be a good time to go in and take all the money off the table. There are also individual tax questions, and variations depending on the specific company and position, but you get the idea.

I’m very wary of the broader stock market for this fall for at least a -20% correction. After the election, we could encounter some very serious problems in credit and in stocks worldwide. It’s no secret that some of the very wealthy people, the billionaires, are selling millions of shares of general market stock right now. Some of them have been interviewed to the extent they’re afraid of another 1929 event. Nobody can really call that for sure, but as a technician, I see the charts are looking like a markets sell-off after the election. Regardless, if an investor follows a well thought out strategy of stock analysis with occasional trading, that investor will outperform the large number of lemmings over time.

TGR: Thanks so much for your time.

Roger Wiegand—aka Trader Rog—produces Trader Tracks Newsletter to provide investors with short-term buy and sell recommendations and give them insights into political and economic factors that drive markets. After 25 years in real estate, Wiegand has devoted intensive research time to the precious metals, currency, energy and financial market for more than 18 years. He is a regular contributor to theKorelin Economics Report.

Want to read more exclusive Gold Report interviews like this? Sign up for our free e-newsletter, and you’ll learn when new articles have been published. To see a list of recent interviews with industry analysts and commentators, visit our Exclusive Interviews page.

03 shaft mining.jpg


DISCLOSURE: 
1) Alec Gimurtu of The Gold Report conducted this interview. He personally and/or his family own shares of the following companies mentioned in this interview: Silver Standard Resources Inc.
2) The following companies mentioned in the interview are sponsors of The Gold Report: Global Minerals Inc., Pretium Resources Inc., MAG Silver Corp., Timmins Gold Corp. and Gold Standard Ventures Corp. Streetwise Reports does not accept stock in exchange for services. Interviews are edited for clarity.
3) Roger Wiegand: I personally and/or my family own shares of the following companies mentioned in this interview: None. I personally and/or my family am paid by the following companies mentioned in this interview: None. I was not paid by Streetwise Reports for participating in this interview. Roger Wiegand trades only futures and commodities for his personal retirement account. He prefers not to recommend shares and then be an owner of them for ethical reasons.


Gold $1,733

Despite a decade-long up gold market, most investors and professionals still don’t (and/or refuse to) grasp two things:

1-Gold has been in the “mother” of all bull markets
2- Raids and washouts have been a part of the process and shall not change as the “mother” continues its quest for a all-time inflation adjusted high.

I’ve invoked this video many times in the past  to remind you that the very small minority of us who have stayed steadfast bullish for the long-term should never forget we’re in a battle with forces that may out-man and out-media us, but the victory shall be ours.

We’re nearing the mountain top and yes, some will get picked off before reaching the top. My advice is best expressed at the end of this clip. 

The Age of Deleveraging

The world’s major economies are struggling and their private-sector is deleveraging (paying off debt). If history is any guide, this deflationary process is likely to continue for several years.

You will recall that heading into the global financial crisis, corporations and households in the developed world were leveraged to the hilt. During the pre-crisis era, debt was considered a birth right and for decades, the private-sector leveraged its balance-sheet. Unfortunately, when the US housing market peaked and Lehman went bust, asset values plummeted but the liabilities remain unchanged. Thus, for the first time in their lives, people in the developed world experienced the wrath of excessive leverage.

Today, the private-sector in the West is struggling and for the vast majority of households, their liabilities now exceed their assets. Furthermore, incomes have also declined (or vanished), thereby making the debt servicing even more difficult. Consequently, in order to avoid bankruptcy, the private-sector in the developed world is now trying its best to reduce its debt overhang. Instead of getting excited by near-zero interest rates and taking on even more debt, it is now doing the unthinkable and paying off its liabilities.

Figure 1 shows that despite the Federal Reserve’s carrot of almost free credit, the private-sector in the US is deleveraging. As you can see, since the bursting of the housing bubble, America’s companies and households have been accumulating large surpluses. Make no mistake, it is this deleveraging which is responsible for the sluggish economic activity in much of the developed world. Furthermore, this urge to repay debt is the real reason why monetary policy in the West has become ineffective.

Figure 1: America’s private-sector is not playing Mr. Bernanke’s game

1

Source: Nomura

 If you review data, you will note that in addition to the US, most nations in Western Europe are also deleveraging and this explains why the continent’s economy is on its knees.

The truth is that such periods of deleveraging continue for several years and when the private-sector decides to repay debt, interest rates remain subdued and monetary policy becomes ineffective.  Remember, during a normal business cycle, monetary easing succeeds in igniting another wave of leverage.  However, when the private-sector is already leveraged to the hilt and it is dealing with negative equity, low interest rates fail to kick start another credit binge.      

As much as Mr. Bernanke would like to ignore this reality, it is clear to us that this is where the developed world stands today.  Furthermore, this ongoing deleveraging is the primary reason why the Federal Reserve’s stimulus has failed to increase America’s money supply or unleash high inflation.  Figure 2 shows that over the past 4 years, the US monetary base has grown exponentially, yet this has not translated into money supply or loan growth.         

Figure 2: Liquidity injections have failed to increase US money supply

image003

Source: Nomura  

At this stage, it is difficult to forecast when the ongoing deleveraging will end.  However, we suspect that the private-sector may continue to pay off debt for at least another 4-5 years.  In our view, unless the US housing market improves and real-estate prices rise significantly, American households will not be lured by record-low borrowing costs. Furthermore, given the fact that tens of millions of baby boomers are approaching retirement age, we believe that the ongoing deleveraging will not end anytime soon.  Due to this rare aversion to debt, interest rates in the West will probably remain low for several years.     

It is noteworthy that interest rates are established by the supply and demand for credit. When business activity is booming and demand for credit is strong, interest rates tend to rise.  Conversely, when business activity is muted and demand for new loans is weak, interest rates tend to decline.  

In this respect, Japan’s post-bubble experience shows that despite a massive explosion in its government debt, the island nation’s interest rates have continued to fall for over 20 years!  Interestingly, Japan’s ongoing experience is consistent with America’s own prior episode of deleveraging which took place after the Great Depression. 

Figure 3 confirms that in the aftermath of the 1929 crash, US bond yields remained suppressed for nearly two decades and only normalised after 30 years!  Turning to the present situation, short term interest rates in the US are near zero and long term interest rates are at historic lows.  For sure, the Federal Reserve is partly responsible for this suppression, but we are of the opinion that the ongoing deleveraging is the chief culprit.    

Figure 3: US interest rates in the aftermath of the Great Depression

image005

Source: FRB, Banking and Monetary Statistics

It is our contention that as long as demand for credit remains weak, business activity will not pick up.  Furthermore, unless the central banks start sending out cheques to every household, inflationary expectations in the West will probably remain in check.

Today, some of the world’s most prominent central banks are engaged in quantitative easing and Mr. Bernanke has now embarked on an open-ended monthly ‘stimulus’. However, despite such blatant monetary debasement, it is interesting to note that US Treasury yields are staying near historic lows and the prices of precious metals are not going through the roof.

These developments clearly show that investors are not particularly worried about future inflation and they are still allocating capital to ‘safe haven’ assets such as German Bunds and US Treasury securities.

Figure 4 shows that despite various ‘stimulus’ programs, interest rates in many prominent economies are near historic lows.  Moreover, it is interesting to note that contrary to the consensus view, interest rates have in fact fallen over the past 4 years!         

Figure 4: Global bond yields turning Japanese? 

image007

Source: Nomura

When it comes to investing, nothing is set in stone.  Nonetheless, we expect long term interest rates to remain exceptionally low for several years.  For instance, if Japan’s post-bubble experience is any guide, then it is conceivable that interest rates may remain around current levels for another decade or longer.

Bearing in mind the fact that the private-sector in the West is refusing to take on more debt, the world’s economy is likely to remain sluggish for several years.  Under this scenario, interest rates may remain low for an extended period of time and investment returns are likely to remain muted.  Furthermore, in this age of deleveraging, we believe that the former high-flying (export dependent) economies could really undergo extreme volatility.  Last but not least, in this type of low growth environment, cyclical industries and industrial commodities are likely to disappoint investors.

Turning to the world’s largest economy, it is encouraging to note that its housing market seems to be bottoming out.  Amidst all the doom and gloom, at least this is one bright spot and a sustainable recovery in this sector will surely improve consumer sentiment. At this stage, there is no way to know whether America’s housing has already hit rock bottom, but the recent uptick in housing starts and permits are positive signs. 

Over the long run, income and household formation determine the state of every real estate market.  Generally, property prices rise in line with household incomes. 

During a real estate boom, both valuations (price to income ratio) and new construction rise above their historic trend.  Furthermore, the availability of cheap credit and relaxed lending standards fuel the euphoria and rising prices generate a herd mentality.  During the final phase of a real estate boom, property becomes a national obsession and people delude themselves into believing that ‘this time is different’.  After several years of rising home prices, the participants become convinced that their market is somehow special, therefore not subject to the laws of economics.  Interestingly, such misplaced optimism is almost always accompanied by the usual misconceptions (land is scarce, home supply is limited, central banks cannot print houses, affordability does not matter etc.)  

Unfortunately, no real estate boom lasts forever and the quality of the hangover is alwaysproportionate to the extent of the indulgence i.e. the bigger the boom, the bigger the bust.  

After the boom has turned into a bust, the opposite occurs during the downturn.  Both, valuations and new construction fall below their historic trend.  Furthermore, credit becomes scarce, property transactions evaporate and there is a buildup of unsold inventory.  Last but not least, optimism and euphoria are replaced by outright despair.              

Whether you agree with it or not, mean reversion is the most reliable feature for any real estate market.  Although real estate is one of the most cyclical assets (prone to extremebooms and busts), the property cycle is lengthy in duration and quite difficult to read.  For instance, most market participants are unable to tell where they are in any given cycle. 

In terms of the US real estate market, history has shown that its gyrations follow a somewhat regular pattern.  In fact, between 1960 and 1990, real US home prices peaked every 10 years (in 1969, 1979 and 1989).  Thereafter, a long 17-year interval occurred before the next top in 2006 and it appears as though Mr. Greenspan’s easy money policy extended the most recent real estate cycle.

Today, inflation adjusted real estate prices in the US are well below trend and mass euphoria has been replaced by abject despair.  Thus, it is conceivable that America’s housing market is now bottoming out and getting ready for the next upswing which may last for at least 10 years.

It is notable that after topping out in 2006, America’s real estate prices declined by approximately 34% over the following 6 years.  However, over the past couple of months, prices have rebounded sharply in some of the hardest hit regions and now it will be most interesting to see whether this nascent recovery can be sustained.


Puru Saxena publishes Money Matters, a monthly economic report, which highlights extraordinary investment opportunities in all major markets.  In addition to the monthly report, subscribers also receive “Weekly Updates” covering the recent market action. Money Matters is available by subscription from www.purusaxena.com

Puru Saxena is the founder of Puru Saxena Wealth Management, his Hong Kong based firm which manages investment portfolios for individuals and corporate clients.  He is a highly showcased investment manager and a regular guest on CNN, BBC World, CNBC, Bloomberg, NDTV and various radio programs.

Puru Saxena Website – www.purusaxena.com

Head Office
Puru Saxena Limited
Suite 1301, Tower One
Lippo Centre
89 Queensway
Hong Kong

Phone: (852) 3589 6789
Fax: (852) 3585 5665
contact@purusaxena.com


Fiat Currency & the Emerging Police State

“The US” transition from more-or-less free country to police state is accelerating. The NSA’s Utah data mining facility, ever-tighter restrictions on offshore accounts, the Internet “kill switch”, the Patriot Act’s many assaults on the Bill of Rights, the militarization of local police, the spread of drones for domestic surveillance; each has a role in the high-tech updating of a very old idea: that the state is paramount and the individual a slave to public order and national power.

But why is this happening now, rather than in 1950 or 2050? The answer is that we’re reaping the whirlwind that always accompanies fiat currency. We created a central bank in 1913 and freed it from the constraint of gold in 1971. Give the government or the big banks the power to create money out of thin air and you eventually get a dictatorship. “Eventually” just happens to be now.

Laissez Faire Books’ Wendy McElroy covers some of the theory behind this idea in a recent review:

Paper Money = Despotism
“Fiat” is money with no intrinsic value beyond whatever an issuing government is able to enforce. When it enjoys a monopoly as it is devastating. The personal freedoms that we know as “civil liberties” rest upon sound money.

In his classic book The Theory of Money and Credit (1912), the Austrian economist Ludwig von Mises argues, “It is impossible to grasp the meaning of the idea of sound money if one does not realize that it was devised as an instrument for the protection of civil liberties against despotic inroads on the part of governments. Ideologically, it belongs in the same class with political constitutions and bills of rights.”

A key reason Mises viewed sound money as a necessary protection of civil liberties is that it reins in the growth of government. When a government prints money without the restraint of competing currencies — even if the restraining “competition” is a gold standard — runaway bureaucracy results. Wars are financed; indeed, it is difficult to imagine the extended horrors of World War II without governments’ monopoly on currency. A white-hot printing press can finance the soaring numbers of prisons and law enforcement officers required to impose a police state.

Floods of currency can prop up unpopular policies like Obamacare or the War on Drugs. That is why government holds onto its monopoly with a death grip. In The Theory of Money and Credit, Mises observes, “The gold standard did not collapse. Governments abolished it in order to pave the way for inflation. The whole grim apparatus of oppression and coercion, policemen, customs guards, penal courts, prisons, in some countries even executioners, had to be put into action in order to destroy the gold standard.”

Another way a currency monopoly threatens civil liberties is by permitting government to monitor virtually all transactions through the financial institutions with whom it maintains an intimate partnership. Total surveillance is a prerequisite to total control, which is what the government wants to establish as quickly as possible. For example, prior to establishing the Suspicious Activity Report (SAR) in 1996 — a form that financial institutions submit to the U.S. Treasury — banks were required to automatically report any transaction over $10,000. Now any activity deemed “suspicious” is vulnerable.

The monopoly facilitates a vicious attack on privacy and has become a main building block of the American surveillance state. As libertarian Mark Hubbard stated, “Civilization is a movement toward privacy, a police state the opposite, and tax legislation has become the legislation of our new Big Brother states.”

Much of the tracking is a pure money grab, but it is also an attempt to ferret out and punish “unacceptable” behavior, like dealing in drugs or politically dissenting. Indeed, it is criminally naive to believe the government will not use these massive and valuable data to target its critics. Thus, people can be discouraged from speaking out. Controlling the information, however, means controlling the currency. Otherwise, anyone could mint gold coins in the middle of the night and release them covertly into the wild.

Some thoughts
I was going to start this article with a sentence like “Every time you turn on the news there’s another story about the growing intrusiveness of the US surveillance state.” But that’s not actually true. When you “turn on” the news, which is to say watch it on TV, you see little or nothing about this. It seems that all those “corporate media” complaints are accurate. America’s evolving police state infrastructure is one of the biggest stories of this lifetime, yet the mainstream news organizations seem to be ignoring it.

Now that we’ve created the infrastructure, all that remains is for some desperate/corrupt future leader to flip the switch. From that moment on, every communication in and out of the US will be captured, logged and mined, and each citizen will have a growing file that details their social, professional and financial activities. The state will set about silencing all emerging threats through intimidation, financial pressure (our hyper-complex tax code will be weaponized and turned on anyone who speaks out), and, when all else fails, the designation of dissenters as terrorists and their imprisonment without trial. All the tools are there, just waiting to be used.

In this scenario, social media will  be useless as a counterweight to Big Brother. When every communication is monitored, an attempt to organize a protest via Facebook will just create a list of people to be rounded up.

Can dystopia be avoided? Short of electing Ron Paul on a platform of tearing it out by the roots, it’s hard to see how. But McElroy does have one suggestion that’s aimed at the heart of the fiat currency dictatorship: end the state money monopoly and let other currencies circulate:

Yet the best solution to the harms caused by fiat is often dismissed even by staunch free market advocates; namely, allow the private issuance of money that freely competes with fiat as currency. This would involve removing all prohibitions, other than fraud, abandoning monetary controls such as legal tender laws and all reporting requirements. In turn, this might well eliminate the Federal Reserve, although people would be free to accept whatever money they wished.

The currency monopoly is vital to both the rise of a police state and the targeting of individual civil liberties. In arguing for a free market in currencies, it is important to claim the moral high ground by stating and restating what should be obvious: Civil liberties require sound money. And nothing ensures the quality of a commodity as surely as competition.


About

DollarCollapse.com is managed by John Rubino, co-author, with GoldMoney’s James Turk, of The Collapse of the Dollar and How to Profit From It (Doubleday, 2007), and author of Clean Money: Picking Winners in the Green-Tech Boom (Wiley, 2008), How to Profit from the Coming Real Estate Bust (Rodale, 2003) and Main Street, Not Wall Street (Morrow, 1998). After earning a Finance MBA from New York University, he spent the 1980s on Wall Street, as a Eurodollar trader, equity analyst and junk bond analyst. During the 1990s he was a featured columnist with TheStreet.com and a frequent contributor to Individual Investor, Online Investor, and Consumers Digest, among many other publications. He currently writes for CFA Magazine.

money-black-hole