
Timing & trends
These markets continue to frustrate the heck out of just about every kind of investor out there — whether you’re a buy-and-hold investor, an active trader, or even a day trader, or a scalper of the markets.
The markets continue to coil up in very, very tight trading ranges. It’s like watching paint dry. A lot of this has to do with the hesitation by investors to make any moves considering the still-ongoing crisis in Europe and now, very importantly, the upcoming elections, which are about two and a half weeks away.
Unfortunately, we may have to contend with this very sideways action for a couple more weeks. It’s lasted longer than I expected and it may last yet a little bit longer until we get the elections out of the way.
However, all of my economic models and my trading models do indicate that there have been no major trends changes at this point in time.
Now let’s go right to charts.
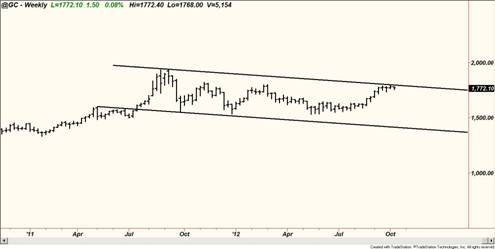
Gold: This is a weekly gold chart that I showed you in my last video update. As you can see, gold is still pressing up against channel resistance here, but it’s largely gone nowhere for the last three weeks.
The trading range in gold is tightening up — it’s roughly defined now by support at $1,750 and resistance at $1,805 and $1,823. And until we see a breakout above resistance or below support, there’s really nothing to do in gold and I urge you to stay away from it because you’ll just get chopped up.
Silver: Largely the same thing as gold. Silver has been going mainly sideways for the last week or so. It is still beneath overhead resistance but it is also still below the previous high back in February/March of this year and the previous high back in 2011, and, of course, its record high back at $50.
This overall is a bearish indication to me and I do believe silver is running out of steam like gold and we will soon see a turn to the downside.

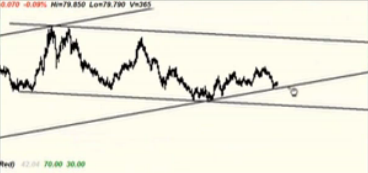
The U.S. Dollar: The dollar is really tightening up in a very coiling type of range here.
This is a weekly chart of the dollar. It’s still holding support at this uptrend line here, but largely going sideways.
And that’s true of virtually all of the major currencies. They have really been going nowhere but sideways over the last couple of weeks, indeed the last month or so.
I’ve looked extensively at the cycles for the dollar over the last few days and they all point higher, which is why I remain bullish on the dollar.
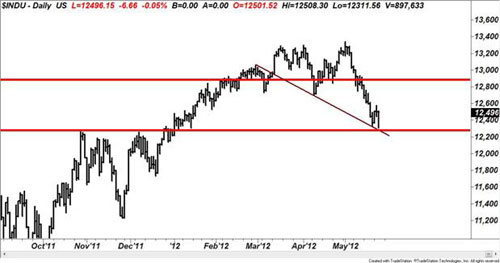
Dow Industrials: The chart of the Dow Industrials looks very much like gold — actually pushing up against upper channel resistance here but largely going sideways.
I’m afraid here, too, until we get the elections out of the way, we’re not going to see any decisive moves.
In short, I’ve said this before, there are three kinds of positions in the market: You can be long the market, you can be short a market or you can be on the sidelines. I strongly feel that right now is the time to be on the sidelines.
While it’s certainly not as exciting as being in a market, sideline-type of affairs where you’re sitting out the market waiting for high profit potential/low risk trades is often the best place to be. It not only preserves your capital, but it can also generate a return on your capital because you’re not taking unnecessary risks.
That’s it for today. Please stay tuned to everything. I’m sure we’re going to see some major progress and trending moves occur in all the markets soon — if not right before the election, certainly right after it.
Larry Edelson has over 34 years of investing experience with a focus in the precious metals and natural resources markets. His Real Wealth Report (a monthly publication) and Power Portfolio provide a continuing education on natural resource investments, with recommendations aiming for both profit and risk management.
For more information on Real Wealth Report, click here.
For more information on Power Portfolio, click here.

Market Buzz – ETFs 101 – Using Exchange Traded Funds (ETFs) to Enhance Your Portfolio
Exchange Traded Funds or ETFs are a highly versatile investment product that every active investor should make themselves fully aware of. They operate much like mutual funds in that they pool capital together to build a portfolio that is invested with specific objectives. Each investor owns a share of the fund and can redeem or sell units when they request. As a relatively new investment product, ETFs are designed to track (generate an identical return) to specific market sectors and indexes. You can buy an ETF that tracks the overall market in Canada, the market in a foreign country like China or India, a specific sector like technology or mining, or a commodity like gold or oil. Unlike mutual funds, ETFs trade like stocks, so instead of buying and redeeming a unit at its net asset value (as with mutual funds), you buy units at a price based on supply and demand, which can be above or below net asset value (but is usually fairly close).
So say you decide that you want to gain exposure to the investment returns in an emerging market like China. First of all, foreigners are forbidden to purchase a company trading on the Shanghai Stock Exchange (SEE), and even if they weren’t, where would you start? No problem, just purchase one of the several ETFs that track the index. What if you want to gain exposure to gold? You’re not naïve enough buy bullion that is stored in the Cayman Islands and you don’t have the time or the industry knowledge to start researching a bunch of gold miners. Just buy the ETF.
Passive Investing versus Active Investing
One of the most important decisions that a portfolio manager must make (whether it be a professional portfolio manager or a private individual managing their own portfolio) is whether to invest actively or passively. Active investors spend time researching investments in order to outperform the market, whereas passive investors either don’t believe it is possible to outperform the market or just don’t want to spend the required time. The passive investor simply wishes to generate a return that mimics the overall market return. One of the key differences between mutual funds and ETFs is that the vast majority of mutual funds are actively managed while nearly all ETFs (with only a few exceptions) are passively managed.
The main argument for passive investing over active investing is that over 80% of actively managed mutual funds do not outperform the market over time. Even though you are paying professional managers a hefty fee (averaging about 2% of invested assets) to generate superior returns to the market, statistically most will be unsuccessful in doing. This does not mean that you should only invest passively; there are numerous examples of skilled money managers who have generated superior returns for clients in up and down markets. However, if you are simply relying on some cookie cutter, Large-Cap mutual fund to do the job, you will probably end up disappointed; and you will be even more disappointed to find out that you paid your manager 2% + of your total invested assets to underperform a passive fund that only charges 0.5%.
The good news is you don’t necessarily have to choose between active and passive investing. There is a third choice, the hybrid approach, where you allocate a portion of your portfolio to passive investing and a portion to active investing. The hybrid investor recognizes that opportunities do exist to find undervalued investments that offer the potential for higher returns. But this investor also recognizes that investing actively also carries additional risk, requires an investment of time, and that good undervalued opportunities are not always plentiful. The exact allocation would depend on the characteristics of the investor. An investor that makes the 20%/80% between passive and active investing has a high level of confidence in either themselves or their manager to outperform the market. The investor that makes the 80%/20% allocation has substantially less confidence in the active strategy, but does not want to miss out on rare opportunity to make a great investment.
Passive Mutual Funds (Index Funds) versus ETFs
Although the majority of mutual funds are actively managed, there are also some passively managed vehicles which are referred to as index funds. Much like ETFs, index funds attempt to mimic the return of the overall market index, specific sectors or even commodities. We are not averse to investing in index funds; in fact we adamantly support them as an alternative to investing in actively managed mutual funds. In trust, there are several pros and cons with regard to investing in ETFs as opposed to index funds. One favourable characteristic that is unique to ETFs is the ‘in kind’ redemption which provides tax deferral for unit holders. When an index fund sells stock to fulfill redemption requests, the capital gain tax liability is spread amongst the unit holders, regardless of whether or not they are redeeming. Investors in ETFs can realize return by either selling their units on the open market or by exercising the ‘in kind’ redemption, whereby they would receive a basket of securities proportional to the units they are redeeming. In either instance, no tax liability is incurred by investors who are not redeeming units. For the investor that redeemed ‘in kind’, tax liability would only be incurred if they sell from the basket of securities they received (assuming there is a capital gain of course).
Understanding Discounts and Premiums
Because ETFs trade like stocks, their prices often hover above or below the net asset value contained within the fund. If the ETF is selling for more than its net asset value, it is trading at a premium, if it is selling for less, it is trading at a discount. There are a number justifiable reasons that if the premium or discount is small, then its impact should be minimal, but in some cases the difference could be significant and it can affect the return on your investment. A good example would be an ETF that tracks the return of a foreign country that restricts foreign investment. This ETF will typically trade at a premium to net asset value because it is one of the few methods that can be used to access this market. If however, the government of this foreign entity decides to loosen the restrictions on foreign investment, then the premium is likely to decline significantly and so is the value of your investment. This is a single example of how premiums and discounts on ETFs work. While I don’t suggest you try to speculate on the movement of the premium (which defeats the purpose of ETFs), it is important that you understand how it can affect your return.
How to Buy ETFs
A great thing about ETFs is that they are extremely easy to buy and sell. They trade on an exchange and like any stock, they can be purchased through a discount brokerage. You simply need to decide what ETFs you want to buy, get the trading symbol, and enter your limit order with your discount broker. Two institutions that offer ETFs in Canada are iShares (www.ishares.com) and Claymore Investments (www.claymoreinvestments.ca). You can also find additional information on ETFs at Yahoo Finance Canada (www.ca.yahoo.finance.com/etf) and Globeinvestor (www.globeinvestor.com/v5/content/etf_hub/).
Contact KeyStocks: By Email | By Phone: 1-888-27-STOCK or 604-273-1118
KeyStone’s Latest Reports Section


Looking for an interesting currency idea among the developing nations (exotics as they are sometimes referred to)? Strategically, these two nations seem to be on completely different glide paths. The nation on the upward glide path is Turkey; the one on the downward glide (potential crash landing) path is South Africa. (A good general summary on South Africa you can find in The Wall Street Journal this morning.)
Playing the lira against the rand is not a cross-rate available in the spot market for retail investors, but you can create this by creating your own cross. Buy USD/ZAR (South African Rand) and sell USD/TRY (Turkish Lira); with the magic of math, the USD cancels out and you have created a synthetic cross.
Take a look at the chart below showing the Turkish lira-South African rand cross daily: Looks like the bottom is in, and may be tracing out an impulse pattern higher…


As I watched the debate between Romney and Obama I was amazed at how strong Romney was and how weak Obama was. Romney reminded me of Ronald Reagan, the way he cocked his head and nodded patiently while Obama talked, but especially the way he focused on his “Vision” of America. Ahead of the debate the polls had indicated that Obama would be re-elected…following the debate the polls indicate a very close race…which got me to thinking about how markets might react if Romney won…about how markets had reacted 32 years ago when Reagan won.
It seems to me that the two current candidates give voters a clear choice about what kind of government, what kind of America, they want…much like Carter and Reagan gave voters a clear choice back in 1980. Under Carter America was struggling in a post-Vietnam War era…inflation had been in the teens, Volker had raised interest rates sharply to “break the back” of inflation and a nasty recession had ensued…oil prices had skyrocketed, there were lineups at the gas pumps and Carter had appeared on TV in a cardigan sweater to ask Americans to turn down their thermostats to save energy…the Russians had invaded Afghanistan…in Tehran the American embassy had been overrun, American hostages in blindfolds were paraded for the media and the American government was powerless to get their people back. America seemed mired in malaise and the voters wanted change…Reagan was elected in a landslide and declared that it was, “Morning Again in America.”
I was in New York City on Reagan’s inauguration day, January 20, 1981. There were Yellow Ribbons everywhere, the hostages were flying home, the limos were 6 deep in front of the Waldorf Astoria and the city was positively buzzing…there had been a huge change in Crowd Psychology…America was on a roll…and the markets reacted.
Market reaction to the Reagan Victory:
The US Dollar: had been in a bear market since 1971 (and the pundits of the day had forecast that it was destined to become worthless.) Beginning in October 1980 the US Dollar index rallied from 85 to a high of 165 by Feb 1985..call it a double…it then fell all the way back to 85 by December 1987.
Gold: was trading around $600 – $650 when Reagan was elected in November 1980…it fell in half within 2 years.
Commodity prices: the CRB index peaked at all-time-highs in November 1980 then fell by 1/3 over the next 2 years.
The stock market: the DJI had its best monthly close in years following Reagan’s election in November 1980 and then traded marginally higher over the next few months, but it couldn’t decisively break through the “1000 point lid” that had been on the market since 1966 and it declined from the summer of 1981 to August 1982 when the “Greatest Ever Bull Market in Stocks” began.
Interest rates: yields on US Treasuries continued to rise after Reagan was elected with the long bond breaching 15% in September 1981…then bonds began a 30+ year bull market.
My current short term market view: I continue to see the September highs in stocks and commodities as a “blow-off top” following the latest round of “Q” from global authorities and I’m trading accordingly. I think there is a risk that Market Psychology may become increasingly negative during the next couple of months.

Victor Adair
Victor Adair is a Senior Vice President and Derivatives Portfolio Manager at Union Securities Ltd. Victor began trading financial markets over 40 years ago and has held a number of senior positions during his long career as a commodity and stockbroker. He provides daily market commentary on CKNW AM 980 radio Vancouver and is nationally syndicated on Mike Campbell’s weekly Moneytalks radio show. Victor’s trading focus is primarily on the currency, precious metal, interest rate and stock index markets and his clients are high net worth individuals and corporations.
You can reach Victor Adair at:
Article provided by:
Drew Zimmerman
Investment Advisor
Union Securities Ltd. | Vancouver, BC
Tel: 604-646-2031 | Fax: 604-646-2067
Email: dzimmerman@union-securities.com
Web: www.union-securities.com

After surging sharply in August and early September, gold stocks have been consolidating sideways ever since. Naturally this loss of momentum has sapped the nascent trader enthusiasm for this sector. But stalling out temporarily certainly doesn’t negate gold stocks’ dazzling fundamentals. They remain deeply undervalued relative to gold, the metal that drives their profits and hence ultimately their stock prices.
While sentiment (greed and fear) dominates short-term stock-price swings, over the long run stock prices are nearly exclusively determined by fundamentals. Investors buy stocks to own fractional stakes in the underlying companies’ profit streams. The bigger those profits grow, the higher the stocks are bid of the companies earning them. And for gold stocks, the gold price controls the vast majority of profitability.
Unlike most other companies, gold miners effectively have infinite demand for their product. They can easily sell every single ounce of gold they manage to produce. They never have to discount, the market price is what they get. And with mining costs largely fixed, higher gold prices flow directly into bottom-line profits. And because of these fixed costs, profits rise much faster than the underlying gains in gold.
This profits leverage is easy to understand. Imagine a miner selling gold today for $1700 that it produced for $700. Its profit is $1000 per ounce. But if gold rises 25% to $2125, profits would surge to $1425 since production costs are essentially fixed as mines are planned and built. That’s a 43% increase in profits driven by a 25% gold rally! This profits-leverage growth is more exponential than linear as gold climbs.
…..read much more beginning 4 paragraphs above this this chart HERE


-
I know Mike is a very solid investor and respect his opinions very much. So if he says pay attention to this or that - I will.
~ Dale G.
-
I've started managing my own investments so view Michael's site as a one-stop shop from which to get information and perspectives.
~ Dave E.
-
Michael offers easy reading, honest, common sense information that anyone can use in a practical manner.
~ der_al.
-
A sane voice in a scrambled investment world.
~ Ed R.
Inside Edge Pro Contributors

Greg Weldon

Josef Schachter

Tyler Bollhorn

Ryan Irvine

Paul Beattie

Martin Straith

Patrick Ceresna

Mark Leibovit

James Thorne

Victor Adair