These days, some investors are so intent on seeking yield that they neglect to do their due diligence and end up having to pay the consequences. They aggressively pile into higher-yielding asset classes without understanding the true fundamentals of either the markets or the investment vehicles. In their haste, they sometimes pay more than the securities are worth.
Recently, large movements of assets have created pricing issues, not only in foreign bond markets, but also in asset classes that mainstream investors are less familiar with, such as exchange-traded funds (ETFs) and closed-end funds that invest in municipal securities. This article will discuss the types of distortions in value that we have seen, and explain how you can avoid getting caught up in them in the future.
Across The Pond, Bond Yields Turn Negative
In an uncertain economy, investors look for quality and safety. The amount of uncertainty in the global economy, however, seems to be pushing investors to seek safety at an unprecedented premium. A great example of this flight-to-quality trade comes out of Europe. For the first time in history, Switzerland, Denmark, Germany, Austria, and the Netherlands saw yields on their 2-year government bonds go into negative territory, with Switzerland recording a yield of -0.545 percent on July 16, 2012. The negative yield meant that investors were willing to pay approximately $107 for a par value bond of $100 and a coupon of 2.96 percent.
This would be similar to giving someone $100 today and expecting $99.45 back two years from now. Conceptually, it’s hard to wrap your head around, as investors typically lend money to make money, not to get less money back. But in this economy, investors seem to be paying premiums in order to preserve just some of the value of their assets. The amount of fear circulating in the markets, especially in Europe, seems to be creating distortions never seen before.
Here At Home, Temporary Premiums/Discounts Arise
There is also evidence of the quest for yield and safety on this side of the Atlantic, and, in this case, a lack of due diligence can have serious ramifications. The most obvious examples have occurred in municipal ETF and closed-end fund markets, where strong flows of assets have created large, temporary premiums and discounts.
Let’s take a look at ETFs first. Typically, because of the nature of the ETF vehicle and its share redemption policy — which is what helps to keep ETF share prices trading in line with the fund’s underlying net asset value (NAV) — you rarely see large premiums or discounts. But the aggressive risk-on/risk-off behavior that we have seen in the last 18 months has caused some ETF investors to lose money regardless of the actual price movement of the underlying basket of securities.
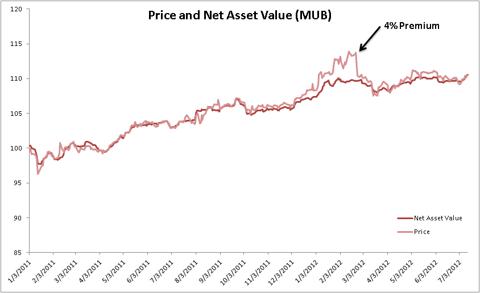
For example, the iShares S&P National AMT-Free Municipal ETF (MUB) is designed to track the yield and performance of the S&P Municipal Bond Index. Following Meredith Whitney’s erroneous prediction of massive municipal defaults in 2011, investors dumped their municipal funds in droves in the last few weeks of 2010. As a result, valuations became more attractive — so much so that opportunistic investors stepped in to fill the lack of demand present at the time, stabilizing the market and causing prices to rebound in the latter part of 2011. In early 2012, so much money flowed into tax-efficient funds that EFTs like MUB saw assets rise almost 50 percent year-over-year. This rush of assets drove the price of MUB to a premium of almost 4 percent more than the underlying NAV of the fund on February 13 (see Figure 1). Once market participants realized that MUB had reached a multi-year premium, arbitragers stepped in and quickly brought the price back to NAV in a matter of days. Many investors lost money in the process, even though the price of the underlying securities in the ETF had barely moved.
FIGURE 1. Price and Net Asset Value
Source: Commonwealth Investment Research
For comparison purposes, we’ll consider the price performance of theSPDR Nuveen Barclays Capital Municipal Bond ETF (TFI), which tracks a similar index. It increased a mere 0.25 percent from February 13 to February 27, 2012, while MUB fell by approximately 3.24 percent over the same period. Investors who blindly went into MUB in early February looking for yield and relative safety paid 4 percent more than it was actually worth and then lost more than a year’s worth of yield in a matter of days due to price and NAV compression, as the price of the security came back in line with the value of the underlying holdings.
Now let’s look at closed-end funds. A similar situation may be developing in the closed-end marketplace as well, but on a somewhat grander scale. The closed-end market tends to be much smaller and less liquid than the ETF market, so an influx of money can cause large pricing distortions. Because closed-end funds don’t have a share redemption policy like ETFs do, and fund prices are based on baskets of securities that investors don’t actually own, these funds frequently trade at discounts and premiums. Therefore, for the most part, unlike ETF prices, closed-end fund prices do move around NAV, and the fact that they use leverage exacerbates these price movements.
For the better part of the last three years, the average premium/discount for municipal closed-end funds has been around -2.90 percent, which means that these securities have often traded below NAV. Lately, however, premiums have been pushing above historical averages as investors continue to pile more and more assets into the higher-yielding municipal markets. The average premium on closed-end municipal funds now stands at 2 percent (see Figure 2). Investors, on average, are paying $102 for $100 worth of securities. Furthermore, the average spread between higher-quality securities and lower-quality securities, as defined by leverage, is approaching an all-time low. This implies that investors are concerned only with increasing their yield potential, not with understanding the underlying specifics of a fund, such as its quality and leverage.
FIGURE 2. Municipal Closed-End Fund Average Premium/Discount
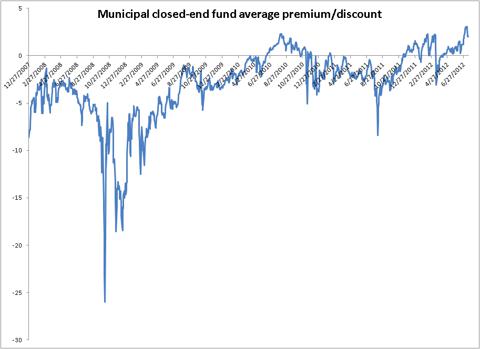
Source: Commonwealth Investment Research
As mentioned above, unlike ETFs, closed-end funds tend to employ significant amounts of leverage, often up to 40 percent. This can exacerbate the price movement of the securities, particularly in risk-off environments like we had in 2008. Often, when premiums get too stretched, prices quickly revert to NAV (or below), as was the case this past March. On March 8, 2012, the average premium for municipal closed-end funds reached a decade high of 2.14 percent. Only eight days later, it fell to -3 percent. More recently, the average topped 3 percent, surpassing the high in March and coming close to matching the previous peak set in December 1998. If history is any guide, current valuations in this market seem ripe for a short-term pullback.
Due Diligence Can Help Protect Clients’ Investments
It’s an odd situation. Even though investors have become more risk-averse with asset class selection, they seem willing to accept riskier investments in some classes of securities if there is the potential for yield. This can result in losses for investors who don’t conduct proper due diligence. To help avoid this type of pitfall, you and your clients should analyze and understand both the investment vehicle and its component securities to keep from getting caught in short-term corrections that have nothing to do with the investment’s underlying value. You don’t want to have to explain to a client that he paid more than an asset was worth simply because it was undergoing a price reversion.
If you’re looking for income-producers at a time when yield securities are priced at a premium, doing some background research can help you avoid pricing pitfalls that can lead to losses and embarrassing conversations with clients.
ABOUT THE AUTHOR
Peter Essele is a senior investment research analyst. He graduated from Union College, where he earned his BS in industrial economics. He currently holds FINRA Series 7, 24, 31, 53, and 66 securities registrations and the Chartered Financial Analyst® designation. He is also a member of the Boston Security Analysts Society.
Disclosure: I have no positions in any stocks mentioned, and no plans to initiate any positions within the next 72 hours. I wrote this article myself, and it expresses my own opinions. I am not receiving compensation for it. I have no business relationship with any company whose stock is mentioned in this article.