
Gold & Precious Metals
A bloodbath is believed to be imminent in the silver market, now that its cheerleaders have herded their flocks into the corral, ready to be fleeced again.
In the last update posted early last week, we expressed the view that an intermediate top was forming in gold and silver, a view that is reinforced further by the inability of both metals to break higher later in the week, and the now towering Commercial short position in silver as revealed by the latest COTs.
On its 6-month chart we can see how silver has continued to track sideways beneath a resistance level approaching $35. It had a go at breaking out upside on Thursday when the dollar apparently broke down, but failed, and weakened again on Friday. If we look carefully at this chart we can see that, following failure of the steep uptrend that began in the middle of August, a potential Double Top is completing beneath this resistance that portends a drop, and we have already observed several bearish candlesticks with long upper shadows developing beneath the resistance, which is a big reason why we turned bearish. Failure of the support level shown, which is probably imminent, can be expected to lead to a brutal plunge.

…..read more and view 3 more charts HERE
(Ed Note: Clive Maund’s latest on Gold including the powerful line “Commercials now have massive short positions in gold and immense short positions in silver” )
Gold Price Set for Sharp Drop, Opportunity to Go Short
by Clive Maund
It has been widely assumed across the markets that the forces of deflation have been vanquished by the Fed’s making it plain a couple of weeks ago that it is going to throw all of its firepower into the battle to defeat it. So let’s make this as clear as possible – the forces of deflation will not be defeated by anything until they done their work of expunging the massive overhang of debt from the system. The Fed’s latest stated policy is merely a display of desperation and a symptom of intellectual bankruptcy in that they seem to think that more of what created the problems in the first place is now going to somehow fix them. We are going into a depression anyway, and they have made it plain that for good measure they are going to destroy the currency into the bargain. In reality, all they are trying to do is buy as much time as possible – they know they are cornered and that the system is doomed and procrastination is all that is left to them.
Anticipation of the QE to eternity proclamation by the Fed drove the dollar down steeply, and simultaneously drove the Precious Metals higher. After the announcement was made the dollar crept higher as the dollar unfriendly news was then all priced in and it was oversold and entitled to a relief rally, and at the same time the Precious Metals trod water, moving sideways.
Right now the belief is widespread that the dollar has just completed a “bear Flag” and that another vicious downleg is starting, which will synchronize with a big rally in the Precious Metals, that many investors have positioned themselves for, but we are instead seeing important and compelling evidence that before the dollar continues much lower it will first stage a significant countertrend rally that will trigger a fairly short but possibly brutal selloff in Precious Metals markets, and if another deflationary scare should occur at some point despite the QE largesse, any such rally could be amplified by a Pavlovian flight into US debt and thus into the dollar. Let’s now review this evidence.
Our 3-year chart for the dollar index shows that there is now a quite high degree of “compression” – it has dropped a considerable distance below a still flat 200-day moving average to become oversold. The tendency to proportion in markets points to a rally of the kind projected on this chart, to complete the Right Shoulder of a large Head-and-Shoulders top. Why, fundamentally, might it do this? – here’s one very good reason; right now sentiment towards the dollar is awful, it is at negative extremes with only about 7% confident of a dollar rally. That kind of extreme just by itself is enough to generate a rally, if only because there’s virtually no-one left to turn bearish. Another good reason is that upon the Fed’s QE announcement the dollar was broadly written off as “toast”, with those doing the writing off temporarily forgetting that many other countries have plenty of reasons of their own to debase their currencies, not least Europe, which pipped the Fed at the post when the German court members, dressed in fancy red finery, and perhaps feeling the nozzle of a gun at their backs, cleared the way the day before the Fed’s revelations for massive European QE. So as the various fiat currencies jockey for position in the race to the bottom, the heat could come off the dollar for a while, with the worst news regarding it now in the public domain.

….read more & view 5 more Clive Maund charts HERE

Bill Gross, the head of PIMCO, the world’s largest bond manager, has published a jeremiad (see below) that makes my “Boomergeddon” thesis look Pollyanna-ish by comparison. To avoid an economic meltdown, says the money mogul, the United States needs to close its fiscal gap by $1.6 trillion, equivalent to 11% of the GDP. In my book, I anticipated the need to close the budget gap by a measly $1 trillion — and found the task to be so daunting as to be almost impossible.
My thought in trimming spending and/or raising revenues by $1 trillion a year was to create a U.S. budget surplus over the course of a normal economic cycle, factoring in modest surpluses during boom years and modest deficits during recessions. But Gross looks beyond the current business cycle, emphasizing crushing long-term obligations to Social Security, Medicare and other entitlements that are only beginning to kick in and will become more onerous in the decades ahead. Scarily, in his most recent essay, he doesn’t even mention the debilitating burden of paying interest on a national debt that recently passed $16 trillion and is growing relentlessly higher.
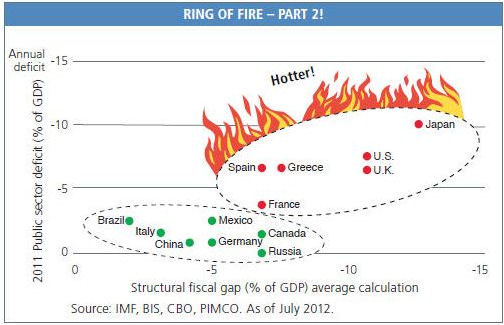
Looking at the fiscal balance sheets of the world’s major economies (as well as Greece for a point of comparison), Gross shows the U.S. in a fiscal “ring of fire” in the company of the United Kingdom and Japan. As seen in the chart above, the current deficits of all three countries are as high as Greece’s and their structural (long-term) fiscal gaps are larger.
Armageddon is not “around the corner,” Gross opines, but he does see the possibility of a “fiscal train wreck over the next decade.” It is often said that the U.S. is the cleanest of the dirty shirts, implying that we have less to fear than others do. Gross disagrees. “When it comes to debt and to the prospects for future debt, the U.S. is no ‘clean dirty shirt.’ The U.S., in fact, is a serial offender, an addict whose habit extends beyond weed or cocaine and who frequently pleasures itself with budgetary crystal meth. Uncle Sam’s habit … will be a hard (and dangerous) one to break.”
…..read the Writer’s bottom line HERE
Bill Gross, the Ring of Fire, and Gold Prices
Deborah Baratz via Money Morning
That’s because Gross, the Pacific Investment Management Co. (PIMCO) founder and co-chief investment officer, released his October 2012 investment outlook Tuesday that came with a warning for the U.S. and investors.
Gross said that U.S. fiscal problems have put the country in a “Ring of Fire” that’ll burn investors if they aren’t protected by gold and real assets.
Gross warned that recent studies have concluded that “[T]he U.S. balance sheet, its deficit and its “fiscal gap’ is in flames and that its fire department is apparently asleep at the station house.”
……read more HERE
Damages
(The Ring of Fire of Essay by Bill Gross)
– The U.S. has federal debt/GDP less than 100%, Aaa/AA+ credit ratings, and the benefit of being the world’s reserve currency.
– Studies by the CBO, IMF and BIS (when averaged) suggest that we need to cut spending or raise taxes by 11% of GDP and rather quickly over the next five to 10 years.
– Unless we begin to close this gap, then the inevitable result will be that our debt/GDP ratio will continue to rise, the Fed would print money to pay for the deficiency, inflation would follow, and the dollar would inevitably decline.
…..read Bill Gross’s The Ring of Fire HERE
As you know, I am not convinced that gold, silver and other commodities are ready to fully break out to the upside in the short term.
In fact, judging by the wicked 13% decline in oil prices in the last three weeks, I’d say deflation still has the upper hand.
Ditto for the 12.6% decline in the price of soybeans over the last month. Or the 8% decline in cocoa prices …
Or the bigger 44% decline in the price of coffee over the past 14 months … the 25% decline in sugar prices … the 34% decline in orange juice prices … and the 17% decline in economically sensitive copper prices.
Mind you, all of this is happening despite QE III and unlimited money-printing from the Federal Reserve and the European Central Bank. Not to mention more money-printing from the Bank of England, the Bank of Japan, and even the People’s Bank of China.

If you just arrived from another planet and took a look at all that money-printing, you’d think most, if not all, hard asset prices would be at new record highs.
But, as I just showed you, not only are they not at record highs, most of them are DOWN considerably.
Yes, I know gold and silver prices have been creeping up. But gold is still some $121 BELOW its previous record high. Silver is roughly 30% below its previous high. And while all this money-printing is going on!
So what gives? Why are investors so wildly bullish on commodities right now, especially gold and silver?
What the heck is really going on?
Here are my answers:
First, investors are right. Almost all commodities will explode to new record highs. Eventually.
Gold to over $5,000. Silver to over $125. Food prices to double, triple and even quadruple their current levels. Oil prices to soar to over $150 a barrel. Gas prices of $5 a gallon. And more.
All of this will indeed happen. I have always maintained that view.
But second, the main reasons are not as obvious as they might seem. You see, sometimes it takes more than money-printing to inflate asset prices.
To understand why, let’s go back in time for a few minutes. When the commodities boom first began, largely in late 1999, almost everyone was bearish commodities and bullish stocks and bonds.
Then the tech wreck came. Then 9/11. And the Federal Reserve responded with massive money-printing.
Our government simultaneously went to war, spending hundreds of billions of dollars.
Those hundreds of billions of dollars … plus the initial Fed money-printing … were enough to kick off the first phase of the commodities bull market.
But it wasn’t enough to keep propelling commodities higher and higher in a non-stop fashion. That’s because one very important ingredient was still intact: Most of the world still had confidence in the U.S. government. In Washington.
Confidence that the U.S. government would be successful in keeping us safe from terrorism. Confidence that, between Washington and the Federal Reserve, the economy could be rescued from the ravages of the tech wreck. And more.
And indeed, stocks did recover. Confidence in the government largely boomed. The best gauge: The rip-roaring bull market in U.S. Treasury bonds.
That’s why I maintain my view that until confidence in the U.S. government (and in Europe’s government) completely collapses …
Commodity prices in general are not about to take off to the moon, no matter how much money-printing is going on.
You may disagree with me. After all, we all know about Occupy Wall Street … we are all angry at investment bankers and the government and how it seems like they are cahoots with each other …
But the fact of the matter is that confidence is not fully shattered yet.
If it were, U.S. Treasury bond prices would be collapsing … and money would be flowing from bonds (confidence in government) into commodities (no confidence in government) en masse …
Setting off the next spectacular stage of the biggest commodity bull market, ever.
That time is coming. But it is not here yet.
So how will we know when it’s here; when confidence in government is completely shattered, when the next phase of the commodity bull market really gets started?
I’ll tell you what I’m watching:
First, the U.S. Treasury bond market. When Treasury prices really start to show signs of cracking, take it as your cue that confidence in Washington is about to go completely and utterly down the tubes.
Second, the U.S. dollar itself. This used to be the primary leading indicator you wanted to keep an eye on. But the dollar is now being buffeted by so many different cross-currents, especially Europe’s crisis, that it is not as reliable an indicator as it was in the first phase of the commodity bull market.
Nevertheless, the key line in the sand for me is the Dollar Index’s past record low of 72.696 on May 2, 2011. As long as it continues to hold, the next big move up in commodities is not here.
Third, I am of course watching gold prices closely. The recent rally isn’t enough to cut the mustard. Gold must close above the $1,823 level to give me a clear-cut buy signal.
Do we need all three of the above signals? No. But I’d like to see at least two of them before I can say the next phase of the commodity bull market is here.
I may be one of the only ones out there who’s not rip-roaring bullish on commodities right now, but that’s OK. It reminds me of all the other times my forecast differed and, yet, I was proven right.
Best wishes,
Larry
P.S. For more in-depth analysis of today’s rapidly changing world and markets, including very specific entry and exit points for many more recommendations, consider a membership to my Real Wealth Report.
It could not only save you tens of thousands of dollars by helping you to appropriately protect your money — but also help you garner potential HUGE profits as well. To join, click here now.
Larry Edelson has over 34 years of investing experience with a focus in the precious metals and natural resources markets. His Real Wealth Report (a monthly publication) and Power Portfolio provide a continuing education on natural resource investments, with recommendations aiming for both profit and risk management.
For more information on Real Wealth Report, click here.
For more information on Power Portfolio, click here.

More Proof they Crush the Market
In the past week, I came across an article in the Globe and Mail which highlighted an investment approach that sounded strangely familiar. The strategy was based on a paper entitled “Value Investing: The Use of Historical Financial Statement Information to Separate Winners from Losers,” authored by Chicago accounting Professor Joseph Piotroski. The paper focused on stocks with high book/market ratios (the inverse of the price/book ratio). Mr. Piotroski realized that some high book/market stocks might be inexpensive for good reason – financial distress. These we would like to avoid.
To compensate for this risk, Piotroski ran high book/market stocks (those in the market’s top 20%) through a variety of accounting-type tests to make sure they were on solid financial footing. Mr. Piotroski showed that from 1976 through 1996, a portfolio that was long high book/market stocks that passed his tests, and short those that did not, would have produced a 23% annualized return – more than double the S&P 500’s return over that period. One Canadian fund manager who is now employing a 10-stock Piotroski-inspired portfolio stated in the article that it has been the best performer of his Canadian portfolios this year. Strangely enough, 2 of the 4 stocks mentioned from the portfolio are current BUY recommendations from KeyStone.
Of course this is why the strategy seems so familiar. It has been used for half a century as part of the tool box for some of this world’s most successful investors including, an investor you may have hear a little bit about, Mr. Warren Edward Buffett.
It is part of the strategy we have employed at KeyStone for the past 14 years.
While not revolutionary, we thank the Globe and the professor for highlighting the dramatic success this type of company specific investing can produce long term in a focussed growth stock portfolio. True, it is not as sexy or easy as following a pair of squiggly trend lines on a graph that will purportedly lead you to some euphoric truth about a stock. But, it works.
In fact, a modified version of this strategy was used in our “2012 Cash Rich, Profitable Small-Cap Stock Report” – Highlighting Great Cash Rick, Cash Producing Takeover Opportunities. The report has produced tremendously positive results and we are currently preparing our 2013 version for release.
Each year, the Special Report literally takes months to complete as we scan through all TSX and TSX Venture listed Micro to Mid-Cap stocks (with a weighting towards the mid-range Small-Cap stocks) using our own blend of fundamentals, cash flow, current cash, etc. and narrow our list down to about 65 individual companies on which we perform statistical analysis and management interviews if necessary. From here, we narrowed our list to 14 companies from varying industries to highlight in our report.
The Results for 2012
In the 7 Months since our Cash Rich, Profitable Small-Cap Report was published;
1. 12 of the 14 Stocks Highlighted Have Posted Positive Gains
2. 4 of the 14 Stocks Highlighted Have Already Been Acquired (Takeovers) – Miranda Technologies Inc. (MT:TSX), La Mancha Resources Inc. (LMA:TSX), WGI Heavy Minerals Incorporated (WG:TSX), and Lifebank Corp.
3. 7 of the 65 Total Stocks Already Been Acquired (Takeovers)
4. Strong Gains Achieved in an Environment when the S&P/TSX Composite Index has Gained Only 3.8% Year-to-Date.
Sign-up for our Small-Cap Research Special Offer today via our special offer to gain access to our 2013 Cash Rich, Profitable Small-Cap Report – Do not miss out this year!
It is gratifying to see that we are looking for value and growth in the right areas and with the right methodology.
Invitation to an “Evening with Michael Campbell”
Finally, we end this week’s edition with a personal invite from our friend Michael Campbell who is hosting an evening with market prognosticator David Bensimon.
Date: Wednesday, October 10, 2012
Time: 6pm-9pm
Place: The Hyatt Regency, Vancouver
Click here for a personal invitation from Michael Campbell: http://moneytalks.net/featuring-david-bensimon.html
KeyStone’s Latest Reports Section


The Dow Industrials rose 80.75 or 0.60% to 13,575.36. The S&P 500 rose 10.41 or 0.72% to 1461.40, the NASDAQ rose 14.23, or .45% to 3149.46, and the Russell 2000 rose 5.87 or 0.70% to 844.65. Volume increased over Wednesday on the NYSE but dropped on the Nasdaq. Breadth was positive.
All nine sectors were in the green, led by financials (XLF +1.48%) for the second day in a row, with materials (XLB +1.29%) coming in second. Technology (XLK +0.29%) lagged.
Markets, including the metals, are inching higher in a timeframe (late September into mid October) where we often instead see a correction ahead of the big year-end rally.
CANADIAN SUMMARY: Leibovit Volume Reversal analysis now projects the TSX to first 13,029 and then possibly 13,529 in the months ahead based on technical action this past week! – read more HERE
Political forces, especially Ben Bernanke who I affectionately call ‘Pubic Enemy #1’ are destroying all of us, especially the middle-class by laying the foundation for the ultimate default of U.S. debt and an horrific collapse in the U.S. Dollar castrating all of us. Even Kegel exercises(described below) won’t help.
Sure, Wall Street likes this as stock prices temporarily rise and, sure, investors trapped in IRAs and 401(k) plans tied to the stock market may be celebrating over the short term. But, at what price? And, for what purpose? Bernanke’s directions come from the bankers, the cartel known as the Federal Reserve System – a private corporation whose shares are owned by both domestic and foreign banks. Keeping interest rates at zero to aid the Federal Reserve partners (shareholders) and to minimize interest payments on a huge U.S. debt are criminal acts enough. But, upholding an institution who acts and conducts itself beyond the law is intolerable in a free society. The ‘rule of law’ must be upheld and, as we know, we see it slowly crumbling around us.
Back to the current reality: Unless my work has generated false signals (not impossible), upside potential in the weeks and months ahead could still be 1000 points higher in the Dow Industrials and TSX and 100 points higher in the SPX. That said, I am patient here awaiting a clearer short-term long-entry signal. A breakout to new highs (1475 S&P 500) would one such signal, but my hope is that we pinpoint a buy coming off a correction low instead. Will we get a dip or will the PPT continue to push prices higher right into the election? We will know in the fullness of time.
Mark Leibovit’s Gold Letter, # 1 Gold Timer for 10 year period & #2 Gold Timer for 2011

Mark Leibovit
VRTRADER.COM Trial Signup: Use this month to kick our tires. Pay 50% for the first 30 days (No refund) and sample our Silver or Platinum service and then decide what works best for you. Just send an email to mark.vrtrader@gmail.com” or call 928-282-1275
IF YOU HAVE NOT SIGNED UP FOR THE LEIBOVIT VR GOLD LETTER, HERE IS YOUR CHANCE. THE October 5th EDITION IS HOT OFF THE PRESS. HERE IS THE LINK: WWW.VRGOLDLETTER.COM. YOU GET A 50% DISCOUNT FOR THE FIRST MONTH.
The Annual Forecast Model is now ‘on-line’ BUT YOU MUST SUBSCRIBE! It is a premium report. Call or email us today for a 50% discount.
Here is the link:
https://www.vrtrader.com/subscribe/index.asp
The Annual Forecast Model (The VR Forecaster Report) is published each and every year in early February and comprises Mark Leibovit’s proprietary cyclical forecast for the Dow Industrials and Gold. Don’t miss the opportunity to see this Report that projects market direction and/or important cyclical change points months in advance. We have called it our ‘Blueprint to the Future’. Unique to Mark Leibovit it has been published since the mid 1980s. Access to the report is provided via the website using the username and password provided to you.

-
I know Mike is a very solid investor and respect his opinions very much. So if he says pay attention to this or that - I will.
~ Dale G.
-
I've started managing my own investments so view Michael's site as a one-stop shop from which to get information and perspectives.
~ Dave E.
-
Michael offers easy reading, honest, common sense information that anyone can use in a practical manner.
~ der_al.
-
A sane voice in a scrambled investment world.
~ Ed R.
Inside Edge Pro Contributors

Greg Weldon

Josef Schachter

Tyler Bollhorn

Ryan Irvine

Paul Beattie

Martin Straith

Patrick Ceresna

Mark Leibovit

James Thorne

Victor Adair