Gold & Precious Metals

Managing director for the World Gold Council says yellow metal headed for 12thstraight bull year on back of centrals banks, eurozone woes and monetary easing.

Marcus Grubb is the managing director of investment for the London-based World Gold Council, where he leads both investment research and product innovation, as well as marketing efforts surrounding gold’s role as an asset class. Grubb has more than 20 years’ experience in global banking, including expertise in stocks, swaps and derivatives. After the WGC released its Gold Demand Trends Survey this month, HAI Managing Editor Drew Voros spoke to Grubb about the current state of the gold market and what is behind the yellow metal’s recent run-up.

HardAssetsInvestor: Gold and silver are peaking at three-month highs. What’s behind this? There hasn’t been a lot of news going on in the last couple of months and gold has been pretty stagnant. Why the sudden move?

Marcus Grubb: A number of factors are crystallizing to create a path of least resistance that now is upwards rather than downwards. One of them is the fact that looking into the second half of the year, talking to investors around the world, there’s still a lot of concern about the health of the financial system and the eurozone in particular. And also some challenges in the U.S. around the fiscal cliff and the sustainability of the economic recovery. However, it is clear that the U.S. is recovering better than many other Western countries around the world.

This has led investors to continue to weight towards more cautious asset allocation, increase their exposure to gold. And I think to some degree they may be diversifying from overweight positions in Treasurys and U.S. dollars.

HAI: Are you expecting gold to appreciate for the 12th straight year?

Grubb: Yes, we are expecting this to be a 12th year of the bull market for gold. And we also expect a better second half in terms of the supply-demand dynamics of the market. The first half of the year was quite challenging. We saw a small decline in gold demand. A lot of that was driven out of India. The Indian market has had some specific challenges this year—import tax, strikes in the jewelry sector—and then most importantly, a weak currency against the U.S. dollar, and one of the weakest in Asia against dollars. Gold has been very expensive in India as it’s been consolidating in dollars for about a year. It’s actually been near an all-time high in terms of rupees, which has had a dampening effect on gold demand for the first half.

In the second half of the year, you usually see stronger demand in India. We have the stocking period ahead of the Diwali Festival in October and November. And then we have the end of the monsoon rains before that, and usually you see incomes increase in rural areas and gold purchasing picks up in September, October as well. The rupee will probably still be weak, but we do think you should see a seasonable pickup and demand in India. And that will, among other things, help demand in the second half.

…..read more HERE


5 Dividend Stocks For The Next 5 Years

The Gist

These five stocks are U.S. S&P 500 basic materials companies with market caps of 2 billion or better which pay dividends all yielding more than 3.% to as much as 6.4%. Furthermore, these companies have great stories, positive catalysts for future growth and solid fundamentals. Some have been pushed lower by recent negative comments by analysts and present a buying opportunity in my opinion.

This may be a good point to start a position in these high-yield dividend-paying opportunities for two reasons. These dividend-paying stocks have the potential for both capital gains and income production. With central banks across the globe playing a game of catch-as-catch-can regarding the competitive devaluation of their currencies, these basic materials names should benefit from a reflationary trend. The combination of potential capital gains and income production makes these stocks attractive for the long run.

The Goods

In the following sections, we will perform a review of the fundamental and technical state of each company to determine if this is the right time to start a position. 

Cliffs Natural Resources Inc. (CLF)

The company currently pays a dividend with a yield of 6.40%. The company is trading 49% below its 52-week high and has 36% upside potential based on the consensus mean target price of $53.13 for the company. Cliffs was trading Wednesday for $39.09, slightly up for the day.

cliff

Fundamentally, Cliffs has several positives. The company has a forward P/E of 5.83. Cliffs is trading for 88% of book value. EPS next year is expected to rise by 28%. The company has a net profit margin of 24.43%. The company has an ROE of 24.31%.

Technically, Cliffs is definitely still in a long-term down trend. Nonetheless, all the major moving averages are starting to change the angle of decent and flatten out somewhat. The stock is cooling off from a recent spike off the 52 week low of $32 on heavy volume at the beginning of September. Cliffs’ beta is 2.34.

The company is down over two-fold from its 2008 high of $110. The stock recently bounced off a multi-year low and has moved substantially higher smashing through the 20 and 50 day smas only to give half the gains back in recent days. The turmoil in Spain has many taking profits as the third quarter comes to a close. The significant dividend yield combined with the fact the stock is near 52 week lows makes this a buying opportunity in the name. Yes, this stock is currently out of favor. Counter intuitively, that is exactly the time to buy. If you want to reduce risk further, wait until earning due out on October 22nd.

ConocoPhillips (COP)

COP pays a dividend yielding 4.63%. The stock is trading down 3% from its 52 week high and has 10% upside potential based on the consensus mean price target of $62.47. COP was trading Wednesday for $57.01, down nearly 1% for the day.

conoco

The company has many fundamental positives. COP has a forward P/E ratio of 9.59. COP is trading for 1.5 times book value. The company has a net profit margin of 10.55%. ConocoPhillips plans to achieve growth by focusing on high margin production. The company plans to reinvest cash flows to achieve organic reserves replacement of over 100%.

The stock has been in a well-defined uptrend since the start of June. The stock has pulled back to approximately 1% above the 50 day sma and is near the bottom of the current uptrend channel. I see the recent pullback as a buying opportunity.

Chevron Corporation (CVX)

Chevron pays a dividend yielding 3.10%. The stock is trading down 2% from its 52 week high and has 5% upside potential based on the consensus mean price target of $122.18. Chevron was trading Wednesday for $116.30, down nearly 1% for the day.

Chevron

The company has many fundamental positives. Chevron has a forward P/E ratio of 9.30. Chevron is trading for 1.76 times book value. The company has a net profit margin of 10.79%. Chevron’s EPS is up 47% this year. The ROE is 21.68%.

The stock has been in a well-defined uptrend since the start of June. The stock has pulled back to approximately 4% above the 50 day sma and is currently still in an uptrend. The stock is up 28% for the year. Chevron is a solid performing low beta stock.

With the Eurozone crisis coming to the fore recently, the Euro has taken a dive driving the dollar higher and consequently, dollar denominated commodities such as oil lower. Use this weakness as a buying opportunity.

E. I. du Pont de Nemours and Company (DD)

DD pays a dividend yielding 3.41%. The stock is trading down 5% from its 52 week high and has 12% upside potential based on the consensus mean price target of $56.36. DD was trading Wednesday for $50.50, up slightly for the day.

Dupont

The company has many fundamental positives. DD has a forward P/E ratio of 11.15. The company has a net profit margin of 8.66%. DD’s ROE is 31.53%.

The stock has been in a well-defined uptrend since the start of July. The stock is up over 235 over the past 52 weeks, yet has pulled back to 4% to just above the 50 day sma and is near the bottom of the uptrend channel.

Any pullback in the stock is a buying opportunity. With the recent droughts and various weather events across the globe driving crop prices higher, the demand for DD’s product will only rise. Moreover, the recent QE programs being implemented by central banks should provide support for the stock as well.

Freeport-McMoRan Copper & Gold Inc. (FCX)

Freeport pays a dividend yielding 3.18%. The company is trading 18% below its 52-week high and has 24% upside potential based on the consensus mean target price of $48.89 for the company. Freeport was trading Wednesday for $39.28, down slightly for the day.

freeportmcmoran

Fundamentally, Freeport has several positives. The company has a forward P/E of 8.18. Freeport is trading for 2.25 times book value. EPS next year is expected to rise by 42.86%. The company has a net profit margin of 21.98% and an ROE of 20.38%.

Technically, Freeport has been in a well-defined uptrend since mid-June. The stock went parabolic after the Fed announced a new round of QE was forthcoming. The recent pullback is healthy for the stock technically.

This is an ideal time to start a long-term position in Freeport. They are big producers of both copper and gold. The company is down significantly from its all-time highs and has reacted well in periods where QE has been implemented. The stock is a buy here if you have a long term time horizon.

The Bottom Line

These stocks have solid long-term growth stories and pay hefty dividends. These facts coupled with the Fed’s announcement that rates will remain at ultra-low levels for at least the next two years leads me to believe these stocks are a better hedge against inflation than fixed income instruments such as bonds and CDs. Factor this in with the statistic that historically dividend-paying stocks have outperformed non-dividend-paying stocks and you have a recipe for outstanding returns.

We are talking about buying and holding these stocks for over five years. Some may say that this means the entry point means little. I say that is nonsense. Since these will be long-term core portfolio holdings, take your time and build your full position slowly. If you choose to start a position in any stock, I suggest layering in a quarter at a time at a minimum to reduce risk.


About David Clark:

Clark received his BBA in Accounting from The University of Texas at San Antonio. Clark is a member of the Beta Alpha Psi National Accounting Honors Fraternity.

Clark writes of many divergent investing stratagems and uses fundamental and technical analysis to determine if value exists. 

Clark’s investment strategies take into account his intuitions on the macro environment coupled with an in-depth analysis of the company’s’ management, the stock’s technical status, competitive environment, growth prospects and fundamentals to include but not limited to; return on equity andprice-to-earnings. He takes into account all factors influencing the company’s short and long-term prospects to include; macroeconomic outlook, geopolitical events, sector & industry head and tail winds, new product or service future catalyst and the CEO.

Additional disclosure: This is not an endorsement to buy or sell securities. Investing in securities carries with it very high risks. The information contained within this article for informational purposes only and is subject to change at any time. Do your own due diligence and consult with a licensed professional before making any investment decisions.


Buy Gold, Sell Oil

Yeah, yeah, I know…gold and oil are both hard assets, but that doesn’t mean they will both provide a reliable hedge against the inflationary trend Ben Bernanke is creating.

In short, I like gold much better than oil…at least for the next couple of years.

The best reason to own gold is also the most well-known reason. The US government prints a lot of money, as the nearby chart plainly shows.

DRUS09-27-12-1

In round numbers, the Fed conjures about 55 million fresh dollars into existence every hour. By contrast, the entire world’s gold mines only manage to extract about $15 million worth of gold from the earth every hour and US mines only extract $2 million worth of gold per hour. In other words, Ben Bernanke creates US “money” about 27 times faster than US gold mines.

Wild stuff.

It is hard to fathom a readjustment of gold to keep up with the amount of money created. But that readjustment seems inevitable.

Obviously, inevitable is not the same thing as imminent. But there is good reason to think the gold price will top $2,000 fairly soon. The Deutsche Bank report shows how the gold price has pretty much marched in step with the Federal Reserve Bank’s money printing since 2000.

Based on all this kind of statistical analysis, even the mainstream Deutsche Bank predicts gold will top $2,000 in the first half of 2013.

The obvious take-away is to own some gold. Second, look at gold stocks — which have lagged the metal for some time and seem to be showing some life finally. The GDXJ, which is an exchange-traded fund made up of small gold stocks, is up over 25% since early May. It remains a good way to play a gold stock rally if you don’t want to take on the risks and frustrations of owning individual gold stocks.

Meanwhile, the outlook for the price of crude oil seems much less upbeat. In fact, I think the price of crude is likely to tank over the next couple of years.

I have said before that I think the oil bull market is on its last legs. In this, I’m just playing the odds. History and economics dictate what those odds look like.

For example, we know stock markets don’t trade for 30 times earnings — as the US stock market did in 2000 — for long. That was a figure far above the long-term average for stocks. And stocks subsequently crashed.

We know housing prices can’t sustain a price of 32 times the cost to rent them — as they did when housing prices peaked in 2006. That was again far above the long-term average of just 20 times. Housing prices later crashed.

Similarly, we can conclude that the current oil price — which is currently 230% above its long-term inflation-adjusted price — won’t last either.

The current bull market began in 1998. The average oil price in 1998 was just $11 per barrel. So the current bull market is 14 years old. And the US oil price is nearly nine times what it was in 1998. It’s been a great run.

Just how great you can see by looking at the previous chart. Crude oil is 230% above its long-term average in inflation-adjusted terms.

Besides, it is not as if we can’t see what will slay the oil price. There are many sharp swords all over the place.

Let us consider demand. The biggest economies on the earth — the United States, Japan, China and the EU — are all slowing down or contracting.

Let us consider supply. New technology continues to unveil giant sources of supply once thought uneconomic. David Fingold, a portfolio manager at DundeeWealth, writes:

More oil? It turns out that on top of US oil shale, Alberta oil sands, West Africa and Brazil there’s yet another massive source of oil that may be coming to market. It’s called the Bazhenov Shale, it’s in Russia and it’s big. I’m no geologist, but I’ve been told it’s similar to the Cardium in Alberta. Exxon starts drilling there next year. The energy boom of the 1970s ended when the North Sea and Alaska North Slope came on line at the same time. It seems likely more than two major fields will hit the market this decade. It’s hard to see oil becoming relatively scarce anytime soon.

The Bazhenov shale could be another game-changer for the oil industry. It is yet another massive oil source to add to a list that keeps getting longer as new technology cracks open sources once thought unreachable.

People will come up with all kinds of reasons to discount the new oil supplies. But history shows that human beings are creative and tenacious.

I was among the early investors in the Bakken in 2008. I recommended Kodiak Oil to the subscribers of Mayer’s Special Situations. The stock subsequently doubled. Back then, I remember hearing some geologists scoff at the Bakken and its potential to produce significant amounts of oil at low costs. Yet, here we are. Even now, I think people still underestimate the amount of oil the United States could produce.

On oil, I must disagree with my friend Byron King, who writes Outstanding Investments and (in a revision to his older “Peak Oil” views) now says we’re at “peak cheap oil,” or the end of cheap oil. I could not disagree more.

So one thing is certain; one of us is correct.

I say it is also a certainty that oil will be cheap again. And then it will get expensive again. Then, cheap again. And so on. In other words, just like any other commodity, it will continue to boom and bust and go through cycles. Timing is the great uncertainty.

I am interested in putting my money in areas where the odds favor me. Increasingly, I don’t see the odds favoring me when it comes to oil prices. To me, oil is much like stocks in 2000 or housing in 2006. It’s overpriced and due for a sizeable selloff.

Regards,

Chris Mayer
for The Daily Reckoning


About Chris Mayer

Chris Mayer is managing editor of the Capital and Crisis and Mayer’s Special Situations newsletters. Graduating magna cum laude with a degree in finance and an MBA from the University of Maryland, he began his business career as a corporate banker. Mayer left the banking industry after ten years and signed on with Agora Financial. His book, Invest Like a Dealmaker, Secrets of a Former Banking Insider, documents his ability to analyze macro issues and micro investment opportunities to produce an exceptional long-term track record of winning ideas. In April 2012 Chris will release his newest book World Right Side Up: Investing Across Six Continents

Special Video Presentation: Urgent Message About Your Net Worth The single, solution-packed book that could… literally… mean the difference between growing wealthy or suffering an ugly, vicious decline in your net worth. Discover how to claim a FREE copy of this book, right here.


Market prospects can be downright daunting at times. “Like Now”

5779988 orig


INSTITUTIONAL ADVISORS

FOR A FREE TRIAL GO HERE

THURSDAY, SEPTEMBER 27, 2012

BOB HOYE

PUBLISHED BY INSTITUTIONAL ADVISORS

The following is part of Pivotal Events that was

published for our subscribers September 20, 2012.

RHETORICAL ECONOMICS?

SIGNS OF THE TIMES

“Copper Surplus Presents Puzzle” – Wall Street Journal, September 11

“US Median Income Lowest Since 1995” – Financial Times, September 12 

The number is down 4.1% since Obama took office.  Table follows.

“No one will speculate against the unlimited power of a central bank. This is what stabilizes currencies of countries where investors know that. One wouldn’t gamble against the Federal Reserve, for example.” – European Central Bank Governing Council, Bloomberg, September 13

This boast could soon be another example of hubris. Wikipedia has a nice definition:

 “Hubris often indicates a loss of contact with reality and an overestimation of one’s own competence or capabilities, especially when the person exhibiting it is in a position of power.”

An earlier example occurred with the boast about a “Dream Team” of economists in December 2007.

“Fed’s Facebook Poll Finds Public Anger at QE3” – Mortgage Orb, September 18

*   *   *   *   *

PERSPECTIVE

Last week’s comments included that the action was becoming compulsive. That would be for assets on the upside and the USD on the downside. On the decline, momentum on the USD continued down to 19 on the daily RSI. Last week we noted that it was approaching the level that would limit the move.

It’s there, and in going the other way narrowing credit spreads (junk vs. treasuries) have reached 78.5 on the RSI. This is the highest since early 2010 when that level exhausted the play.

Conditions are getting stretched and one wonders about what the elastic modulus of a financial bubble is. In 2000 this page invented the term “gossamer” limit. Whatever – practical instruction is not too far away.

CREDIT MARKETS

There are times when market prospects can be downright daunting. Like now, and the emotional side can be compared to standing at the top of a Double Diamond ski run, or in a whitewater kayak going into a rapid that is a grade more severe than your comfort level. Another analogy is driving a sports car at the end of a long straight and going into a hair-pin turn. A big adrenalin rush goes with trying to brake later than the other guy.

Typically over hundreds of years, if something bad is going to happen it will happen in the fall, and recent financial action has been outstanding enough to be followed by a setback. This has been accompanied by convictions within and without the Fed that intervention can boost the markets, whenever needed. Many technical and sentiment numbers suggest that this attempt is in the market.

That the Fed and ECB have talked up their hopes so much suggests a new school – Rhetorical Economics.

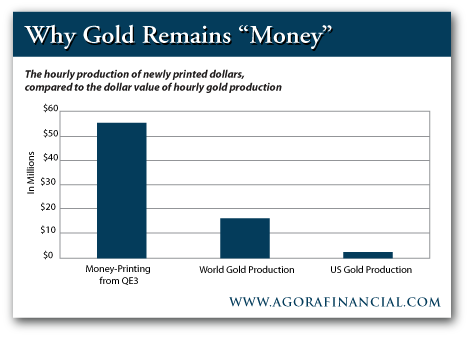
As noted above, junk bonds and spreads have been very exciting–along with the dreadful sub-prime mortgage bond. The later has soared in price from a panicked 38 last fall to 61 two weeks ago. Looked like panic buying. After a two-days of no change, it has dropped to 59 today. A distinctive drop – looking like the “Eiffel Tower” pattern that ended the long bond rally in June-July.  Quite likely the Fed will have little problem in buying $50 billion per month. 

They might have to buy more, after all the Fed generously exceeded its authority to buy bonds in the 1929 Crash – by a factor of six!

Long treasuries have firmed a little as other asset classes are stalling out. This could continue, but they are vulnerable to disappearing liquidity this fall.

Most other classes of bonds are very vulnerable.

COMMODITIES

Soybeans took out the 1700 level on this week’s decline to 1630. This dropped the grain index (GKX) down to 492, taking out support at 496. This one is technically vulnerable.

Base metal prices (GYX) have recorded the sharpest rally in a decade. Sharp approximates straight up and the last, but less vigorous, example occurred in early 2008.  This one has recorded a huge swing from oversold to very overbought at 84 on Friday and is offering some perspective.

The cyclical high in 2007 set a big “Head and Shoulders” pattern, with the Head at 537 in 2007, the Left Shoulder at 490 in 2006 and the Right Shoulder at 527 in 2008. The crash-low was 187 in early 2009.

The next and likely cyclical peak has been focused with the Head at 502 in 2011, the LS at 430 in 2010 and the RS at 428, earlier this year. For us, the cyclical peak was confirmed by the 346 low in early August.

This summer’s surge is virtually exhausted at the 400 level. As noted, this is part of the overall rise, with the Fed and the ECB accelerating it to a compulsion that is measurable.

Crude oil joined the party and a couple of weeks ago accomplished a Sequential Sell pattern. Ross thought it could run for a few more bars – and it did that and then some – the high was 101.4 Friday.

Tuesday’s 4-dollar drop in 30 minutes was an alert to change. Crude often rushes up and then suffers a sharp hit on the way to an intermediate decline.

Yesterday’s ChartWorks updated the pattern.

AMPERSAND

A number of items recorded a reversal on September 14 and then today brought a setback to global equity markets.  Perhaps related to news of European commercial banks losing deposits.

Technically, the action over the past three weeks has been impressive in forming so many excesses in so many different items. Ross is working on the review and it definitely is a cluster of signals.

Often a number different price-series get excited at the same time – just before a change.

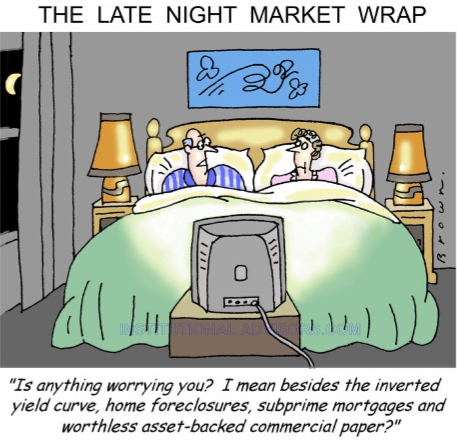
In September 2008, we published our “Cluster Cluck” cartoon. It could be appropriate now and it follows.

for a Free Trial go HERE

 BOB HOYE,   INSTITUTIONAL ADVISORS

E-MAIL   HYPERLINK “mailto:bhoye.institutionaladvisors@telus.netbhoye.institutionaladvisors@telus.net 

WEBSITE:    HYPERLINK “http://www.institutionaladvisors.com” www.institutionaladvisors.com 


CBANK
 
Peter Grandich: A technical look at gold for a moment is worthy at this time:
 
daily-gold1
 
Gold’s incredible rally after breaking out from a nearly one-year corrective/consolidation phase brought us to a quite overbought state on the daily charts noting by point A. MACD (Point C) has also turned over and the space between price and the 200-Day M.A also suggests consolidation.
 
weekly-gold
 
I depend far more on the weekly charts since I don’t usually trade gold in and out. Here, we see a much more constructive picture with RS (Point A) not even reaching overbought in this move up. The $1,800 area is key resistance (Point B) and spending some time under it shall only benefit us bulls over the longer term. MACD (Point C) has only begun to move up in earnest.
 
While some more backing and filling is actually good for those of us who see $2,000+ gold in our future, the “mother” of all bull markets should continue to limit most of its surprises to the upside.
 
dol
 
Back in the early part of 2011, I suggested the U.S. Dollar could rally and cause the U.S. Dollar Index to reach the 83-84 area (Point A) but would consider such a move a mere “dead-cat-bounce” in a secular bear market that should eventually lead to new lows below 70 (Point B). With the Euro the single biggest component of the Index and it continues to have its own turmoil, it would come as no surprise to me that the Index stay fairly close to its key moving averages (Point B) for the near-term. Longer-term, there’s only one song to sing for the dollar.
 
Ed Note: If you want to read about a mining stock that has become Peter Grandich’s “single largest holding ever (by far now) go HERE and scroll down to the chart of Oromin Explorations
 

$15,000 GOLD

by Value investor Jean-Marie Eveillard
 
Jean-Marie Eveillard who overseas $60 billion was quoted in King World News yesterday saying:
 
There are people who have figured out that in view of the enormous amount of money printing, which has taken place over the past three or four years, a price of $15,000 an ounce for gold would not be absurd.” “I’m not sure they are right, because I have not studied how they came to that conclusion, but I think what is true is there has been gigantic money printing, which will of course help the price of gold.”
 

“It’s been a fairly quick move over a shortspace of time”

by Citi technical analyst Tom Fitzpatrick

Tom Fitzpatrick has long argued that gold prices could surge. Indeed, he sees prices rallying to $2,500 within the next few months.

However, he cautions that prices are unlikely to see a straight line up, especially considering how quickly prices have surged lately.

It’s been a fairly quick move over a short space of time,” Fitzpatrick says. “We also get a bit of a push on the backs of the announcements of additional QE, but we do look to be losing a little bit of momentum short-term.”.

“Given where we’ve come from, gold has risen from almost the $1,500 level to the $1,800 area, could gold retrace back down to $1,675? It’s not at all impossible (see chart below). In the overall scheme of things it would just be a decent backfill.”

citi-gold


The Simple Case for Gold

by Charles Goyette


Charles Goyette is the author of the New York Times bestselling book, The Dollar Meltdown and the recent blockbuster release, Red and Blue and Broke All Over.

Charles case for Gold is this: Unlimited money printing means only one thing: Unlimited gold prices! 

As Charles says, just connect the dots:

As the U.S. Fed prints dollars in unlimited amounts, it devalues the dollar.

As the European Central Bank prints unlimited amounts of euros, it devalues the euro.

As the Bank of Japan jumps in to print unlimited quantities of yen, it also devalues the yen.

And as these three major currencies go down, so do virtually all other paper currencies in the world. “There’s only ONE kind of money they cannot devalue: GOLD.  As paper currencies fall, gold surges. No two ways about it.”