
Timing & trends
With Summer unofficially behind us now, we enter three of the more interesting months of every trading year.
U.S. Stock Market – The “Don’t Worry, Be Happy” crowd on Wall Street shall eat up the perception that Bernanke and the FED have or will be in QE3 mode. Despite numerous fundamental and technical reasons for concern, it’s been my belief that the path of least resistance remains up, not down. I continue to think a marginal, new all-time high is possible.

U.S. Bonds – Thanks to QE3 unfolding, I continue to hope the 10yr. T-Bond yield can get down to 1.25% It would be a screaming short if and when it does. U.S. bonds look to be the worse investment vehicle for the next decade.

U.S. Dollar – Despite something like 95%-98% bulls, the U.S. Dollar managed only a dead-cat bounce and is rolling over as we speak. This is in the face of Europe still a basket case (what does that say about the dollar once Uncle Sam shows to be even a bigger basket case next year?). The only party that doesn’t know the U.S Dollar is terminally ill is the U.S. Dollar.

Gold – The “mother” of all gold bull markets has had a classic consolidation/correction in a secular bull market that still has much left on the upside.
Please remember we shall be collecting funds for the “Tokyo Rose” of gold bears when we go to new highs.
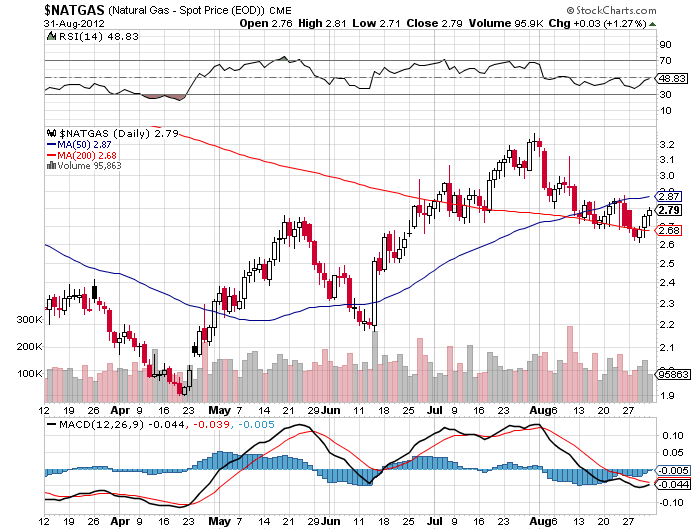
Oil and Natural Gas – Triple-digit oil is around the corner. Natural gas remains an avoid.
Special Note – The one fly in the ointment for many markets remains the belief it’s a question of when, not if, war breaks out between Israel and Iran. There are all sorts of signs suggesting it’s indeed when and the number of possible scenarios that can unfold if and when this take place are many. We shall see if and when the time comes and go from there.

The Bottom Line
Equity markets around the world recorded technical signs of at least the start of a short term correction as of August 21st that is likely to last until mid/late October. Seasonal trades in selected sectors such as gold and energy continue to show encouraging technical traits on the upside while other sectors such as transportation and semiconductors continue to show encouraging technical traits on the downside. A cautious stance in other markets and sectors appears appropriate until the second half of October when upside opportunities are expected to re-appear. (Ed Note: Equity Trends below the Mark Leibovit comment)
Mark Leibovit’s Volume Reversal Buy Signal From Friday
Precious metals came alive today as they exploded higher following Fed Chairman Bernanke’s morning speech at Jackson Hole. He expressed his concerns about the economy, and labor, and reiterated his previous stance that the Fed stands ready to act should conditions continue to soften.
The iShares Silver Trust posted a Positive Leibovit Volume Reversal on Friday, pushing it well above its 200 day moving average, which was a hurdle that had to be overcome should silver have any chance at a sustained uptrend.
The MACD (circled) is in a positive momentum position which bodes well for the continuation of this move higher.
Today certainly looks like a statement day for the silver bulls and we expect higher prices from here.
Mark Leibovit’s Gold Letter, # 1 Gold Timer for 10 year period & #2 Gold Timer for 2011

IF YOU HAVE NOT SIGNED UP FOR THE LEIBOVIT VR GOLD LETTER, HERE IS YOUR CHANCE. HERE IS THE LINK: WWW.VRGOLDLETTER.COM. YOU GET A 50% DISCOUNT FOR THE FIRST MONTH.
Equity Trends
by Don Vialoux continued
Equity Trends
The S&P 500 Index slipped 4.55 points (0.32%) last week. Intermediate trend is up. The bearish key reversal signal on August 21st remains intact. Resistance is at 1,426.68. The Index remains above its 50 and 200 day moving averages, but fell below its 20 day moving average. . Short term momentum indicators continue to trend down.

Percent of S&P 500 stocks trading above their 50 day moving average slipped last week to 71.60% from 73.40%. Percent is intermediate overbought and trending down.

Percent of S&P 500 stocks trading above their 200 day moving average slipped last week to 67.80% from 70.40%. Percent is intermediate overbought and trending down.

The ratio of S&P 500 stocks in an uptrend to a downtrend (i.e. the Up/Down ratio) increased last week to (285/126=) 2.26 from 2.20. Breakouts and breakdowns were quieter than normal. Nineteen S&P 500 stocks broke resistance and nine stocks broke support.
Bullish Percent Index for S&P 500 stocks increased last week to 71.20% from 70.40% and remained above its 15 day moving average. The Index remains intermediate overbought.

The Up/Down ratio for TSX Composite stocks fell last week to (147/79=) 1.86 from 2.07.
Bullish Percent Index for TSX Composite stocks was unchanged last week at 62.60% and remained above its 15 day moving average. The Index remains intermediate overbought.

The TSX Composite Index eased 132.97 points (1.10%) last week. Intermediate trend is up. Resistance has formed at its August 21st high at 12,196.77. The Index remains above its 50 day moving average, but fell below its 20 and 200 day moving averages. Short term momentum indicators have rolled over from overbought levels and are trending down. Strength relative to the S&P 500 Index remains negative, but is showing early signs of change.

Percent of TSX stocks trading above their 50 day moving average fell last week to 61.38% from 72.36%. Percent has rolled over from an intermediate overbought level.

Percent of TSX stocks trading above their 200 day moving average fell last week to 45.53% from 51.63%. Percent has rolled over from an intermediate overbought level.

Ed Note: More Market Charts HERE including Australia, Japan, China, London, Germany, Greece – Also Currencies, Commodities including Precious Metals – a total of 50 charts
VRTRADER.COM Trial Signup:
THE RENEWAL OF YOUR SUBSCRIPTION IS AUTOMATIC. YOUR CREDIT CARD WILL CONTINUE TO BE BILLED UNLESS YOU NOTIFY VRtrader.com SEVEN DAYS PRIOR TO SUBSCRIPTION EXPIRATION EITHER VIA EMAIL POSTING THE WORD ‘UNSUBSCRIBE’ IN THE SUBJECT BOX OR TELEPHONE US AT (928) 282-1275 OF CANCELLATION. NO REFUNDS ARE AVAILABLE ON SILVER, PLATINUM OR VR FORECASTER (ANNUAL FORECAST MODEL) SUBSCRIPTIONS.

It’s amazing. Suddenly, everyone is bullish again. Two months ago you couldn’t give away mining shares or Silver. No one wanted to buy. After back to back weekly gains (for essentially the first time since January) the gold bugs are back and proud. Bullish calls are coming out of the woodwork. This is good and all but as analysts our job is to stay ahead of the market, rather than react to or follow it, as so many professionals do. That being said, today we give you a quick synopsis of where things stand and the potential risks coming into play.
Below we chart Gold and Silver in weekly form. Gold has a bit of resistance at $1700 but strong resistance at $1800. Silver has initial resistance at $32.50 followed by stronger resistance at $35.00 and $37.50. The numbers reflect public opinion readings (source: sentimentrader.com).
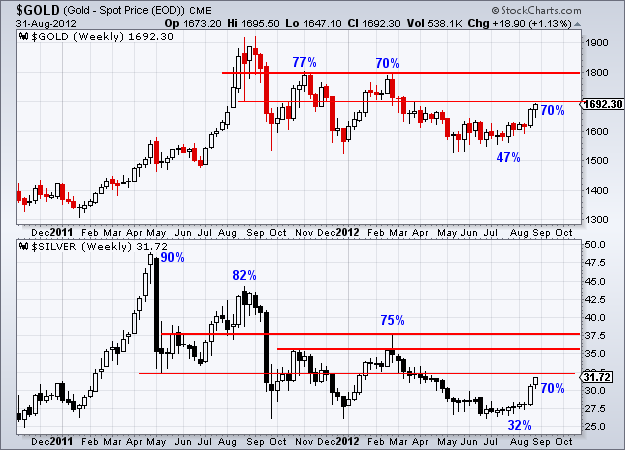
While we believe the rebound has more room to run we have to note the sudden large increase in bullish sentiment. As you can see, public opinion in Silver has surged from only 32% to now 70% bulls. Two months ago only 47% were bulls on Gold. Now its 70%. Commercial short positions have increased by a similar degree. In Silver, commercials are now short 38K contracts, which is a large increase over 23K contracts from two weeks earlier. In the same period, the net short position of commercials in Gold increased from 140K contracts to over 200K contracts. Again, Gold and Silver have more room to rebound but be wary of the increase in bullish sentiment and overhead resistance levels.
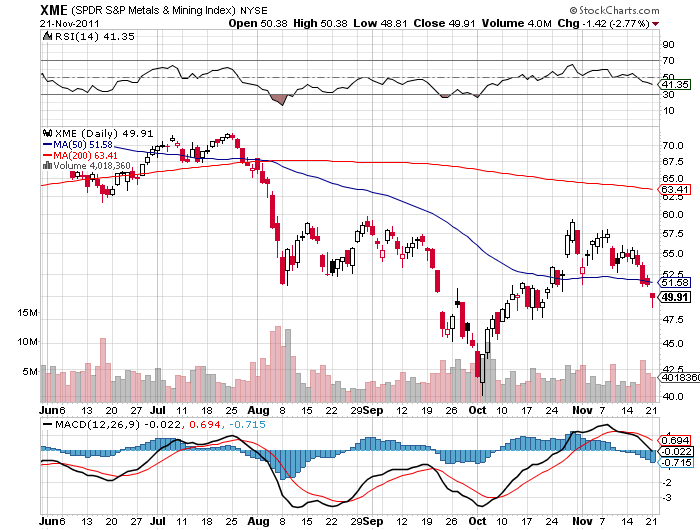
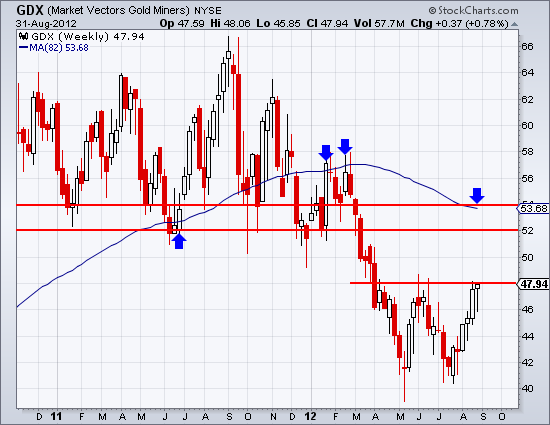
Meanwhile, on the equity side, GDX last closed at a key pivot point. A break past $48 would take the market to at least $52-$53, where the 50% retracement and 80-week moving average lie. The W bottom pattern is nine points deep so there is a potential measured target of $57, which marks the 2012 highs and strong resistance from the first quarter.
To conclude, the trend in the precious metals complex is up and remains healthy though a great deal of speculative money has come aboard in recent weeks. In addition, one should understand that precious metals markets are in recovery mode and not impulsive advance mode. There is a long way to go before the next major breakout. These markets will have to grind through the supply created from the previous downturn. Moreover, October is typically a bad month for precious metals. However, we are in September and according to the charts, this rebound has more room to run. If you’d be interested in our professional guidance in uncovering the equities poised for big gains, then we invite you to learn more about our service.
Good Luck!
Jordan Roy-Byrne, CMT
Jordan@TheDailyGold.com“>Jordan@TheDailyGold.com

Fed Gives Out 16 Trillion to Banks & Corporations In Only 30 Months!
(Ed Note: The ACTUAL “Term-Adjusted” Total of these loans is apparently net ~$1.139 TRILLION, as shown in Table 9 on pages 132 and 133 (totals on 133). Regardless, the excerpts from this article below show the situation is very bad, and the accounting is being done by the the Office of Management and Budget (OMB) which shows this Cabinet-level office loaned a Trillion plus to countries as obscure as Belgium. The OMB is the largest office within the Executive Office of the President of the United States).
“What was revealed in the audit was so startling a bipartisan Bill to Audit the Fed passed overwhelmingly 07/25/2012 HERE:
$16,000,000,000,000.00 had been secretly given out to US banks and corporations and foreign banks everywhere from France to Scotland. From the period between December 2007 and June 2010, the Federal Reserve had secretly bailed out many of the world’s banks, corporations, and governments. The Federal Reserve likes to refer to these secret bailouts as an all-inclusive loan program, but virtually none of the money has been returned and it was loaned out at 0% interest. Why the Federal Reserve had never been public about this or even informed the United States Congress about the $16 trillion dollar bailout is obvious – the American public would have been outraged to find out that the Federal Reserve bailed out foreign banks while Americans were struggling to find jobs.
In late 2008, the TARP Bailout bill was passed and loans of $800 billion were given to failing banks and companies. That was a blatant lie considering the fact that Goldman Sachs alone received 814 billion dollars. As is turns out, the Federal Reserve donated $2.5 trillion to Citigroup, while Morgan Stanley received $2.04 trillion. The Royal Bank of Scotland and Deutsche Bank, a German bank, split about a trillion and numerous other banks received hefty chunks of the $16 trillion.
The list of institutions that received the most money from the Federal Reserve can be found on page 131of the GAO Audit and are as follows..
Citigroup: $2.5 trillion ($2,500,000,000,000)
Morgan Stanley: $2.04 trillion ($2,040,000,000,000)
Merrill Lynch: $1.949 trillion ($1,949,000,000,000)
Bank of America: $1.344 trillion ($1,344,000,000,000)
Barclays PLC (United Kingdom): $868 billion ($868,000,000,000)
Bear Sterns: $853 billion ($853,000,000,000)
Goldman Sachs: $814 billion ($814,000,000,000)
Royal Bank of Scotland (UK): $541 billion ($541,000,000,000)
JP Morgan Chase: $391 billion ($391,000,000,000)
Deutsche Bank (Germany): $354 billion ($354,000,000,000)
UBS (Switzerland): $287 billion ($287,000,000,000)
Credit Suisse (Switzerland): $262 billion ($262,000,000,000)
Lehman Brothers: $183 billion ($183,000,000,000)
Bank of Scotland (United Kingdom): $181 billion ($181,000,000,000)
BNP Paribas (France): $175 billion ($175,000,000,000)
and many many more including banks in Belgium of all places
The first ever GAO (Government Accountability Office) audit of the Federal Reserve was carried out in the past few months due to the Ron Paul, Alan Grayson Amendment to the Dodd-Frank bill, which passed last year. Jim DeMint, a Republican Senator, and Bernie Sanders, an independent Senator, led the charge for a Federal Reserve audit in the Senate.” Details of the overwhelming bipartisan House Vote for the Rep. Ron Paul (R-Texas) Bill to Audit the Fed HERE
…..read more HERE.

It’s a common lament. The fundamental economic picture for the Eurozone single currency countries appears much worse, on a relative basis, than what we see in the United States, yet the euro currency doesn’t seem to reflect that reality. After much reflection on this topic, I think I finally figured it out—it’s a Pavlovian reflex response! Let me explain…
There was once a man named Pavlov. He had a dog. Being of the scientific bent, Pavlov decided to use his dog in an experiment. It was a conditioned reflex experiment. Pavlov hypothesized (which is what scientists do; investors guess as they cannot control their experiments) that if he rang a bell, then brought his dog a bowl of food, the dog would become conditioned to the bell ringing. Pavlov’s hypothesis proved correct for as soon as he rang the bell, the dog began to salivate in expectation of the food to follow. Thus it wasn’t the food itself that engendered the reflex, but the expectation of the food.
Insert European Central Bank, the European Union, and International Monetary Fund, collectively known as the “Troika” in place of Pavlov and “your average punter” in place of the dog and now you can understand why the euro is being supported—it is an expectation the future will be like the past.
The last time the power of ECB market intervention on a broad scale was put on display, bond yields fell and the euro rose sharply. The catalyst was the announcement of a Long Term Refinancing Operation (LTRO) announced back in October 2011. The LTRO was designed to provide the European banking system with a significant dose of liquidity. It succeeded, for a while, as you can see clearly in the chart below:

Below is the price action in the euro highlighted after the LTRO was announced on October 6th 2011; the euro rallied about 10 cents against the US dollar over the following two-week period:
So, will it be déjà vu all over again when Mr. Draghi announces bond-buying plans next week?
Bond buying, or put another way—the transfer of wealth from richer, more productive, taxpayers in the North to less productive more corrupt taxpayers in the South, will not change the core problem at the heart of the euro, which is this: the weaker countries cannot compete against Germany when they all use the same currency. If they try, it will mean decades of internal adjustment for the likes of Italy, Spain, Greece, and Portugal. It will mean lurching from one crisis to another, and muddling through at best.
For about seven years the periphery countries were able to borrow at interest rates on par with Germany. What good did that do other than allow consumers in the periphery to buy a whole lot of German made goods?
The Southern states, including Italy, Spain, and France, with the full support of the European Central Bank (ECB), now believe Germany needs the Eurozone to survive (because Germany’s growth model is one of export-dependence) and therefore will ultimately agree with the idea of making the ECB a tool for socializing risk—distributing more Northern wealth.
But, as the Eurozone recession deepens, I suspect Germany’s political and economic incentives to keep funding the single currency project will fade in direct proportion to the country’s falling trade surplus, falling industrial order book, and rising unemployment rate; all of which are now underway.
In short, the future may not be like the past. If the euro has already discounted what I’ve shared here, then there is a bell ringing, and it doesn’t mean food is on the way. It means the 600 pip rally we’ve seen in the euro from the July 24th low at 1.2041 is likely over and the long march down to par will continue in earnest.

Note: If you would like more information on this publication you can contact us at info@blackswantrading.com or view our offerings at our website: www.blackswantrading.com
Black Swan Capital’s Currency Currents is strictly an informational publication and does not provide personalized or individualized investment or trading advice. Commodity futures and forex trading involves substantial risk of loss and may not be suitable for you. The money you allocate to futures or forex trading should be money that you can afford to lose. Please carefully read Black Swan’s full disclaimer, which is available at http://www.blackswantrading.com/disclaimer

-
I know Mike is a very solid investor and respect his opinions very much. So if he says pay attention to this or that - I will.
~ Dale G.
-
I've started managing my own investments so view Michael's site as a one-stop shop from which to get information and perspectives.
~ Dave E.
-
Michael offers easy reading, honest, common sense information that anyone can use in a practical manner.
~ der_al.
-
A sane voice in a scrambled investment world.
~ Ed R.
Inside Edge Pro Contributors

Greg Weldon

Josef Schachter

Tyler Bollhorn

Ryan Irvine

Paul Beattie

Martin Straith

Patrick Ceresna

Mark Leibovit

James Thorne

Victor Adair