
Currency
A head-and-shoulders pattern in the US dollar chart has broken down and it looks like a big fall is coming for the greenback (see chart below). The warning indicator is rising gold and silver prices, up three and nine per cent respectively last week, a trend that is likely to continue with some volatility.
In his latest commentary chartist Clive Maund said: ‘As we can see on the 8-month chart for the dollar index its drop last week has brought it down to a clearly defined important support level, with this sharp move towards a rising 200-day moving average creating a considerable degree of ‘compression’ that coupled with the support at the current level is likely to trigger a rebound. It looks like a head-and-shoulders top is forming in the dollar.
‘…so a likely scenario here is that we see a rebound short-term which takes the index back up towards the left shoulder high in the 83 area, and such a rebound would of course be the occasion for a reaction back in gold and silver, which should be jumped on as an opportunity to build positions further ahead of the major breakout. Here we should note that the dollar looks very weak so it might not make it as high as 83 before it turns tail and breaks down.’

Posted on 27 August 2012Categories: Banking & Finance, Bond Markets, Gold & Silver, US Dollar via ArabianMoney.net

I moved to the sidelines Tuesday Aug 21 after being bullish the US stock market for the past couple of months. I posted a note on my blog Tuesday Aug 21 about my “change of heart.”
On Aug 20 I had said that I would remain long until the market told me that it was no longer going up…well, I think we got a signal that the short term rally is running out of steam. I did NOT go short…the trend remains up from the June 4, 2012 lows, the Oct 4, 2011 lows and the March 2009 lows…as my long time friend Dennis Gartman says, “In a bull market there are only three different positions you can have, long, really long or aside.”
The “psychological set-up” for what looks to be at least a short term top had several parts:
1) the VIX, the fear index, had closed at a 5 year weekly low close Aug 17…no worries mate,
2) the DJI had closed Aug 17 at its highest weekly close since Dec 2007,

3) the DJI had rallied ~10% from the June 4 lows…on very low volume and could easily have been seen as short-term overbought,
4) the story of Apple’s rising market cap was becoming increasingly public…the “news” that it had eclipsed the previous All Time High Market Cap set by Microsoft years ago hit the “front pages” all over the world on Monday…and on Tuesday APPL jumped to new all time highs early in the day…dragging the overall market with it…and then turned lower…taking the overall market down,
5) the S+P 500 share index briefly traded to new highs for the year on Tues Aug 21, and to its best levels since May 2008, but then turned lower,
6) The Spanish and Italian stock markets turned lower early Tuesday, after being the hottest stock markets in the world since Draghi’s famous, “We will do whatever it takes” comment July 26,
7) US bond yields, which had been trending higher since July 26, turned lower Tues Aug 21.
The DJI dropped 300 points from Tuesday’s highs to Friday’s lows. It rallied back Friday on media comment suggesting that QE3 is coming soon….and perhaps also rallied back on short covering after a quick 3 day drop…the market has, after all, been climbing a wall of worry for nearly 3 months…the 300 point drop in the DJI may have been only a brief correction.
QE3: There was a lot of speculation this past week about QE3…especially following the release of the Fed minutes on Wednesday. There were public comments from Fed members and lots of media comment. The timing of QE3 is particularly in question with the Jackson Hole meetings at the end of this week and the November elections looming….it would seem that if the Fed is going to start QE3 they have to act soon.
In precious metals the sequence of the rallies had Platinum first out of the gate (Aug 16) with specific impetus from the violence at the South African mine, then Silver broke out (Aug 20) and lastly Gold broke out (Aug 21.) The PMs had been in a narrowing range for the past few months and a breakout appeared imminent. The upside breakout in gold on rising open interest is positive…but I was not a buyer…either I was too slow to see the opportunity or a little suspicious of the move in the thin markets of late August …or both.
Trading: I start this week virtually flat in my short term trading accounts…looking for worthwhile trading opportunities…and hoping to trade what the market is doing…rather than what I think it should be doing!
Article provided by:
Drew Zimmerman
Investment Advisor
Union Securities Ltd. | Vancouver, BC
Tel: 604-646-2031 | Fax: 604-646-2067
Email: dzimmerman@union-securities.com
Web: www.union-securities.com
Victor Adair
Victor Adair is a Senior Vice President and Derivatives Portfolio Manager at Union Securities Ltd. Victor began trading financial markets over 40 years ago and has held a number of senior positions during his long career as a commodity and stockbroker. He provides daily market commentary on CKNW AM 980 radio Vancouver and is nationally syndicated on Mike Campbell’s weekly Moneytalks radio show. Victor’s trading focus is primarily on the currency, precious metal, interest rate and stock index markets and his clients are high net worth individuals and corporations.
You can reach Victor Adair at:

Three weeks ago we wrote that the short–term outlook in precious metals was bullish. Quoting our conclusion: “The bottom line is this sector is very close to a breakout which would likely confirm the May bottom. The price action has started to improve and the sector has not been deterred by the aforementioned bad news which, in normal conditions would have caused a selloff. In the meantime, the public has been bearish the entire year and the dumb money has started to exit the market. It is this combination of factors that lead us to a firm bullish posture over the rest of the summer.” In terms of weekly closing prices, GDX and SIL closed last week at a four month high, while GDXJ closed last week at a three month high. Silver closed at a four month high while Gold closed at a five month high. From that it would seem that these markets are overbought. However, a quick study of the long-term charts, sentiment and valuations confirms that we are in an absolute sweet spot. Markets have bottomed, a new cyclical bull has begun and there is substantial room to move over the coming months and year.
We begin with a chart of the bull market in the HUI and we highlight the cyclical bear markets. The 2011-2012 bear lasted about as long as the 2004-2005 bear but was a bit deeper (42% versus 36%). The fact that this bear corrected the recovery from the 2008 crash could be why various valuation and sentiment indicators are at such compelling levels (as annotated in the chart).

Next we chart our proprietary Silver index, which is comprised of 10 “growth oriented producers.” (The ETF SIL only has a few years of history). This index corrected 60% in 2004, 90% in 2007-2008 and 50% from 2011-2012. The current bear market was the almost the longest (short of the 2007-2008 bear) but the smallest with only a 50% correction. Yes, to say only 50% is ironic but in looking at the chart one can see that the correction appears to be quite routine. This chart has potential to be a cup and handle pattern which could have massive bullish implications for the next few years.
How does this bull market compare to the past? The Barron’s Gold Mining Index (BGMI) had two tiny cyclical bears and two large cyclical bears. The circles show consolidations within cyclical bulls which lasted more than three years.
Visually we can understand why the sector is beginning a new cyclical bull market. Yet let’s take a look at some simple sentiment and valuation data. Below we show info ℅ SentimenTrader which shows the Rydex Precious Metals Fund. At the recent bottom, the assets were the lowest they’ve been since 2008. In fact, going back 10 years, it was the second lowest point (with 2008 being first). Also note that the precious metals assets (as a percentage of all Rydex funds) were at a minimum of a six year low.
Next, we’ve shown this before but it’s worth showing again. We calculated that the PE ratio of the HUI Gold Bugs Index at the May low was 12x earnings. This chart from the Erste Group displays the year by year PE of the HUI. If Gold moves higher then earnings should increase. Combine that with rising valuations and that explains the potential for substantial gains.
The confirmation of the bottom is obvious. Now what? Well, the question is if the sector will continue to zoom higher similar to 2005 and 2009 or if it will consolidate for months (similar to 1972 and 1977) before making a parabolic advance in less than two years. In any event, that is just semantics and for the hyper traders out there. In either scenario we are early in a new cyclical bull and there is tremendous opportunity to be had. If you’d be interested inour professional guidance in uncovering the equities poised for big gains, then we invite you to learn more about our service.
Good Luck!
Jordan Roy-Byrne, CMT
The Bottom Line
Equity markets on both sides of the border have had a good ride since their lows on June 4th. Now they are showing short and intermediate technical signs of an intermediate peak. It’s time to take profits in selected seasonal trades such as agriculture and leisure & entertainment. Other seasonal trades such as energy and gold have additional intermediate upside potential, but no longer are buy candidates. A cautious stance appears appropriate until the second half of October when upside opportunities are expected to re-appear.
Economic News This Week
The June Case/Shiller 20 City Home Price Index to be released on Tuesday at 9:00 AM EDT is expected to improve on a year-over-year basis from -0.7% to -0.3%.
The August Consumer Confidence Index to be released at 10:00 AM EDT on Tuesday is expected to slip to 65.5 from 65.9.
The Fed Beige Book is scheduled to be released at 2:00 PM EDT on Wednesday.
U.S. second quarter revised real annualized GDP to be released at 8:30 AM EDT on Wednesday is expected to be revised upward to 1.7% from 1.5%.
July Personal Income to be released at 8:30 AM EDT on Thursday is expected to increase 0.3% versus a 0.5% gain in June. July Personal Spending is expected to increase 0.5% versus no change in June.
Weekly Initial Jobless Claims to be released at 8:30 AM EDT on Thursday are expected to slip to 370,000 from 372,000 last week.
Canada’s June GDP to be released at 8:30 AM EDT on Friday is expected to slip to 1.6% on a year-over-year basis versus growth at 1.9% rate.
The August Chicago Purchasing Manager’s Index to be released at 9.45 AM EDT on Friday is expected to slip to 53.5 from 53.7 in July.
The August Michigan Consumer Sentiment Index to be released at 9:55 AM EDT on Friday is expected to remain unchanged at 73.6.
Other Issues
The VIX Index jumped 1.73 (12.9%) last week. Short term momentum indicators are trending higher from oversold levels.

The earnings focus this week is on the Canadian banks. Look for modest gains on a year-over-year basis. At least two of the banks are expected to increase their dividend.
Economic reports this week are expected to have a mildly negative impact on equity markets (Consumer confidence, Chicago PMI, Michigan consumer sentiment).
Macro news heats up this week. The focus is on Bernanke’s speech next Friday at 10:00 AM EDT and Draghi’s speech on Saturday morning. Other events to watch include Eurozone consumer confidence on Thursday and China’s PMI next Saturday (estimated to fall from 50.1 to 49.8).
Short and intermediate technical indicators for most equity markets and sectors are overbought and are showing signs of rolling over. Mary Ann Bartels, Merrill Lynch’s technical analyst predicted downside risk by the S&P 500 between now and the end of September at 8-10%. Following is a link from CNBC to her video: http://www.cnbc.com/id/48756751
North American equity markets have a history of moving lower from the beginning of September to mid-October during a U.S. Presidential election year (particularly when polls show a close race. Thereafter, equity markets move higher regardless of who wins.
September is the weakest month of the year for North American equity markets. This is the month that analysts review their estimates for the current year, realize their estimates are too high and revise them accordingly. History is about to repeat.
Other issues that could impact equity markets include Hurricane Isaac, the Republican convention and increasing media comments about the possibility of Israel attacking Iran before the Presidential election.
Cash on the sidelines on both sides of the border is substantial and growing. Bank of Canada’s Mark Carney highlighted the situation in Canada last week. However, political uncertainties (including the Fiscal Cliff) preclude major commitments by investors and corporations before the Presidential election.
Equity Trends
The S&P 500 Index slipped 7.03 points (0.50%) last week. Intermediate trend changed from neutral to up when the Index briefly moved above resistance at 1,422.38. However, the Index also recorded a bearish key reversal last Tuesday implying the likelihood of at least a short term peak. The Index remains above its 50 and 200 day moving averages, but is testing its 20 day moving average. Short term momentum indicators have rolled over from overbought levels and are trending down.
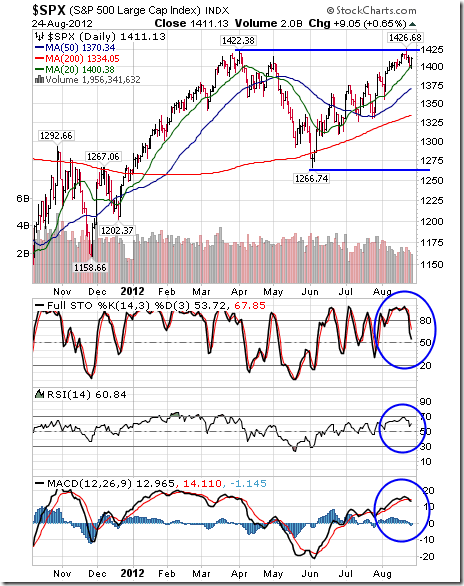
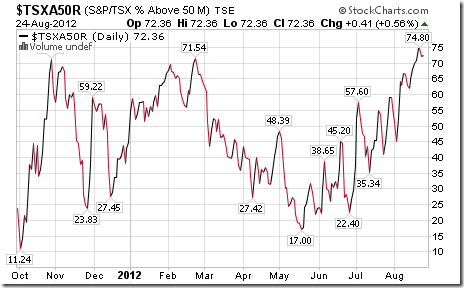
Percent of S&P 500 stocks trading above their 50 day moving average fell last week to 73.40% from 81.40%. Percent is intermediate overbought and has rolled over from above the 80% level, a frequent indicator that the Index has passed a short term peak.

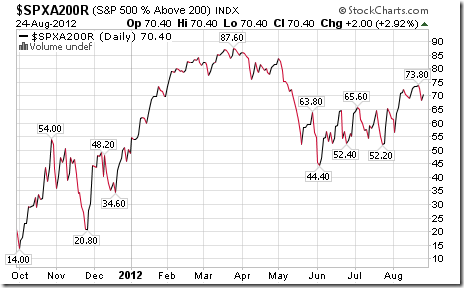
Percent of S&P 500 stocks trading above their 200 day moving average slipped last week to 70.40% from73.40%. Percent is intermediate overbought and showing early sign of peaking
The ratio of S&P 500 stocks in an uptrend to a downtrend (i.e. the Up/Down ratio) slipped last week to (279/127=) 2.20 from 2.26. Twenty three stocks broke resistance and 24 stocks broke support (mostly utility stocks).
Bullish Percent Index for S&P 500 stocks increased last week to 70.40% from 70.00% and remained above its 15 day moving average. The Index is intermediate overbought.

The Up/Down ratio for TSX Composite stocks increased last week to (151/73=) 2.07 from 1.72. Twenty stocks broke resistance and two stocks broke support.
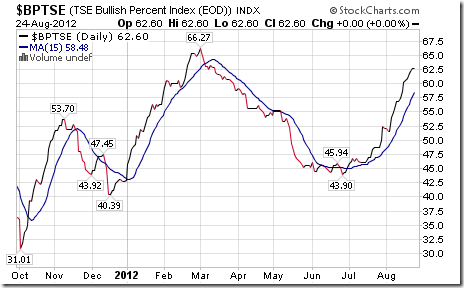
Bullish Percent Index for TSX Composite stocks increased last week to 62.60% from 60.57% and remained above its 15 day moving average. The Index remains intermediate overbought.
The TSX Composite Index slipped 7.66 points (0.06%) last week. Intermediate trend is up. The Index remains above its 20, 50 and 200 day moving averages. Short term momentum indicators are overbought and showing early signs of rolling over. Strength relative to the S&P500 Index has been negative, but is showing early signs of change.
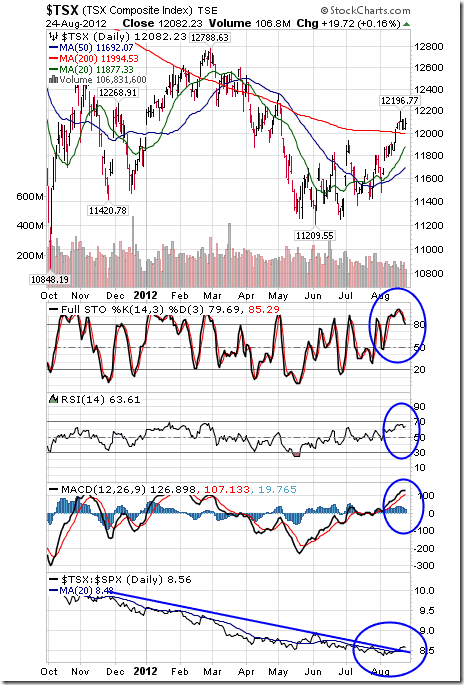
Percent of TSX stocks trading above their 50 day moving average increased last week to 72.36% from 69.92%. Percent is intermediate overbought above the 70% level. Peaks from above the 70% level normally lead to at least a short term correction by the Index.
Percent of TSX stocks trading above their 200 day moving average increased last week to 51.63% from 48.37%. Percent is intermediate overbought.
…..for 40 more charts and commentary go HERE
Don Vialoux
Don Vialoux has 37 years of experience in the Investment Industry. He is a past president of the Canadian Society of Technical Analysts (www.csta.org) and a former technical analyst at RBC Investments. Don earned his Chartered Market Technician (CMT) designation from the Market Technician Association in 1995. His CMT paper entitled “Seasonality in Canadian Equity Markets” was published in the Spring-Summer 1996 edition of the MTA Journal. Don also has extensive experience with Exchange Traded Funds (also know as Index Participation Units) as well as conservative option strategies. In 1990 he wrote a report that was released in the International Federation of Technical Analyst Journal entitled “Profiting from a Combination of Technical and Fundamental Analysis”. The report introduced ” The Eight Phases of the Stock Market Cycle”, an investment concept that continues to identify profitable entry and exit points for North American equity markets. He is currently a member of the Toronto Society of Fundamental Analyst’s Derivatives Committee. Now he is the author of a daily letter on equity markets available free on the internet. The reports can be accessed daily right here at www.dvtechtalk.com.
Impossible! That’s what institutional investors say about “Timing the Market”. Mr. Vialoux will explain that, indeed, it can be done with the appropriate analysis. He also will explain why timing the market will be important during the next decade. Buy and Hold strategies are not working anymore; Investors are looking for alternatives. Mr. Vialoux will demonstrate four techniques that can be used to time intermediate stock market swings lasting 5-15 months. The preferred investment vehicles for investing in intermediate stock market swings are Exchange Traded Funds.
Security positions held or not held by Mr. Vialoux will be indicated at the end of each Tech Talk report.
Comments in Tech Talk reports are the opinion of Mr. Vialoux. They are based on technical, fundamental and/or seasonal data that is believed to be accurate. The comments are free. Mr. Vialoux receives no remuneration from any source for these services. Comments should not be considered as advice to buy or to sell a security. Investors, who respond to comments in Tech Talk, are financially responsible for their own transactions.
All charts in Tech Talk come from StockCharts.com. Stock Charts can be accessed at no cost throughwww.stockcharts.com.

If it turns out I’m wrong about the coming moves in the markets, so be it. I’ll make tons of money anyway, and so will those following my forecasts.
Reason: I’m not a perennial bear, like a stopped clock that’s right twice a day. I’m actually very bullish long term on everything from precious metals to stocks — the only exceptions being U.S. Treasury bonds and the dollar.
So when the real bull emerges for gold, silver, oil, and other commodities and stocks, I’ll be riding it — planning to make more money in the next two to three years than most people make in a lifetime.
And those gains I plan to make will be amplified by what’s about to happen in the short term, where giant traps are about to slam shut on many investors and traders who are getting caught up in the recent, premature rallies.
Let me review the major markets for you, and why I believe they are headed for a surprising fall.
First, I’ll start with the fundamental backdrop to all the markets. Europe’s nightmare is not over.
Yes, the European Central Bank seems to be moving closer and closer to a full-scale assault on the euro-zone’s crisis by printing money.
But the deal’s still not done, and yet nearly all markets are acting like it is.
Germany stands in the way. This past week, its Bundesbank apparently made some remarks that if the ECB is to print more money, the Bundesbank wants to be in control of it AND the ECB.
So ECB money-printing is not a done deal. But here’s the catch: Even if the ECB starts printing endless amounts of euros, what’s that going to do to the euro?
It’s going to slam it to the mat, and send the U.S. dollar soaring.
A soaring dollar will, in turn, add to the disinflationary forces already impacting the U.S. economy. That will send stock markets lower, gold lower, silver into a tailspin, copper down the tubes, and more.
A plunge in the euro and rally in the dollar won’t help Europe’s economy, either.
Most of Europe is now not in a recession, but rather, a depression. And as the euro plunges, capital flight out of the healthier European economies such as France and Germany will escalate, hollowing out the rest of the euro zone.
Meanwhile, while the U.S. economy is indeed in better shape than Europe’s, our self-centered leaders in Washington are doing nothing about the deficit … nothing about the interest on the debt … and nothing about the upcoming fiscal cliff.
All they care about is the elections. Yes, they will solve the fiscal-cliff dilemma of spending cuts and tax hikes — reaching some sort of compromise. But it won’t happen until the 11th hour, in late December.
Meanwhile, the uncertainty and the growing recognition that our leaders are full of you-know-what is soon going to destroy confidence in the markets, and this won’t be bullish. It will be bearish, leading to nervous selling and liquidation.
At the same time, China is showing additional signs of slowing.
Let me be perfectly clear: China and Asia in general remain in very good shape, and in long-term bull markets.
But short term, there’s no question that neither Europe nor the U.S. can rely on China stoking up the global economy.
(That’s ironic isn’t it? It used to be that the world looked toward the U.S. to support the global economy. Now the world looks to China!)
Additionally, I see no technical evidence that the recent rallies in metals and stocks are anything but a giant trap.
Consider gold, for instance: As this weekly gold chart clearly shows, gold’s recent rally is weak, at best, and nothing but a corrective relief rally.
First, notice the downtrend line from the 2011 record high. It’s still very much intact and is now providing major overhead resistance at the $1,650 to $1,670 level.
Second, notice the downward-sloped red line higher up, labeled as a cyclical trendline. This is the TRUE breakout point for gold.
Gold needs to close above that line, more specifically above my system buy signal at $1,727.70, to confirm a breakout and a new bull leg higher.
Given all the resistance before that comes into play, I doubt very much that gold can pull off a breakout now, especially since the short-term cycles will soon be pointing down, into September.
Also notice the rounded formation of gold’s recent sideways-to-higher trading action. That’s corrective trading action, meaning this is the kind of trading action that is indicative of a correction to a bear market, and not the start of a new bull leg higher.
What about the fundamentals for gold? Yes, the long-term fundamentals are bullish. Europe and the United States are facing a monetary and sovereign-debt crisis. One that will eventually send gold to well over $5,000 an ounce.
Which is precisely why I recommend that long-term investors hold their gold. But in the short term, Europe’s crisis — which is not over — is bearish for gold.
In addition, gold demand in India and China is actually falling.
Now let’s look at …
The U.S. Dollar: I’m the original bear on the U.S. dollar, and I pegged its bear market starting way back in the year 2000.
The dollar remains in a long-term bear market. But short term, it’s about to turn much higher.
Fundamentally, as Europe begins to print more money (and it will eventually), the euro will fall and the dollar will rally, by default.
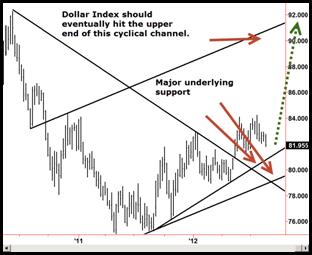
System-wise, the Dollar Index also remains short- and intermediate-term bullish. Only a Friday close below 80.65 on the index would negate that.
Meanwhile, a move above the 84.60 level will point to a massive rally in the Dollar Index up to near the 92.00 level.
The chart of the Dollar Index is also bullish. Support is scaled in at the current level of 81.80-81.90, followed by 80.65 and 79.00.
Silver: If you think silver is now headed back to $50 and higher, think again. Just look at this weekly chart of silver.
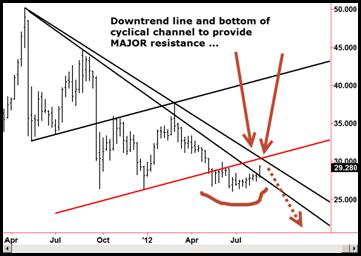
All silver has done is try to rally to test overhead resistance, which remains formidable at the $30-$31 level.
Silver should soon turn back down, and quite violently, with a break of the $26 level still in the cards, and a slide to the low $20 level highly likely.
Fundamentally silver is an industrial metal, not a monetary metal, and should move lower as Europe’s economy continues to contract.
Also consider crude oil: About the only thing holding oil up right now is fear of an Israeli attack on Iran’s nuclear facilities.
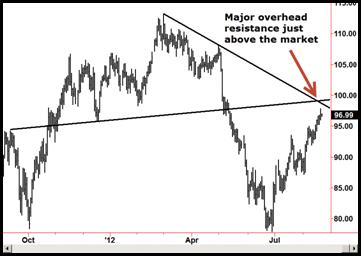
That attack will happen. But I doubt it’s going to take place as soon as most are expecting, in the next few weeks to couple of months, and I doubt it will do much for the price of oil.
Oil is already pressing extreme resistance levels.
It may yet test the $100 mark, but overall, oil’s chart action is bearish and my systems remain bearish on an intermediate-term basis.
As you can see from the chart, oil is now pressing into a major resistance level. I expect it to soon turn back down. And quite sharply.
Now, the Dow Industrials: Long term, the Dow and the S&P 500 stocks are headed MUCH higher.
And the recent strength in the broad U.S. stock markets is showing you its potential.
The simple fact of the matter is that our stock markets — and many of our great companies — are the beneficiaries of capital flight from Europe.
As that crisis worsens, and Washington gets hit with its own sovereign debt crisis, both European and American capital will be attracted to the stock market. Money will flow out of U.S. bonds and into stocks. Regardless of the economy.
Few people understand this, but the U.S. stock markets can become a safe haven for capital. Just like bonds have been, or gold. When that happens, and it will happen, U.S. stock markets will soar.
But we’re not yet fully into that phase. Right now, it’s mostly European-flight capital that’s holding up our markets.
That will continue, but in the short term, there are also forces weighing on U.S. stocks — namely the uncertainty of the looming U.S. fiscal cliff of spending cuts and tax hikes.
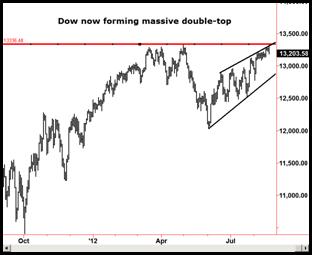
That’s partly why I believe the Dow Industrials — and the S&P 500 Index — are now forming a massive double-top, as you can see on that chart.
Odds still favor a move back to the downside, one that could be very sudden and very sharp.
Additional evidence comes from my system models, which show a move lower heading into September, a move that could find the Dow sliding back to at least the 12,500 level and possibly lower.
Also important: Something very few are talking about. The Dow Transportation Index is not confirming the move higher in the Dow Industrials.
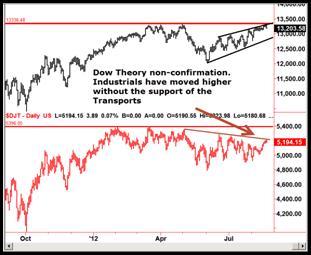
You can see it on this chart, which shows the Dow Transports on the bottom half. While the Dow has moved very close to a double-top. The Dow Transports remain well-below their highs of earlier this summer.
That’s called a Dow Theory non-confirmation, and it is largely bearish.
Reason: If the transportation sector is not confirming the action in the Dow, it’s telling you something, and in this case, it’s likely telling you that the real economy, so to speak, is not supportive of the current Dow Industrials pricing.
My bottom line: Don’t get caught up in the recent rallies. They’re hazardous to your financial health!
Instead, stay the course. I suggest you keep the bulk of your money safe and secure in U.S. Treasury bills or related money-market funds.
Consider keeping your gold holdings hedged. I also recommend you don’t buy more gold yet. Don’t buy silver yet. And if you’re a speculator, speculate on the short side of these markets (except for the dollar).
Until next time …
Best wishes,
Larry

-
I know Mike is a very solid investor and respect his opinions very much. So if he says pay attention to this or that - I will.
~ Dale G.
-
I've started managing my own investments so view Michael's site as a one-stop shop from which to get information and perspectives.
~ Dave E.
-
Michael offers easy reading, honest, common sense information that anyone can use in a practical manner.
~ der_al.
-
A sane voice in a scrambled investment world.
~ Ed R.
Inside Edge Pro Contributors

Greg Weldon

Josef Schachter

Tyler Bollhorn

Ryan Irvine

Paul Beattie

Martin Straith

Patrick Ceresna

Mark Leibovit

James Thorne

Victor Adair