
Stocks & Equities
As a general rule, the most successful man in life is the man who has the best information
Stocks and interest rates are back to late spring – pre latest European fear levels – and the Jefferies/Thomson Reuters CRB index is at a three-month high.
Risk assets are obviously back in favor with investors – possible action by the European Central Bank (ECB) and the US Federal Reserve (Fed) could offer an explanation why:
- There is speculation Fed Chairman Ben Bernanke could signal another round of quantitative easing at the Jackson Hole, Wyo. end of August Fed meeting
- ECB President Mario Draghi promised to defend the euro so markets are expecting a move from Europe’s central bank
The CBOE Market Volatility Index, the VIX or “Fear Index” as it’s known recently hit its lowest level since the global credit crisis erupted five years ago.
Mike Dolan offers us an explanation of what the VIX is and questions why such high levels of investors complacency…
“Given almost biblical gloom about the world economy at the moment, you really have to do a double take looking at Wall Street’s so-called “Fear Index”. The VIX, which is essentially the cost of options on S&P500 equities, acts as a geiger counter for both U.S. and global financial markets.
Measuring implied volatility in the market, the index surges when the demand for options protection against sharp moves in stock prices is high and falls back when investors are sufficiently comfortable with prevailing trends to feel little need to hedge portfolios. In practice — at least over the past 10 years — high volatility typically means sharp market falls and so the ViX goes up when the market is falling and vice versa. And because it’s used in risk models the world over as a proxy for global financial risk, a rising ViX tends to shoo investors away from risky assets while a falling ViX pulls them in — feeding the metronomic risk on/risk off behaviour in world markets and, arguably, exaggerating dangerously pro-cyclical trading and investment strategies.
Well, can that picture of an anxiety-free investment world really be accurate? It’s easy to dismiss it and blame a thousand “technical factors” for its recent precipitous decline. On the other hand, it’s also easy to forget the performance of the underlying market has been remarkable too. Year-to-date gains on Wall St this year have been the second best since 1998. And while the U.S. and world economies hit another rough patch over the second quarter, the incoming U.S. economic data is far from universally poor and many economists see activity stabilising again.
But is all that enough for the lowest level of “fear” since the fateful August of 2007? The answer is likely rooted in another sort of “put” outside the options market — the policy “put”, essentially the implied insurance the Fed has offered investors by saying it will act again to print money and buy bonds in a third round of quantitative easing (QE3) if the economy or financial market conditions deteriorate sharply again.” Mike Dolan, Put Down and Fed Up, blogs.reuters.com
 reuters.com
Risk On
There is no doubt in this author’s mind most people believe the world’s governments and central banks will step in with some form of quantitative easing. Current market conditions are clearly showing this.
In a risk on type of situation, meaning Draghi and Bernanke come through, commodities would seem like a good place to have my money.
Why? Well the long-term average ratio of the Commodities Research Bureau Index versus the S&P 500 is 1.5 times. This ratio indicates how much S&P 500 stock you can buy with a fixed basket of commodities.
The ratio was recently at 0.2 times – an all time low valuation between hard assets and financial assets.
Risk Off
There are many reasons “risk on” could suddenly become “risk off”:
- Continued negative headlines from Europe
- Weaker U.S., Chinese and global growth
- Slowing corporate profits
- Draghi or Bernanke, or both, fail to act
Bonds and gold are “risk off,” Fear Trade investments people buy when they want safety.
Bonds
Unfortunately there’s something most bond investors do not understand – negative REAL interest rates.
“Over time even small levels of inflation can make a big difference in the purchasing power of your investment…If your rate of return isn’t greater than the rate of inflation, then the real value of your investment (the inflation adjusted value) drops and, with it, your spending power. So even though it looks like you have more money, you can actually buy less with it.” inflationdata.com
The benchmark US 10-year note currently yields 1.63 percent, yields on 30 year bonds are 2.75 percent.
The following is the inflation data for the first six months of 2012, the Inflation rate is calculated from the Consumer Price Index (CPI-U) which is compiled by the Bureau of Labor Statistics (BLS).
Jan 2.93%, Feb 2.87%, Mar 2.65%, Apr 2.30%, May 1.70%, June 1.66%
Treasury Inflation Protected Securities (TIPS) adjust your investment value according to changes in the Consumer Price Index (CPI) – the inflation rate – when there is inflation, or a rise in the CPI, the principal increases and, with deflation, the principal decreases.
John Williams, author of the newsletter Shadow Government Statistics, takes issue with the statistical methodology used by the US Bureau of Labor Statistics (BLS).
Williams says if the BLS hadn’t altered its statistical practices over the years, inflation, as measured by the governments CPI, would have been reported about seven percentage points higher each year.
“the Committee expects to maintain a highly accommodative stance for monetary policy. In particular, the Committee decided today to keep the target range for the federal funds rate at 0 to 1/4 percent…at least through late 2014. The Committee also decided to continue through the end of the year its program to extend the average maturity of its holdings of securities…This continuation of the maturity extension program should put downward pressure on longer-term interest rates” U.S. Federal Reserve Reaffirms Low-Rate Policy, June 20th 2012
Gold
The demand for gold moves inversely to interest rates – the higher the rate of interest the lower the demand for gold, the lower the rate of interest the higher the demand for gold.
The reason for this is simple, when real interest rates are low, at, or below zero, cash and bonds fall out of favor because the real return is lower than inflation – if your earning 1.6 percent on your money but inflation is running 2.7 percent the real rate you are earning is negative 1.1 percent – an investor is actually losing purchasing power. Gold is the most proven investment to offer a return greater than inflation (by its rising price) or at least not a loss of purchasing power.
Gold’s price is tied to low/negative real interest rates which are essentially the by-product of inflation – when real rates are low, the price of gold can/will rise, of course when real rates are rising, gold can fall very quickly.
Fact – as long as real interest rates are low gold is in a bull market, there are no plans to raise interest rates for at least two years, indeed the Fed is actively working to lower longer term rates.
Consider:
- Since 1913 the US dollar has lost over 95% of its purchasing power
- Gold has gone from US$20 an ounce to currently over US$1600.00 per ounce in the same time frame
- Continuing low interest rates, combined with higher inflation rates will continue to cause low to negative real rates of return
The “Fear” Trade comprises bonds and gold, if bonds aren’t worth holding because of negative real interest rates that leaves gold as the only true safe haven asset.
Conclusion
Is it risk on, or risk off? Are we looking at a fear trade situation where gold is the only true safe haven asset? Or will the world’s central banks open the monetary floodgates as many suspect is going to happen?
The actions of the world’s central banks should be on everyone’s radar screen. Are they on yours?
If not, maybe they should be.
Richard (Rick) Mills
If you’re interested in learning more about the junior resource and bio-med sectors please come and visit us at www.aheadoftheherd.com
Site membership is free. No credit card or personal information is asked for.
***
WallStreetJournal, SafeHaven, MarketOracle, USAToday, NationalPost, Stockhouse, Lewrockwell, Pinnacledigest, UraniumMiner, Beforeitsnews, SeekingAlpha, MontrealGazette, CaseyResearch, 24hgold, VancouverSun, CBSnews, SilverBearCafe, Infomine, HuffingtonPost, Mineweb, 321Gold, Kitco, Gold-Eagle, The Gold/Energy Reports, CalgaryHerald, ResourceInvestor, Mining.com, Forbes, FNArena, Uraniumseek, FinancialSense, Goldseek, Dallasnews, Vantagewire, Resourceclips and the Association of Mining Analysts.
***
Legal Notice / Disclaimer
This document is not and should not be construed as an offer to sell or the solicitation of an offer to purchase or subscribe for any investment.
Richard Mills has based this document on information obtained from sources he believes to be reliable but which has not been independently verified; Richard Mills makes no guarantee, representation or warranty and accepts no responsibility or liability as to its accuracy or completeness. Expressions of opinion are those of Richard Mills only and are subject to change without notice. Richard Mills assumes no warranty, liability or guarantee for the current relevance, correctness or completeness of any information provided within this Report and will not be held liable for the consequence of reliance upon any opinion or statement contained herein or any omission.
Furthermore, I, Richard Mills, assume no liability for any direct or indirect loss or damage or, in particular, for lost profit, which you may incur as a result of the use and existence of the information provided within this Report.

One Emerging Bright Spot in the Gloomy Energy Sector
The energy sector is expected to see a 12% drop in earnings this quarter. But one segment — offshore drilling companies — is bucking the trend. And that’s where the next investing gusher could be.
For example, last month Noble Corp. (NE), the owner of the world’s third-largest offshore drilling fleet, reported that its year-over-year earnings shot up by 250%. Quarterly profits tripled, costly downtime decreased, and revenue grew with the debut of new rigs in Brazil and the Gulf of Mexico.
Demand for deepwater rigs is so strong that Noble and Diamond Offshore Drilling (DO) are already looking at 2014 deals. Production for 2013 is mostly booked at higher levels.
Diamond announced that Ocean Onyx, a rig under construction in Texas, will start a one-year contract with Apache Corp. (APA) in the third quarter of 2013.
The rate: $490,000 per day!
Demand Is Growing,
Giving Rig Builders Added Leverage
Last week Noble revealed a three-year deal for an ultra-deepwater drillship now under construction, in a contract that will average $618,000 per day starting in 2014 — making it one of the company’s most lucrative rigs.
What’s more, the normally reserved Swiss management forecasts a plethora of such deals in the near future.
And the sector leader, Transocean Ltd. (RIG), plans to sell up to $1 BILLION worth of rigs this year, as all the leading rig operators focus on improving their fleets. Fleet utilization at Transocean was 66% for this year’s second quarter, up from 61% in the first quarter.
Again, the rising pricing impact is not limited to just one company …
Transocean’s Deepwater Deep Seas drillship was hired byMurphy Oil Corp. (MUR) at $595,000 per day starting next March, in another sign of strong deepwater demand when compared with its previous $450,000 rate.
The shortage is driving acquisitions, too …
Ensco (ESV), the second-largest offshore drilling company in the world, announced its second-quarter results a few weeks ago. Benefiting from the acquisition of Pride International, the deal doubled Ensco’s net income from the prior year’s quarter. But there’s also room for further earnings growth by moving some of the newer rigs to higher-rate contracts.
So What’s Going On?
Just five years ago, it was widely believed that U.S. oil and natural gas production would follow a path of steady decline.
Now the Energy Information Administration (EIA) predicts that total U.S. liquids production will climb to 12.1 million barrels per day by 2025 — a 38% increase over the 2005 projection.
Several other countries in the Western Hemisphere, including Brazil and Canada, are also expected to post significant increases in oil output …
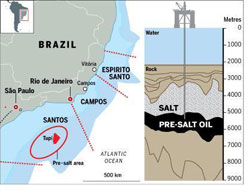
Tapping its recent discovery could prove Brazil’s greatest challenge.
Based on the EIA’s most recent projections, Brazil’s oil output should rise by 2.8 million barrels per day between 2009 and 2035. All the increase will virtually come from the pre-salt fields in the Atlantic, about 200 miles southeast of Rio de Janeiro.
But this is easier said than done as Brazil’s state-controlled oil company, Petrobras (PZE), admits …
These fields are located beneath a mile-and-a-half of ocean and another two miles of sand, rock and shifting salt layers.
Reaching them will require drilling technology even more costly and sophisticated than that used by BP Plc (BP), ExxonMobil (XOM) and other private firms in the Gulf of Mexico. And don’t forget there’s always the risk of a catastrophic blowout like the one that destroyed the Deepwater Horizon.
For Canada, the EIA projects the output from its Athabasca tar sands in the Alberta Province to jump from 1.7 million barrels per day in 2009 to 4.8 million in 2035, an impressive 180% increase.
The bottom line here is that the oil industry is struggling to find enough equipment to meet its surging production demand.
No wonder Atwood Oceanics (ATW) — which owns a small fleet of 10 mobile offshore-drilling units located in the U.S., Gulf of Mexico, South America, the Mediterranean Sea, West Africa, Southeast Asia and Australia — is running at 95% utilization!
That’s why I’m looking forward to Seadrill’s (SDRL) earnings release at the end of this month for more positive news. The Norwegian offshore oil rig operator won a deal potentially worth $4 billion for three of its drillships in the Gulf of Mexico. The deal was one of the biggest in the global rig industry.
My take on this is that offshore drilling companies will continue to be one of the bright spots in an overall gloomy sector, with day rates increasing and rig-utilization numbers growing.
And I plan on watching this segment of the energy market very closely.
Best wishes,
Rudy
Latin American Specialist
Rudy Martin is the former director of research for TheStreet.com Ratings.
In addition to his periodic contributions on this and other financial sites, Rudy writes a monthly newsletter The Latin Capital Market Report and is the editor of Weiss Research’s special report, The Greatest Riches in Latin America.
Earlier he worked 25 years in investment research and management positions with Fidelity Investments, Lincoln National, Dean Witter Reynolds and Transamerica Investments. He began his career as a securities investment analyst at Duff and Phelps where he published equity and fixed income securities investment recommendations. Martin holds a master’s degree in finance from Kellogg Northwestern University.
For more information about Rudy Martin and The Latin Capital Market Report visitwww.latincapitalmarket.com
Rudy appreciates your feedback; click here to send him an email.

Two clips from Mark Leibovit’s 19 Page VR Gold Letter
Bill Haynes, operator of CMI Gold & Silver, “Right now we are seeing very large physical orders for both gold and silver. It is very interesting because these are entities with large existing holdings of both physical gold and silver, but for some reason, right here, right now they are adding sizable quantities to their existing positions. These are wealthy individuals that are very strong hands and they are taking the metal right out of the market, and believe me, these individuals are never sellers. They see gold and silver as a hard asset that has been money for thousands of years, and they are pulling it out of the market and putting it away.” Haynes adds, “It is also very interesting that we are seeing an equal amount of money going into both gold and silver.” Haynes concludes with “This is a financial crisis supreme, and the universal solution continues to be the printing of money. This will eventually lead to massive destruction of both the economies and the currencies that participate in this madness. It will also lead to massive inflation. I know some financial managers have told their clients to have 10% or 15% in gold, but for the financial climate that we are living through right now, I firmly believe people should have 50% to 60% of their assets in the physical metals.”
John Hathaway of the Tocqueville Fund reminds traders in an interview that the purpose of holding a portion of your portfolio in gold is safety, and that physical gold rather than paper gold is the only safe way to own gold.Hathaway told TheGoldReport:“Moreandmorepeople are thinking strategically about gold. Owning physical gold should not be viewed as a way to make money. Rather, it is way of saving capital that creates optionality for future spending power and investment resources. The impetus to get into gold is not because someone like me says the next step is $2,000/oz. The real reason is safety of capital.” He also commented, “By physical, I do not mean an exchange-traded fund (ETF) or commodity contracts, which are really paper gold, but actual physical gold that you can touch-gold that is outside of the banking system, that you know where it is stored and what your bar numbers are.”

IF YOU HAVE NOT SIGNED UP FOR THE LEIBOVIT VR GOLD LETTER, HERE IS YOUR CHANCE. THE AUGUST 16TH EDITION IS HOT OFF THE PRESS. HERE IS THE LINK: WWW.VRGOLDLETTER.COM. YOU GET A 50% DISCOUNT FOR THE FIRST MONTH.
The chart below reveals the month of August has not been kind to Bond investors.
Bond buyers in a death-grip. Investors looking for safety have been piling into US Treasuries, even though it cost them, since they were receiving negative yields. It was one of the biggest bond bubbles in history. But now, it seems that the fun’s over. The yield on the bellwether 10-year note is spurting higher as you can see on the daily chart below. As investors flee the notes and bonds, the yields (which are inverse to the price) head higher. The drop in bonds is going to cost investors billions in losses. – Richard Russell of Dow Theory Letters:
Suddenly a lot of cash suddenly lose and searching for a return. The chart below argues powerfully that investors “fleeing” the Bond Market are going to lose a lot of purchasing power if they just put the money in their pockets.

With the Dow Jones moving up to less than 30 points from a 4 year high, cash is moving into Stocks.
Richard Russell, a Dow Theorist again:
“Finally, a hopeful signal. Yesterday, amid all the low volume and sluggishness, the Transports gave us just a hint of something hopeful. It was a breakout of the declining trendline, as you can see on the chart. The Transports have been the laggers all year, and it seemed as though if the Industrials closed above their May peak, the Transports would not confirm. Now with this little upside breakout, the Transports are giving us a ray of hope. Maybe, just maybe, the Transports will add on a few more point,s and get in the game.
So investors are selling into 32 year Bond Bull Market that hit an extreme, never a bad idea. With that massive amount of cash flowing from a Bond Mkt that is 3 times bigger than the Stock Mkt, how high will that Stock Market go:
Ross Clark of Institutional Advisors:
“Historically the Sell Side Indicator, which is the consensus of opinion of the analysts in New York of what percentage of an investors portfolio should be in equities, has ranged as low as 47% when everybody is quite negative to the high 60’s when everyone is extreme bullish. Remarkably right now the Sell Side Indicator is only 44%! Plotted against the S&P 500, the sell Side indicator phas a phenomenal record of revealing big upside moves in the market in the 20-30% bracket.
In summary, at this moment Stocks not only appear to be a safer investment than Bonds, history say’s they are about to rally 20-30%.
Rob Zurrer for MoneyTalks.net

It’s been tough for natural gas drillers. The boom in horizontal drilling and hydraulic fracturing that gave access to enormous gas-rich shale formations around the nation led to record production. Prices crashed. Drilling activity collapsed: rig count, down 45% from last year, hit the lowest level since July 1999. Producers are writing down their natural gas assets by the billions of dollars. Some will get wiped out. The price of natural gas has been below production costs for years, and the damage is now huge [read…. Natural Gas: Where Endless Money Went to Die].
On the other side, power generators have switched from coal to natural gas—with devastating impact on king coal. Coal has long been the dominant fuel for power generation. But April 2012, for the first time in the history of EIA data, power generation from coal-fired and natural gas-fired plants reached parity, each contributing 32% to total electricity generation.

The large fluctuations are a function, in part, of the seasonality of overall power demand. In April, demand was low due to mild spring weather. The price of natural gas dropped to a 10-year low, and power companies laughed all the way to the bank. In May, power production started to rise as air conditioners got cranked up—a trend that will hold for the summer.
But the graph shows something far more important: a narrowing of the gap between coal and gas-fired power generation. It’s not just the low price of natural gas that did it—but a new power generation technology and yes, the usual suspect, Congress.
Gas turbines are an old technology. Most of the energy is wasted as exhaust heat. They’re inefficient, compared to coal-fired steam turbines. But they have an advantage: they can be brought on line quickly to cover peak loads. So coal and gas have been used in parallel: coal to produce low-cost base power and gas to produce more expensive peak power during periods of high demand (daytime, summer).
Gas didn’t pose a threat to king coal … until the arrival in the 1990s of the natural gas combined-cycle (NGCC) turbine: like the classic turbine, it drives a generator, but instead of blowing the “waste” heat out the exhaust, it uses the energy to generate steam that, as in a coal plant, drives a steam turbine that powers another generator. Like their old-fashioned brethren, NGCC plants can be brought on line quickly, but when used for base power, their efficiency can exceed 60%—much higher than that of a coal plant.
A game changer. With natural gas prices as low as they’ve been over the past years, operating costs for power generators have plunged. It doesn’t hurt that NGCC plants have lower capital costs than coal plants—$600 to $700 per kW versus $1,400 to $2,000 kW—relatively short construction times, and environmental benefits. The long-term shift to natural gas looks like this:

(The data is annual, not monthly; so 2012, with data through April, isn’t comparable to the first graph.)
The gray areas in the graph indicate periods of extraordinary changes. Low oil prices in the 1960s caused and uptick in use of petroleum for power generation … until the two oil shocks in the 1970s knocked it into a long decline towards the inconsequential.
The winner of the oil shocks was coal, producing at its peak in the late 1980s nearly 80% of all power: truly king coal. And it was Congress that did it! In 1978, in reaction to the oil price shocks, it passed the Powerplant and Industrial Fuels Act (PIFUA) that clamped down on the construction of oil and gas-fired plants and promoted the construction of coal plants. But by 1990, a new world had dawned: PIFUA was buried, natural gas markets were deregulated, and power generators were freer to substitute one fuel for another, based on economic considerations.
Just then, the efficient NGCC plants arrived on the scene! Result: a phenomenal ascent of natural gas in power generation, not only for peak power but also for base power, led by a construction boom of NGCC plants. Between 2000 and 2010, natural gas generating capacity jumped by 96%:

The loser was coal. An ugly slide that accelerated over the last few years. Higher natural gas prices—a certainty, given that they’re currently below production costs—will have some impact on the speed of the progression of natural gas. In the short term, power generators switch between fuels to take advantage of lower costs here and there. But as more gas-fired plants have come on line, and as the oldest, most inefficient coal plants are being retired, the shift to natural gas has become structural—pushing up demand inexorably.
Alas, the price of natural gas doesn’t flow like a tranquil river but has violent ups and downs with sporadic and vicious spikes. Read…. The Coming Spike In The Price Of Natural Gas.
And here is a harbinger of other things to come: California Sales Tax Revenues Nosedive By 33.5%, by hard-hitting Chriss Street.

-
I know Mike is a very solid investor and respect his opinions very much. So if he says pay attention to this or that - I will.
~ Dale G.
-
I've started managing my own investments so view Michael's site as a one-stop shop from which to get information and perspectives.
~ Dave E.
-
Michael offers easy reading, honest, common sense information that anyone can use in a practical manner.
~ der_al.
-
A sane voice in a scrambled investment world.
~ Ed R.
Inside Edge Pro Contributors

Greg Weldon

Josef Schachter

Tyler Bollhorn

Ryan Irvine

Paul Beattie

Martin Straith

Patrick Ceresna

Mark Leibovit

James Thorne

Victor Adair