
Bonds & Interest Rates
Ross Clark studies Data, much of it going back centuries, in order to define the tendencies, patterns and cycles that reveal areas of risk and opportunity. For example, Ross told Michael Campbell about the “Sell Side” indicator.
Historically the Sell Side Indicator, which is the consensus of opinion of the analysts in New York of what percentage of an investors portfolio should be in equities, has ranged as low as 47% when everybody is quite negative to the high 60’s when everyone is extreme bullish as they were in 2001/2002 following the Internet Boom.
Remarkably right now the Sell Side Indicator is only 44%! So with the indicator at this unusually low level, Ross plotted the Sell Side indicator against the S&P and clearly found that over the next 6-12 months this combination has a phenomenal record of revealing big upside moves in the market. Not modest moves either, indeed they are typically in the 20-30% bracket. The disaster in Europe and troubles financially in the US has made analysts negative stocks at a time when history indicates powerfully that the market is about to rally.
But the big issue Ross wanted to make very clear is that the Bond Market is at an extreme. Like any market at an extreme, significant change is afoot. Yields are at historic lows, at the tail end of a long term decline in interest rates that began 32 years ago in 1980.
These are unnerving times, people are feeling very uncertain and in these times of risk aversion bonds go up (rates down). And down those rates have certainly gone with the 10 Year US T-Note hitting a tiny 1.4% yield recently. Rates have even gone negative in Germany. How long can this go on, or better yet are interest rates and bond prices not at an extreme?
Ross Clark: “Extremes occur every 3 1/2 – 4 years and this is right in the window where we are now. We have good overbought readings in everything from the sovereign items through to the corporate, the high yields, the emerging bonds, all of the sectors within the bond complex. I believe we are in need of a pretty sizeable correction, or down move in the pricing of bonds and an upmove in interest rates. This situation is the most significant factor in markets today. There has been such a flight to these items, particulariy in the last 6 months or so, and from a technical perspective its overdone and in need of corrections. You have a 10 Year US T-Note that bottomed at 1.4%, currently at 1.65% right now. Typically, looking at 50-60 years worth of data, you would rally those interest rates back the the 55 month moving average which would be a 2.%-2.6% yield on that 10 Year Note. To go from 1.4% to 2.6% is a huge, and that move would have a big impact on the price of bonds.“
Of course a rise in Bond rates will effect anything that is directly interest rate related from mortgages to bank loans.
CIBC Wood Gundy PO Box 49184
Suite 2434 – 1055 Dunsmuir St.
Vancouver BC V7X 1K8
(877) 331-5122 toll free
(604) 661-7700 fax
Email: RossClark [@] shaw.ca

Bubble, Bubble, Toil and Trouble?
A correction in the Canadian housing market is looking ever more likely. In 2001, both Canada and the US lowered interest rates ( cheap money) which helped fuel a housing boom. In 2008 the US experienced a marked reversal in housing prices, bringing them in line to their long term growth rates. In Canada this did not happen.
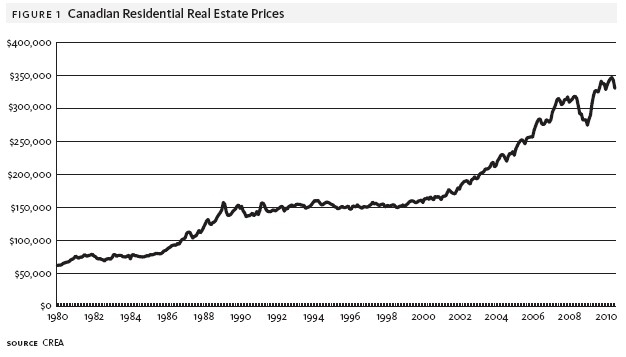
We don’t feel that Canada magically avoided this correction – it just hasn’t happened yet. There are several factors that could contribute to a significant correction in Canada’s housing market.
- Our personal savings rate is decreasing (currently only 2.9%)
- Our consumer debt level is increasing (currently $25,597/person)
- Growth in housing prices continues to vastly outpace growth in rents
- Interest rates are at record lows and are poised to rise
- New mortgage rules have been instituted to slow growth
Historically, housings prices have been a function of the rents they can achieve. If it gets too expensive to buy, people will rent. This will drive housing prices down and bid up prices for rents, creating an equilibrium. In 2001, this relationship started to break down and housing prices rose significantly more than rents. Was this simply a matter of people willing to pay a premium for home ownership? Possibly, but a more likely explanation is that there was a bubble fueled by cheap credit. People justified making offers over asking prices because there was an expectation that housing prices would be higher the next year. More money was available to bid up prices and bidding wars ensued.
In the US housing prices have since moved to a level where we would expect them based on the long term house price to rent ratio. In Canada, this ratio has not experienced a correction and housing prices continue to be significantly higher than rents. This difference is muted with lower interest rates (which lowers carrying costs), but as interest rates rise, it will become more apparent as mortgages come up for renewal.
If you any questions about this report, or to discuss how Euro Pacific can help manage your portfolio, please contact me.
Kind regards,
Dan Simon
Investment Consultant
w. 416.479.8996 | f. 647.776.3284
c. 416.602.7960
tf. 888.216.9779 x403
dan.simon@europac.ca“>dan.simon@europac.ca
Euro Pacific Canada Inc.
130 King Street West | Exchange Tower
Suite 2820 | Box 20
Toronto, ON, M5X 1A9
www.europac.ca
INSTITUTIONAL ADVISORS
WEDNESDAY, AUGUST 15, 2012
BOB HOYE
PUBLISHED BY INSTITUTIONAL ADVISORS
The following is part of Pivotal Events that was
published for our subscribers August 9, 2012.
SIGNS OF THE TIMES:
“Sandy Weill, whose creation of Citigroup ushered in the era of U.S. banking conglomerates a decade before the financial crisis, said it is time to dismantle the nation’s largest lenders.”
This is Bloomberg’s July 25th article, and the Wall Street Journal had the headline: “Sandy Weill Regrets Breaking Glass”.
Weill is quoted “What we should do is go and split up investment banking from banking.”
He was instrumental in the 1998 merger of Citicorp and Travelers Group, which was the deal that required the repeal of Glass-Steagall. And, as the saying goes “The rest was history”, as Citi stock collapsed from 515 in 2007 to 9.70, repeat 9.70, in 2009. The best on the rebound was 51.50 in January 2011.
It is always fascinating to see examples of how the culture of finance changes from the habits of probity learned in the previous depression to “anything goes” in a new financial era. And, eventually, back to probity, for which Weill seems to be an agent.
It should be emphasized that in the early 1930s most in the establishment understood that the depression was caused by the financial collapse inevitable to a bubble. Since the 1950s too many academics believe that the post-1929 crash was due to the policy error of raising the discount rate from 5 percent to 6 percent in early August of that fateful year.
On the certain knowledge that the boom caused the bust, Glass-Steagall split ordinary banking from Wall Street banking. It made sense, as did the formation of the SEC with the mandate to prevent a repeat of the “Roaring Twenties”. Well, with 2007 recording most of the features of a great bubble the SEC failed on its mandate. Also, one of the promoters of the SEC Act boasted that it “would put a cop on the corner of Wall and Broad Streets”.
The Madoff fraud had a number of whistle-blowers and the SEC did not act on the biggest Pozni Scheme in history.
Glass-Steagall was thrown out in 1998 as part of another cultural change to reckless financial speculation. Now one of the key agents of change is exploring remorse and repentance.
Perhaps, the SEC will try to assume the mantle of responsibility and accountability that it was originally charged with.
Attached is a copy of our “Book Report” of September 7, 2007. The Ropespinner Conspiracy is a satire published in 1987 on the corruption of banking by “modern” concepts, otherwise known as borrowing short and lending long.
“The European Central Bank is edging toward a bond-buying program that investors say could end up printing money, echoing efforts by the Federal Reserve and other central banks to fix a credit crisis nearing its sixth year.”
– Bloomberg, August 3
The article did not include that the Bank of Japan has been similarly aggressive since around 1991. Some of this summer’s interns in the BoJ’s research department could have been born after their Great Depression began.
* * * * *
PERSPECTIVE
Fortunately, the “good vibes” have appeared again. Stock market action has been “choppy” and the latest rush has moved the S&P to 1407. This compares to the natural high of 1422 at the end of March and the test of that high at 1415 at the beginning of May. Unfortunately, trading breadth is deteriorating. We are watching for some ending action – seasonally and dynamically.
This has been supported by similar swings in commodities that are beginning to look tired. Other support has been provided by continued narrowing of the Ted Spread. The weekly RSI has traded from very overbought with last fall’s financial pressures to rather oversold this week. The swing is big enough to be significant.
Longer-dated corporate spreads have narrowed significantly since early July.
CREDIT MARKETS
Since the high on July 26 the long bond has set a downtrend to 147.5. While declining with the joy of risk elsewhere, the key thing is that the top has been made.
Since the first of the month, investment grade corps (LQD) have rolled over, and the emerging market bonds (EMB) have declined a little.
The point is that long treasuries have been leading the action as lower-grade issues continued to party. Over the past week, the yield for Baa has increased from 3.54% to 3.63% as junk declined from 11.46% to 11.23%. Such divergences are typically found at important tops for the whole bond market.
And really in the party mode, sub-prime mortgage bonds have soared to new highs for the move. The one we monitor set a low of 38 in October and rallied to 52.6 in February. After slumping to 48 in early June, it rallied to 54 three weeks ago. The set back was to 52.5 and now it is at 56. The latest surge is getting compulsive.
This celebration of risk could expire within a few weeks.
The reversal could lead to serious dislocations in bond sectors that have yet to be hammered by the great global contraction.
CURRENCIES
Today is interesting. The dollar and most commodities have been firm. The stock market has been firm to steady.
On the near term, the DX could rise for a few trading days and that would stall out the rally in orthodox investments.
This could be brief as the good vibes could run for up to a couple of weeks.
Otherwise, the Dollar Index is in a solid uptrend. As troubles appear in the fall the dollar could take out resistance at the 89 level. That was set with high momentum as the financial crash completed in March 2009.
Using a different model, the ChartWorks has had a target of 90.
Link to August 10 ‘Bob and Phil Show’ on TalkDigitalNetwork.com:
http://talkdigitalnetwork.com/2012/08/happy-birthday-credit-crisis/
BOB HOYE, INSTITUTIONAL ADVISORS
E-MAIL bhoye.institutionaladvisors@telus.net“>bhoye.institutionaladvisors@telus.net
WEBSITE: www.institutionaladvisors.com


People put too much store in central bankers and hang on their every word as if they are prophets with a direct line to the divine. It seems that no one does this more than gold investors. In the past gold has shown itself to be super sensitive to monetary policy announcements and investors hope that any indication of further easing would give gold a joy ride.
We have had enough evidence that central bankers are no super heroes able to leap tall buildings at a single bound and save the economy. There are plenty who contend that if the Fed had not stimulated the economy with zero percent interest rates, two rounds of quantitative easing and the so called “operation twist”, the economic fiasco would have been much worse and the recession much deeper, perhaps even a depression. They go even further and say that the Fed has not done enough, and if only it had printed more money, we would be out of the woods by now.
The Austrian economists, on the other hand, counter that there is no free lunch and the tab will be paid later. The short-term pain of a deep recession would have been more salutary to the economy and would have eventually built a more robust sustainable recovery, they say. They argue that the Fed’s actions simply delay, or numb the pain. So far, even with all the quantitative easing, we have not seen much of a recovery as the employment report released on Friday confirms. In the best case scenario the U.S. economy is stagnant. At the worst case scenario it is going down the hill. That the economy is a mess is the one thing that Barack Obama and his Republican challenger, Mitt Romney, agree on.
We believe that interest rates cannot stay low forever. The Fed’s interest rate was bought down from 5.25% in August 2007 to 0.25% in December 2008. When interest rates finally rise, the prophets of doom and gloom will have plenty to rant about.
Just what did QE do for gold? One could argue—plenty. On November 24th, 2008, which is the day that QE1 was announced, the price of gold was $819.50. It rose to $1,113.30 by March 31st 2010, which is when QE1 ended. This was a hefty increase of $293.80. The price of gold rose from $1,337.60 on November 3rd 2010, the day QE2 was announced, to $1,502.50 on June 30th 2011, which is when QE2 ended. This was a sizeable increase of $164.90, but smaller than in the first round. Does the smaller increase in the second round suggest that investors are becoming less sensitive to such measures by the Fed? Has gold lost its “safe haven” status and become a “risk on” asset?
Without any clear signs of the next round of QE, we will search the stock market for clues regarding gold and silver. We will start with the S&P 500 Index long-term chart (charts courtesy by http://stockcharts.com.)
In the chart, we see that stocks have rallied recently and approached but not yet moved above the level of the previous 2012 high. It seems that once the S&P moves above the $1,425 level and verifies this move, the picture will be bullish here once again. For now, we continue to view the outlook as mixed with a resistance line around 1.5% above Thursday’s closing price level and RSI levels neither overbought nor oversold at this time.
Let us now move on to the financial sector.
In the Broker Dealer Index chart (a proxy for the financial sector), we saw a bit of a rally for the financials last week, but their underperformance over the past five months remains clearly evident. The small rally seen last week does little to atone for the declines seen in two-thirds of the weeks since the mid to late-March high. In short, there is really no good signal for the stock indices in general here.
To better see what possible effects could higher stock prices have on the precious metals market, should a rally in the S&P 500 emerge, let’s take a look at our own tool intended for measuring intermarket correlations.
The Correlation Matrix is a tool which we have developed to analyze the impact of the currency markets and the general stock market upon the precious metals sector.
Both gold and silver are positively correlated with the S&P 500 Index in the short and early medium term. Hence the possible rally in the stock market could help these two metals reach higher prices in this time horizon.
Yet one cannot forget that the currency markets are strongly and negatively correlated with precious metals at this time. If the medium-term rally in the USD Index continues, the downward pressure on precious metals prices will remain in place as well. Note that the metals’ reaction may be delayed by a day or a few of them in response to strong moves in the USD Index, because the nature of the relationship is medium-term, not a short-term one.
Summing up, the overall picture for stocks is best described as mixed or unclear at this time. A short-term rally has been seen recently but an important resistance line is in place and the strength of the rally will be determined when this previous 2012 high price level is tested. It simply seems best to wait and see before commenting further here. Should such a rally in the stock market emerge, gold and silver could benefit from it in the short and medium term, as suggested by the Correlation Matrix. For now, this bullish factor is not in place. One should still bear in mind that such a scenario would be thwarted by a strong rally in the USD, as the correlation between these two metals and the dollar is still strong.
Thank you for reading. Have a great and profitable week!
P. Radomski
Editor
To make sure that you are notified once the new features are implemented, and get immediate access to my free thoughts on the market, including information not available publicly, we urge you to sign up for our free e-mail list. Gold & Silver Investors should definitely join us today and additionally get free, 7-day access to the Premium Sections on our website, including valuable tools and unique charts. It’s free and you may unsubscribe at any time.
Cycle targets that we provide are TURNING POINTS. This means an event normally takes place at that time be it a high or low. If ideally something should produce a low but does not and produces a high, it is typically extending the cycle to the next TURNING POINT. It looks at this time that the next important turning point is the week at the start of Sept. There is of course the Fed meeting. But then there is trouble among debt ridden nations and then there is Iran.
Keep in mind that for some strange reason, geopolitical evens tend to also happen in the Aug/Sept time frame. Besides war, there was even 911. On 28 June 1914,Archduke Franz Ferdinand of Austria was assassinated. World War I began officially 28 July 1914 and lasted until 11 November 1918. It was August when things really got underway. World War II began when Germany attacked Poland on September 1, 1939. Most stock market crash events take place after highs in early Sept such as 9/3/1929. Even the 1987 Crash 10/19/1987.What it is about this time of the year who knows. Where December is the time to be jolly, Sept is the time for chaos. Never look for a particular event high/low. It is a TURNING POINT that sometimes can invert and produce the opposite largely because everything is connected. It is always a action/reaction.

The Rising Social War
In Rome, there was the Social War (91–88 BC) where citizens of Italy paid taxes but did not have the same respect and rights as those in Rome. We are likewise headed straight into a class-warfare struggle because government blames the rich for not paying their “fair share” when it is government that spends without comprehending what the hell they are doing. In Rome, this taxation without equal rights eventually erupted into the Social War just as the American Revolution took place as England sought to extract wealth unjustly.
In Italy today, the Prime Minister Mario Monti’s government has implemented a 20 billion euros ($25 billion) policy in austerity measures that is now causing the Italian economy to implode. The country is struggling with 1.9 trillion euros of debt and as everyone else in the West, there is no plan to pay it back and all governments are turning inward against their people threatening the very foundation of democracy itself. This is now all about government surviving and they see this as extracting funds from the people to pay the interest only to the bond-holders who demand austerity and higher taxes as their pound of flesh.
Prime Minister Mario Monti’s government is now implementing this 20 billion euros attempt to strip people of their wealth in austerity measures that are destroying the economy precisely as took place under Maximinus. We must understand that attacking the “rich” who are the class that create the economy by creating jobs (small businesses employ 70% of the civil work force), they cause capital to hoard and the money supply to actually contract simultaneously with higher unemployment as hiring takes a wait and see approach.
This trend of a collapsing velocity in money was self-evident also during the Great Depression when over 400 American cities were forced to print their own money – Depression Scrip. We are headed into a deep and dark vortex from which there is no escape. Government MUST revise the entire monetary system and restructure the debt. Italian demand for supercars is collapsing. According to Bloomberg News, the number of secondhand high- performance Italian cars that have been exported from Italy has exploded nearly tripling to 13,633 vehicles in the first five months of 2012, from 4,923 a year earlier, according to auto industry group Unrae as reported by Bloomberg. We are in such a serious position, it is NOT hyperinflation we have to worry about, it is the collapse of everything because government is too damn corrupt and refuses to even look at what they hell they are doing upon the advice of bankers. We cannot learn from experience, because we are ignorant of the past – history is the real catalog of solutions if we dare to look.
by Martin Armstrong of Armstrong Economics


-
I know Mike is a very solid investor and respect his opinions very much. So if he says pay attention to this or that - I will.
~ Dale G.
-
I've started managing my own investments so view Michael's site as a one-stop shop from which to get information and perspectives.
~ Dave E.
-
Michael offers easy reading, honest, common sense information that anyone can use in a practical manner.
~ der_al.
-
A sane voice in a scrambled investment world.
~ Ed R.
Inside Edge Pro Contributors

Greg Weldon

Josef Schachter

Tyler Bollhorn

Ryan Irvine

Paul Beattie

Martin Straith

Patrick Ceresna

Mark Leibovit

James Thorne

Victor Adair