
Bonds & Interest Rates
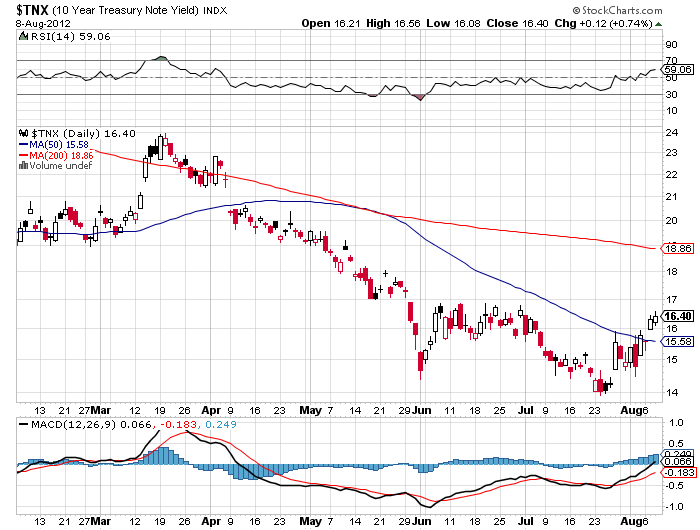
Once again, here’s the yield on the bellwether ten year T-note. And darned if it didn’t gap up yesterday — it gapped clear out and above its 50-day MA. Is the market telling us that the bond boom is over? Has the bond bubble burst, and are interest rates heading UP? Quick, refinance your mortgage.
Wait, don’t laugh away this little gap up in the ten-year T-note. Up until recently, US Treasury debt has represented the world’s ultra-safest haven, the safest place on the planet to store your money. So could this little rally in the yield of the 10-year T-note mean that the world no longer believes US Treasuries are the number one safest place to store money?
Remember, last year S&P lowered the US’s credit rating from AAA to AA+, the first time in history that the rating on the sovereign debt of the US has been lowered. Now, we’re moving ever-closer to the “fiscal cliff” — when taxes will be raised and spending will be cut, thereby almost guaranteeing a severe recession. Will the politicians in Washington let it happen? Well, stranger things have occurred.
On June 8th, S&P issued its latest warning. There’s a one in three chance the S&P will cut the US’s rating again by 2014. Let me put it this way — S&P does not like the way things are shaping up. Time is growing short. And the yield on the 10-year T-note is rising. And that’s not just talk, it’s the market issuing an early warning.
Letters are published and mailed every three weeks. We offer a TRIAL (two consecutive up-to-date issues) for $1.00 (same price that was originally charged in 1958). Trials, please one time only. Mail your $1.00 check to: Dow Theory Letters, PO Box 1759, La Jolla, CA 92038 (annual cost of a subscription is $300, tax deductible if ordered through your business).
IMPORTANT: As an added plus for subscribers, the latest Primary Trend Index (PTI) figure for the day will be posted on our web site — posting will take place a few hours after the close of the market. Also included will be Russell’s comments and observations on the day’s action along with critical market data. Each subscriber will be issued a private user name and password for entrance to the members area of the website.
Investors Intelligence is the organization that monitors almost ALL market letters and then releases their widely-followed “percentage of bullish or bearish advisory services.” This is what Investors Intelligence says about Richard Russell’s Dow Theory Letters: “Richard Russell is by far the most interesting writer of all the services we get.” Feb. 19, 1999.
Below are two of the most widely read articles published by Dow Theory Letters over the past 40 years. Request for these pieces have been received from dozens of organizations. Click on the titles to read the articles.

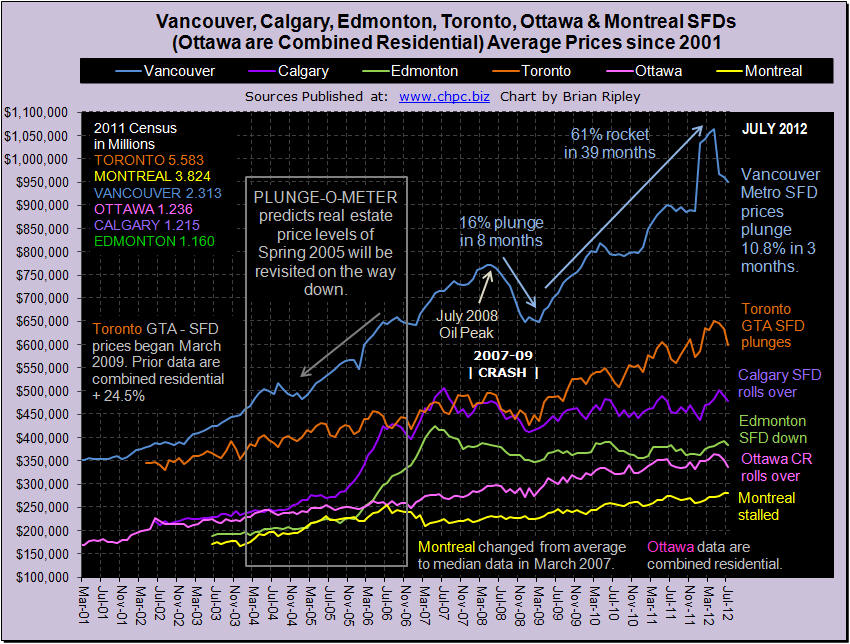
The chart above shows the average detached housing prices for Vancouver, Calgary, Edmonton, Toronto, Ottawa* and Montréal* (*Ottawa are combined residential; Montreal are median not average). In July 2012 urban flippers headed to the exits and buyers retreated to the sidelines as huge sales resistance across Canada (Scorecard) continued to grow with double digit drops like Toronto SFD sales down 23.6% M/M and Vancouver SFD sales down 28.5% Y/Y. Pricing power has been hit in the hot markets of Vancouver and Toronto (Plunge-O-Meter) with SFDs losing 10.8% equity in Vancouver and 7.7% SFD equity loss in Toronto in just the last 3 months. Despite low rates and negative yields, the risk of equity loss is changing buyer sentiment. In my neighborhood walk about through open houses, the pitch is the same… “Price Reduced”.
1. To view the big picture for gold, look at the chart below (click HERE for Larger Image) . Gold has been consolidating for almost a year.
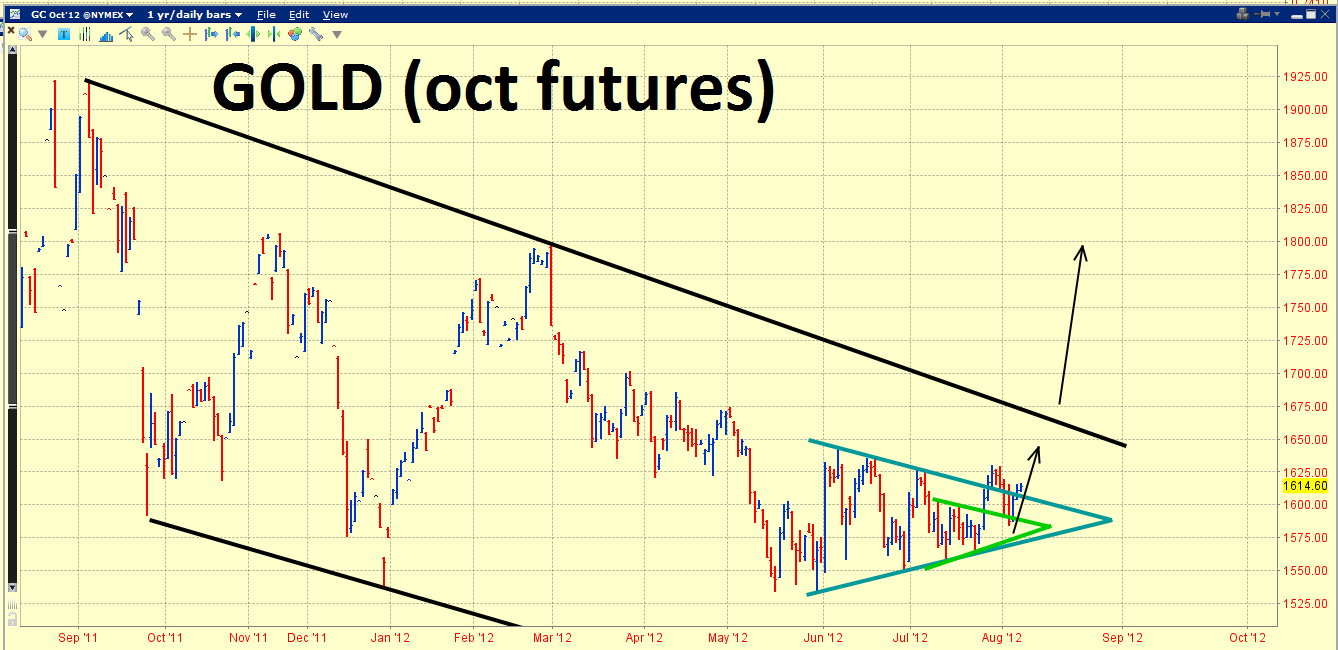
2. Two key symmetrical triangles have formed, and they appear to be acting as the “firing pins” that will help gold begin a major price advance.
3. Please click here now. You can see that gold pulled back towards the middle of the green triangle, and then quickly bounced higher.
4. As of this morning, gold is also trading above the larger dark blue triangle, which technically confirms a breakout. That breakout should produce serious follow-through to yesterday’s price action, for the rest of the trading week.
5. Please click here now. Is that a chart, or a piece of sculpture created by Michelangelo? I would argue that the GDXJ chart qualifies as “chart of the year”.
6. Many individual junior gold stocks are coming to life, and this GDXJ chart suggests a virtual price geyser is imminent. Note the small but beautiful head & shoulders bottom. It is a complex pattern, featuring two heads.
7. The neckline of that pattern sits at about $20.30, denoted by the thin black line of HSR (horizontal support & resistance).
8. GDXJ had a great day of trading yesterday, but Canadian markets were closed. Many hedge funds engage in what may be called “nefarious” shorting of junior resource companies on the CDNX exchange.
9. When Canadian markets open today, I want to see GDXJ blast up through the neckline and over the green downtrend line.
10. The two green trend lines denote an enormous bullish wedge pattern. The GDXJ chart could be termed a “snorting bull”. The chart showcases a double bottom pattern, a head & shoulders bottom, and a bullish wedge.
11. I don’t think that junior gold stock investors could ask for a more bullish chart than this one.
12. The amount of pain endured by the average gold stock investor in this crisis rivals that endured by 1990s technology stock investors. The difference is that you are likely about to be rewarded in a very big way!
13. Silver fans should click here now. Note the bullish pullback to the apex of a triangle pattern. It’s technically bearish if the price “hangs around” the apex, and bullish if it can quickly move higher.
14. In this case, price has moved higher, opening the door for a run towards $28.50. Silver is trading less aggressively than gold is now, which is what I want to see at the beginning of a major bull phase for precious metals.
15. August 7th is my “official start date” to the Dow crash season, and it runs to October 31. The Dow rarely crashes, but I still like to be out of the market during crash season.
16. Platinum is a metal that is much more volatile than gold and tends to crash badly when the Dow crashes. In 2008, platinum fell over 60%, while gold only fell by about 30%.
17. Is platinum hinting that the global economy, and perhaps the Dow, are about to take a hit? Please click here now.
18. While the gold and silver charts look superb, there is a nasty head & shoulders top pattern in place on the weekly platinum chart.
19. It is sitting on strong price support on the longer term charts. Please click here now. You can see that $1340 and $938 are two key areas of enormous price support.
20. I would be a modest buyer of platinum in the current $1400 area, and a much more substantial buyer in the $900-$1000 area.
21. Please click here now. GDX performed like a champion yesterday, and I expect more of the same action all week long.
22. Note the HSR line defined by the circled low at $43.98. GDX is chewing at that resistance like a pitbull chews on balsa wood.
23. If GDX can get over $44, I think it will quickly surge towards the HSR created by the circled high of $48.72, and the circled low of $49.22.
24. The 2011 gold stocks debacle was arguably as bad as the wipeout of the early 1980s or the lows of 1999, but the gold community, and the stocks it invests in, possess a resiliency that never existed in the technology sector. Welcome to the golden age of the gold community. It starts now!
Special Offer For Website Readers: Send me an Email to freereports4@gracelandupdates.com and I’ll send you my free CPI report! Learn what cost push inflation is and how QE helped to create it. I’ll explain why CPI is the most powerful driver of the gold market now, and which stocks could benefit from it!
Thanks!
Cheers
St
Written between 4am-7am. 5-6 issues per week. Emailed at aprox 9am daily.
U.S. Stock Market – While no roaring bull on general equities, I’ve continue to suggest that betting against a market rise would be a poor choice. Despite all the predictions of meltdowns and such, the market continues to discount very legitimate poor fundamentals and technicals. I continue to suggest it would come as no surprise that it makes a minor new, all-time high this year. The only potential “game-changer” to that is my long-standing belief that a major military conflict in the Middle East is a question of when, not if.
U.S. Bonds – I had felt an opening short position to the 10-year T-Bond when the yield hit 1.44% was a way to play the upcoming worse investment for the next ten years and to become aggressively short if the yield fell to 1.25% or below. Those thoughts remain.
U.S Dollar – The suggestion that the 83-84 area on the U.S. Dollar Index could prove to be the top in what was little more than a dead-cat-bounce in the U.S. Dollar, appears to have been good eyesight as of now. I continue to believe what we have witnessed in Europe is a mere opening act to what shall unfold in the U.S. (starting by this time next year).
Gold – Despite the bear boat being loaded to the gills and the bull camp nearly deserted, yours truly has stood tall in his belief the “mother” of all gold bull markets remains intact. I was comforted last week when I read the world’s worse gold forecaster and the #1 buffoon in the gold perma-bear camp, poorly attempt (as he does daily in his dribble commentaries) to mock my “mother” view and twist other people’s comments to suit his daily bashing of gold (the latest being Lawrence Raulston’s gold and junior resource shares comments). There are numerous fundamental and technical reasons to be bullish on gold but none more important than the most wrong gold forecaster in the last decade continues to publish daily reasons why gold’s 500% rise is in his eyes just a mirage (just like the mirage that anyone who has listened to him isn’t broke by now). Remember, there will be another fundraising effort for the Tokyo Rose of gold bears when gold breaks above $2,000.
Oil and Natural Gas – Nothing has changed; like oil and avoid natural gas.
Special Note – Our new website is up! http://www.trinityfsem.com/
I invite you to visit our “speakers” page to see the many professional athletes we can introduce to you for future appearances and events you may have where their presence can be the difference between success and disappointment. Remember, we never charge any type of fee to you or the professional athlete for this introduction http://www.trinityfsem.com/speakers.html
I of course, welcome any opportunity to provide you with insurance and estate planning services and my thoughts on economic, social, political and spiritual matters can be found at my other business site www.grandich.com
We welcome any comments (good or bad) on our new website.


This simple move requires no extra effort… in fact, it happens automatically when you invest in these companies.
I’ve told you before about the enormous number of high-yielding stocks abroad. If you remember, my research team and I found only 17 profitable U.S. companies were paying yields of more than 12%… compared to 227 overseas.
Although the numbers fluctuate daily, that means roughly 92% of the world’s highest yields are found outside of U.S. markets. To me the amount of high-yield international dividend-payers out there is one of the market’s biggest secrets.
But there’s another big potential benefit to investing in international companies that most investors fail to consider.
This simple move could make investors extra gains of 10% or more — even in a single year. It doesn’t require any extra effort… in fact, it happens automatically when you invest in international companies.
Here’s how it works…
Say six years ago you took the trip of a lifetime to Australia. Back then, $1 U.S. bought you roughly $1.30 Australian. That means a hotel room priced at $100 Australian dollars only cost about $77 U.S. dollars, thanks to a favorable exchange rate.
But today, even though the U.S. dollar has seen some gains of late, in relative terms it has plummeted against most currencies — including the Australian dollar. It now trades at a 5% discount to the Aussie dollar. So that $100 room in Aussie dollars will now cost you $105 U.S. dollars — a36% increase, even though the hotel’s rate didn’t change.
What does this have to do with increasing dividends? Well, what’s bad news for your vacation is great news for your international income investments.
Say you bought an Australian company five years ago that paid a dividend of 10 Australian dollars each year. Back then, you would have earned $7.70 in U.S. dollars after conversion.
But today, that same 10 Aussie dollar dividend would be worth $10.05 in the U.S… or 31% more.
The bottom line is if the U.S. dollar weakens versus other major foreign currencies, then your dividends will increase over time… even if the company you invest in keeps its dividend payment the same.
The best news is that despite a recent rally, I see the downtrend in the dollar continuing over the long-term. That will help investors looking abroad.
And I’m not the only one who thinks this:
|
“The dollar is enjoying a safe-haven status, but long run I’m not a fan of the U.S. dollar. Our country has too many problems.” “The dollar rally is overdone.” “While I am now short-term bullish on the dollar, there is still dollar weakness in the long-term.” |
But it’s not just dividends that benefit from a falling dollar when you invest abroad. Every dollar you invest sees the effects as well.
Recognizing this trend years ago — and investing alongside it — has already given international income investors a major boost.
You can see for yourself how the falling dollar has helped score some great returns in international markets…
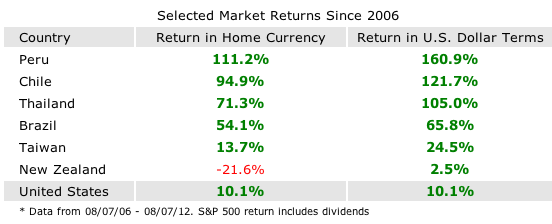
This table makes it easy to see how a falling dollar actually helps… if you’re invested abroad.
Notice that the New Zealand market actually declined over the past five years when measured in New Zealand dollars, but it’s showing a gain for U.S. investors when you factor in the falling U.S. dollar.
Now keep in mind, if the dollar were to rally, the opposite would happen. Your returns and dividends would lessen by the amount the dollar strengthens. And while the dollar has rallied recently — for a variety of reasons I won’t bore you with today — I think the U.S. dollar will continue to lose value in the coming years.
That gives income investors plenty of time to take advantage of this unique opportunity.
And in my opinion, there’s no easier way right now to boost your profits. Especially since you can own many of the world’s highest yielders without even leaving the U.S. markets.
For more on international dividend-payers, I invite you to watch my latest presentation. I’ve included names and ticker symbols of the 17 American companies that yield more than 12% (some as high as 19.7%) and several high-yield international plays. Visit this link to watch now.
Good Investing!

Paul Tracy
StreetAuthority Co-founder, Chief Investment Strategist — Top Ten Stocks, High-Yield International
P.S. — Don’t miss a single issue! Add our address, Research@DividendOpportunities.com, to your Address Book or Safe List. For instructions, go here.
Disclosure: In accordance with company policies, StreetAuthority always provides readers with at least 48 hours advance notice before buying or selling any securities in any “real money” model portfolio. Members of our staff are restricted from buying or selling any securities for two weeks after being featured in our advisories or on our website, as monitored by our compliance officer.


-
I know Mike is a very solid investor and respect his opinions very much. So if he says pay attention to this or that - I will.
~ Dale G.
-
I've started managing my own investments so view Michael's site as a one-stop shop from which to get information and perspectives.
~ Dave E.
-
Michael offers easy reading, honest, common sense information that anyone can use in a practical manner.
~ der_al.
-
A sane voice in a scrambled investment world.
~ Ed R.
Inside Edge Pro Contributors

Greg Weldon

Josef Schachter

Tyler Bollhorn

Ryan Irvine

Paul Beattie

Martin Straith

Patrick Ceresna

Mark Leibovit

James Thorne

Victor Adair