
Bonds & Interest Rates
“Without question, if the Fed had not stimulated the economy with zero percent interest rates, two rounds of quantitative easing and operation twist, the initial economic contraction would have been sharper. But such short-term pain would have been constructive”.
The past week provided clear lessons not just in how central bankers have a limited ability to positively influence the economy but also how they are limited in their capacity to deliver the shortsighted policy actions that investors currently crave. The developments should provide new reasons for investors and economy watchers to abandon their faith in central bankers as super heroes capable of saving the economy.
The employment report released on Friday confirmed that the U.S. economy is stagnating at best and actively deteriorating at worst. While the numbers of jobs created in July was actually better than many economists expected, it was still far below the levels that would indicate a growing economy. But more important than the official unemployment rate (which ticked up to 8.3%) or the number of jobs created, is the number of people who have left the workforce out of frustration or despair. This number continues to head higher. The labor force participation rate, which is the percentage of healthy working age Americans who actually have jobs, is at one of the lowest points since women first started working en masse in the 1970’s. It’s also instructive to add back into the unemployment rate those who want full time jobs but who have had to settle for part time work. This figure, reported under the “U6” category, currently stands at 15.0%. This is just a 12% decline from the 17.1% high seen December 2009. In contrast the “official” (U3) unemployment figure has declined 17% from its peak.
In explaining these bad results, most economists simply look at the stimulating effects of monetary and fiscal policy,not at the problems that those measures create. As a result, it is assumed that not enough stimulation, in the form of quantitative easing or federal deficit spending has been applied to the economy. The next logical assumption is that if the measures of the past few years had not been applied, we would have seen much weaker results over that time. In other words, no matter how bad things are now, defenders of the status quo will always describe how bad things “could have been” if the Fed hadn’t stepped in. This counterfactual argument gets increasingly threadbare as the years wear on.
Rather than admit that its policies have failed, the Fed statement last week gave all indications that it will continue with its current inflationary policy to the bitter end. These are the same errors that inflated the stock and real estate bubbles and ultimately resulted in the 2008 financial crisis and our continuing economic malaise. Without any fresh ideas,Fed press releases have become a Groundhog Day repetition of the same pronouncements and diagnoses. Oddly, many market watchers are frustrated that the Fed has not telegraphed that more stimulus is forthcoming. While it should be obvious that our current “recovery” is dependent on monetary support, it should be equally plain that the Fed can’t actually admit that fragility without spooking markets. To be clear, QE III is coming, but the markets should not expect Bernanke to supply a precise timetable.
Without question, if the Fed had not stimulated the economy with zero percent interest rates, two rounds of quantitative easing and operation twist, the initial economic contraction would have been sharper. But such short-term pain would have been constructive. By not taking away the cheap-money punch bowl, the Fed has delayed the pain and prolonged the party. But to what end? So far all we have received is a tepid phony recovery that has sown the seeds of its own destruction.
In contrast, real economic restructuring would have resulted if the Fed had withdrawn its monetary props. This would have paved the way for a robust, sustainable recovery. Instead, the Fed helped numb the pain with unprecedented (and apparently permanent) liquidity injections. Its actions merely exacerbate the underlying imbalances that lie at the root of our structural problems, and thus act as a barrier to a real recovery. So long as the Fed fails to learn from its prior mistakes, the phony recovery it has concocted will continue to fade until we find ourselves in an even deeper recession thanthe one we experienced in 2008.
Those who believe that artificially low interest rates are needed now,fail to see the price that will be paid down the road. By keeping rates too low, the Fed continues to lead an overly indebted economy deeper into the financial abyss. However, its ability to maintain rates at such low levels is not without limits. Just as real estate prices could not stay high forever, interest rates cannot stay low forever. When rates finally rise, the extent of the economic damage will finally be revealed.
The sad fact is that no matter how impotent and dishonest Fed officials become, their elected rivals on Capitol Hill (who control the fiscal side of the equation) have become even less significant. The complete lack of any political conviction to take steps to confront our fiscal imbalances means that Ben Bernanke and his cohorts are seen as the only cavalry capable of riding to the rescue. But no matter how often they blow their bugles,our economy will continue to deteriorate until we stop waiting for a savior and instead fight the battle for prosperity ourselves.
Peter Schiff’s new book, The Real Crash: America’s Coming Bankruptcy – How to Save Yourself and Your Country is now available. Order your copy today.
For in-depth analysis of this and other investment topics, subscribe to Peter Schiff’s Global Investor newsletter. CLICK HERE for your free subscription.


Last week: my blog comments noted that, “This market wants to go higher“…this week: the major US and European stock indices all closed at new 3 month highs despite the mid-week sell-off on the lack of new programs from the Fed and the ECB. The US$ Index closed at a one month low…the AUD went to a 4 month high, while the CAD touched par for the first time in 3 months…US and CAD government bond yields rose.
Last week I noted:
1) We had Key Weekly Reversals higher in Euro, Swiss, CAD, AUD, DJI, S+P, TSE, Gold (in USD terms) US treasury yields from 2 through 30 year maturities, and a Key Weekly Reversal lower in the US Dollar Index.
2) Despite the manic-depressive mood swings, despite the torrent of capital rushing into perceived safe haven bonds, despite the seemingly intractable European debt crisis, despite the sluggish US and global economy… it seems that THE STOCK MARKET WANTS TO GO HIGHER…the DJI has rallied over 1000 points from the June 4 lows…over 2,700 points from the October 4 lows.
3) Why? It seems as though we are mainly trading off macro political or central bank inspired headlines…or rumors…its seems as though the markets expect central banks will take further reflationary action…will print more money…which will inspire risk on…and higher asset prices.
4) The technical view: Technicians make the point that you can never know all you need to know to make the best market decisions…but if you look at the market you can see what it’s doing…so freeyourself of your opinions about what the market should be doing…and look at what it is doing…the US stock market rallied right through this month’s previous highs and closed at its best levels in nearly three months…this market is a classic case of climbing a wall of worry.
5) There has been a huge amount of cash sitting on the sidelines for the past few years due to economic and political uncertainty and that money could come into this market…taking it much higher…yes, the economic and political uncertainty that has kept that cash on the sidelines still exists…yes, those problems may only be intensifying…and yes, it’s entirely possible that the stock market may reverse tomorrow and drop a few thousand points before Christmas…but…since March, 2009, the US stock market has been trending higher and, as skeptical as I am and as skeptical as I have been, I have to say it looks like this market wants to go higher.
Trading:
For my short term trading accounts I’m long the
Market Psychology:
The dramatic crashes in the stock market, the commodity market, and the housing market over the last five years caused a real crash in investor confidence…in investor’s willingness to take on risk…we see that demonstrated by the high levels of corporate cash as companies are collectively cautious….with good reason, perhaps, but cautious none-the-less. Certainly investors are more likely to see the glass half-empty now than they were during the times of irrational exuberance. So despite the stock market rallies we can see in the charts below the tone remains fretful…fearful…as though worried that all the gains could be gone in a heartbeat…a classic example of a market climbing a wall of worry.
Charts Section:
The US stock market turned higher on (Key Turn Date) June 4 and has chopped higher ever since…now at its best levels in 3 months

The US stock market has been grinding higher for over 3 years…note the very rare and very powerful Monthly Key Reversal Higher in October 2011 (the DJI is up 2700 points from the Oct 4 Key Turn Date.)

The AUD (the high-beta risk-on/risk-off currency) has rallied over 10% since the June 4 Key Turn Date…

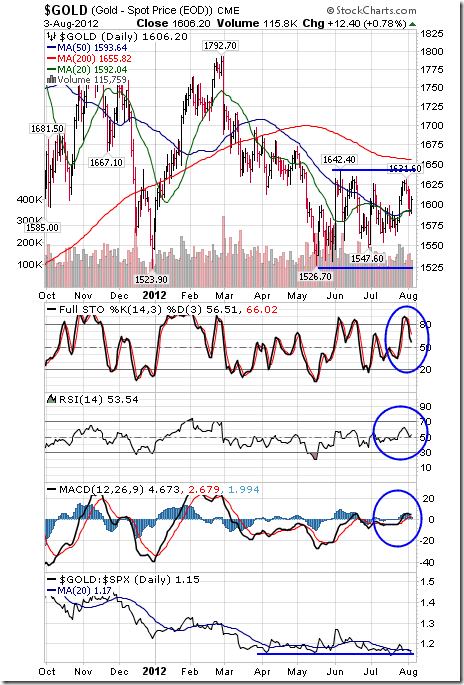
Gold made its All Time High above $1900 last August and has found a floor around $1525-30 several times since then. It popped above its s/t downtrend the past two weeks on USD weakness…a rally above $1630 could set up a test of $1700+ while a breakdown below $1550 would set up a test, and likely a break, of the $1525-30 floor.

Victor Adair
Senior Vice President and Derivatives Portfolio Manager
Contact Victor E-mail @ vadair@union-securities.com” data-mce-href=”mailto:vadair@union-securities.com“>vadair@union-securities.com
Victor Adair is a Senior Vice President and Derivatives Portfolio Manager at Union Securities Ltd. Victor began trading financial markets over 40 years ago and has held a number of senior positions during his long career as a commodity and stockbroker. He provides daily market commentary on CKNW AM 980 radio Vancouver and is nationally syndicated on Mike Campbell’s weekly Moneytalks radio show.
Victor’s trading focus is primarily on the currency, precious metal, interest rate and stock index markets and his clients are high net worth individuals and corporations.


Bill Bonner
Since founding Agora Inc. in 1979, Bill Bonner has found success and garnered camaraderie in numerous communities and industries. A man of many talents, his entrepreneurial savvy, unique writings, philanthropic undertakings, and preservationist activities have all been recognized and awarded by some of America’s most respected authorities. Along with Addison Wiggin, his friend and colleague, Bill has written two New York Times best-selling books, Financial Reckoning Day and Empire of Debt. Both works have been critically acclaimed internationally. With political journalist Lila Rajiva, he wrote his third New York Times best-selling book, Mobs, Messiahs and Markets, which offers concrete advice on how to avoid the public spectacle of modern finance. Since 1999, Bill has been a daily contributor and the driving force behind The Daily Reckoning. Dice Have No Memory: Big Bets & Bad Economics from Paris to the Pampas, the newest book from Bill Bonner, is the definitive compendium of Bill’s daily reckonings from more than a decade: 1999-2010.
Special Report: How Will Your Life Change If The U.S. Gov’t Can’t Borrow Another Dollar? Complete political and social unrest could be just the beginning. You owe it to your family’s safety and security to watch this urgent video report right now. There might not be much time for you to act… Don’t wait, watch now.
Read more: Uncharted Territory: An Interview with Bill Bonner http://dailyreckoning.com/uncharted-territory-an-interview-with-bill-bonner/#ixzz22lSLq4rV

We have always regarded the markets as a grand casino subject to the manipulations of the Croupier and the House. This being said it is only rational to react in the face of the irrational. I remember speaking to a floor specialist who informed me that he reads the same price charts that most technicians do. This means we should be careful of any traps or head-feints at this critical juncture.
No doubt the patterns tell us that we are testing support levels and that technical damage has been inflicted on most stocks including the precious metals. The weak hands inform that the golden bubble may have been broken and the warning inscription written on the entrance to hell “abandon all hope, yea who enter here” may be applicable. We do not agree and may be considering this recent downward move in response to Bernanke and Draghi a fake out and that we may witness a reversal sooner rather than later.
Observe that in the midst of the carnage some positive notes are beginning to appear. We feel that this is a classical panic with all of the textbook characteristics of a selling capitulation. Bullish reversals may soon occur at oversold conditions and is providing long term gold and silver investors additional secondary buypoints.
Be not dismayed! The long range upward trajectory of the precious metals particularly gold is continuing higher and has considerably more to go. Factoring in inflation, gold and silver have yet to challenge inflation adjusted all time highs. Most industrial countries are trying to stimulate growth through accommodative easing and through record negative interest rates. Investors in five countries in Europe now face negative real rates. This means they are losing money with their savings in the bank. Many investors are holding the U.S. dollar which has one of the worst real interest rates. Do not forget behind the scenes M2 money supply has reached record levels. This historically leads to hyperinflation.
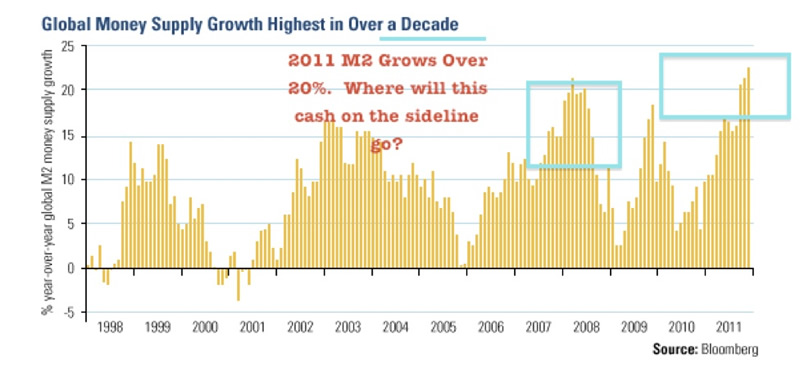
While the amount of money in the economy has grown, the velocity is still weak as institutions are hoarding cash. One method to discourage this is through a devaluation or quantitative easing. Where will the cash go on the sidelines as investors try to exit? Just like in 2009 and 2010, cash went into precious metals and mining stocks. Gold Stock Trades believes that this may occur again in the second half of 2012.
That is why we are not encouraging investors to panic into the U.S. dollar at this time and sell their mining stocks and precious metals for pennies on the dollar. The media is trumpeting any bad news on precious metals that is fit to print. Let us take a deep breath and consider the long term picture before making any irrational moves.
The picture of gold and miners versus global currencies especially the Euro show that the long multi-year trends are still higher.
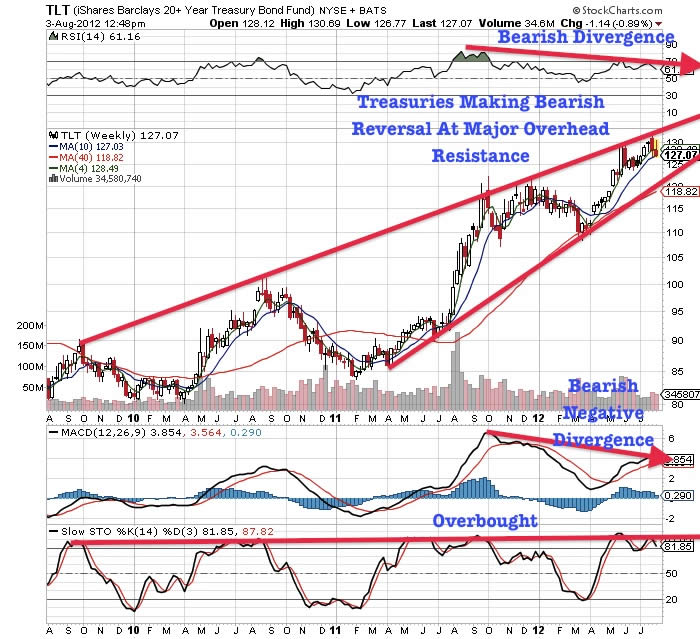
We have been told by some eminent pundits that there has been a meltdown below the 200 day moving average for the first time since early 2009 and that they are selling everything and are going short. We do not adhere to such actions. We believe the long term trend is being tested but we may find support for a reversal move higher.
Instead, we note that investors are rattled and are raising cash, fleeing to U.S. dollars and treasuries, despite knowing that their investments will receive negative returns. Moreover, at times such as these, many nightmarish scenarios begin to haunt the markets. One is that European sovereign nations may sell their surprisingly substantial official gold holdings.
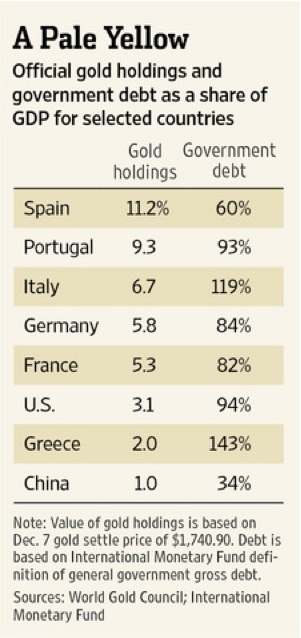
See the list published by the World Gold Council/International Monetary Fund to the right. Astonishingly, Spain has approximately four times the gold holdings as a share of GDP as the United States. Spain has 11.2% vs. The U.S. with 3.1%. The U.S. government debt is 94%, while Spain’s government debt is 60%. Germany and France clock in at 5.8% and 5.3%. Are the dollar and U.S. treasuries such safe havens when looking at this table above?
This data may infer that gold may not be dumped by these countries helter-skelter, although investors may be led to believe that the sovereigns are selling. However, the troubled Eurozone nations may have been steadfast in not selling their gold holdings at this juncture.
We may doubt that the European’s would resist pulling down the pillars of the temple and that Armageddon has not quite arrived. The Eurozone nations realize they are in need of cash, but still have not touched their precious metals. They realize just like we do that it is their only protection from the printing press. It is inevitable that the European nations and the U.S. will be forced to print to stimulate economic growth.
The Euro may be the recipient of active shorting, which serves to drive down the Euro and benefit the U.S. dollar, which smells like a rose in comparison. We are witnessing dollar and U.S. debt strength because world currencies are weak. Eventually, precious metals will regain their footing as the ultimate currency, as treasuries and the U.S. dollar may be in the final stage of its record parabolic blowoff.
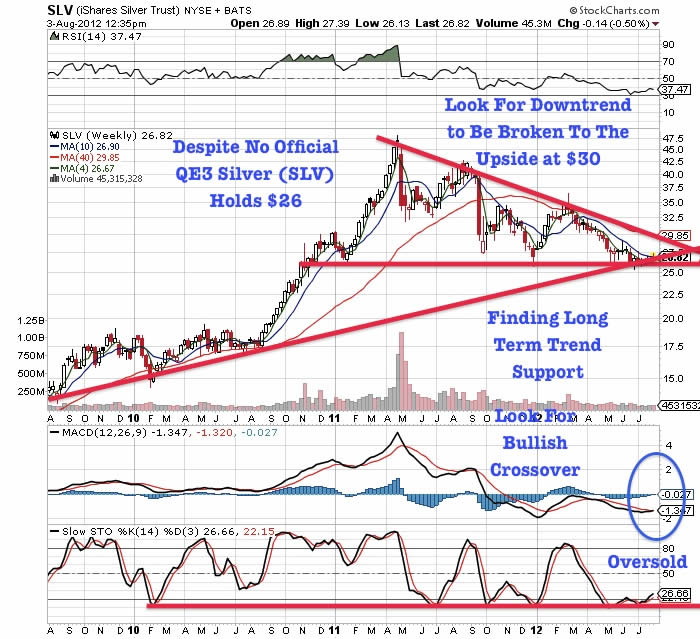
In the markets nothing lasts forever. Today’s fashions become tomorrow’s castoffs. The support for gold may be $1550 and $26 for silver, which is holding. Silver is still testing multi-year lows as well as the miners only to reverse higher. This is not a time to sell, when there is panic exacerbated by Central Bank misdirection combined with the summer doldrums.
It is not the first time that gold has had a number of drops from its long range upward trajectory. Undoubtedly, investors may question the fall from grace this year of gold and silver which saw highs of $1900 on gold and $50 on silver in 2011. Now they are trading near the lower parts of its yearly range.
Characteristically these metals have always been volatile and subject to breathtaking moves both upward and downward as they revert to their means. Do not forget the long term trend is moving higher and we must use this volatility to our advantage, rather than letting the irrational logic of the crowd divert us from our course.
There are enough reasons to explain these mercurial moves. Bernanke’s reluctance to openly inject the markets with the benefits of quantitative easing in 2011, since the expiration of QE2 in April has knocked the wind out of most markets including precious metals.
However, let us look at a possible red flag . China which possesses many American dollars and is the largest single holder of U.S. Treasuries may be in danger of economic duress. All the more reason for the Federal Reserve to provide sanctuary for China, which according to the table published above has a limited amount of gold holdings, but at the same time is awash with greenbacks and U.S. paper. This may go a long way toward explaining the dominance of treasuries and dollars as temporary, liquid safe havens.
Note from the table above that China has the lowest gold holdings from the list of nations. Rather than feature the true value of precious metals in a shaky market, Bernanke is indeed trying to prevent an explosive move in precious metals by strengthening the U.S. dollar and long term treasuries at the same time. It remains to be seen whether Bernanke can stem the ebbs and flows of the precious metal tides.
In the past when precious metals and miners have exhibited the possibility of rising and breaking out in 2011 and the first half of 2012, Bernanke instead has squashed them and in fact strengthened the dollar and long term treasuries even when the rating agencies have downgraded the credit of the United States and may do so again shortly. How else can this parabolic move in bonds and dollars be explained when we have witnessed dramatic printing and money supply growth?
What the Fed is doing is to panic buyers into accepting low interest rates in the face of a possible hyperinflation. This is why there is no official “QE” announcement although aggressive printing is occurring behind the scenes. This play is far from the finale and we are not quitting on precious metals and miners.
Had Bernanke announced QE3, the markets would’ve put on a happier face. Instead, investors are left to rise in despair and get shot down in flames.
Nevertheless, the precious metals phoenix will emerge once again from its own embers. Remember, we are witnessing a perfect tsunami at this time. The smell of fear is in the air.
This is the summer doldrum selling season during which reason is thrown to the winds and stock prices descend below support. There is an old teaching that sometimes a chart will exceed support on the downside to shake out the weak hands as it reverses to the upside. Sooner rather than later, wounds may heal and present us with astonishing bargains to buy winter coats in the heat of the summer.
Subscribe to my free newsletter to get up to the minute updates on rare earths, uranium, gold and silver.
By Jeb Handwerger
© 2012 Copyright Jeb Handwerger- All Rights Reserved
Disclaimer: The above is a matter of opinion provided for general information purposes only and is not intended as investment advice. Information and analysis above are derived from sources and utilising methods believed to be reliable, but we cannot accept responsibility for any losses you may incur as a result of this analysis. Individuals should consult with their personal financial advisors.
“Equity markets on both sides of the border have had a good ride since their lows set on June 4th. The Dow Jones Industrial Average is up 8.8% and the S&P 500 Index has gained 9.8%. Investing in equity markets has become less attractive. Accumulation of seasonal trades on weakness continues to make sense as long as the seasonal trades are outperforming the market. Sectors in this category include agriculture, energy, leisure & entertainment, software and gold. A cautious bullish stance appears appropriate”.
Two major negative events and one positive event impacted equity markets last week. The negative events were no change in monetary policy by the Fed and no tangible news from European Central Bank head, Mario Draghi. The positive event was the employment report released on Friday. Unfortunately, news on these three events is unlikely to have a lasting impact on equity markets.
Economic news this week is quiet and is not expected to have a significant impact on equity markets.
Earnings news this week focuses on Canadian companies. Most of the biggest S&P 500 companies already have reported. A significant impact on equity markets is unlikely. Second quarter earnings continue to slightly exceed consensus earnings estimates, which, in turn are lower than the second quarter last year.
Macro events are expected to be relatively quiet this week. Watch out for the start of hurricane season!
North American equity markets have a history of moving flat to lower during the first two weeks in August.
Short and intermediate technical indicators for most equity markets and sectors are overbought, but have yet to show signs of peaking. Most equity indices and sector indices have entered into a band of intermediate resistance. Upside potential is possible, but limited.
North American equity markets have a history of moving higher from June to December during Presidential Election years. However, at least one correction during that period normally occurs.
Cash on the sidelines remains substantial and growing. However, political uncertainties (including the Fiscal Cliff) preclude major commitments by investors and corporations.
The S&P Energy Index added 1.49 points (0.28%) last week. The Index remains above its 20, 50 and 200 day moving averages. Short term momentum indicators are overbought, but continue to trend higher. Strength relative to the S&P 500 Index remains positive ‘Tis the season!

The above chart represents the seasonality for Crude Oil Futures Continuous Contract (CL) for the past 20 years Via EquityClock.com
Gold slipped $13.70 per ounce (0.85%) last week. Intermediate trend is down. Support is at $1,526.70 and resistance is at $1,642.40. Gold remains below its 200 day moving average, but bounced nicely on Friday from near its 20 and 50 day moving averages. Short term momentum indicators are neutral. Strength relative to the S&P 500 Index remains neutral/slightly positive ‘Tis the season!
The above chart represents the seasonality for Gold Futures (GC) Continuous Contract for the past 20 years Via EquityClock.com
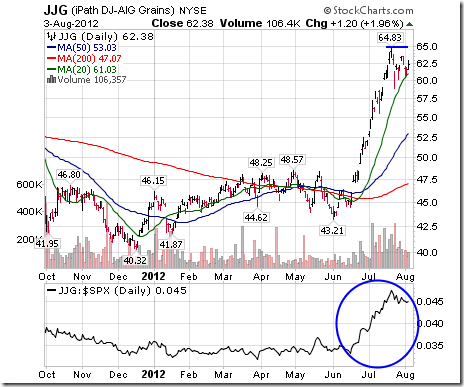
The Grain ETN added $0.46 (0.74%) last week. Intermediate trend is up. The ETN remains above its 20, 50 and 200 day MAs. Strength relative to the S&P 500 Index remains positive.
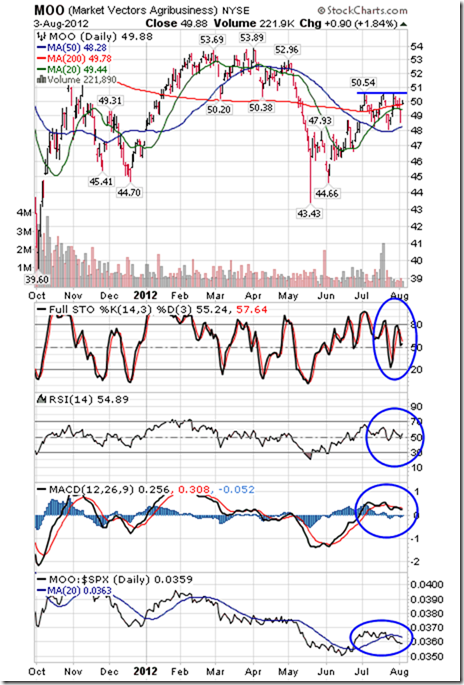
The Agriculture ETF slipped $0.48 (0.95%) last week. Intermediate trend is up. Units are testing resistance at $50.54. Units remain above their 20, 50 and 200 day moving averages. Short term momentum indicators are neutral. Strength relative to the S&P 500 Index is neutral/slightly negative.
About
Tech Talk / Timing The Market — Completely free seasonality, fundamental and technical analysis of the stock markets from a certified market leader. Market letters are published daily and are accessible though DVTechTalk.com and TimingTheMarket.ca. Comments in Tech Talk reports are the opinion of Mr. Vialoux.
Security positions held or not held by Mr. Vialoux will be indicated at the end of each Tech Talk report.


-
I know Mike is a very solid investor and respect his opinions very much. So if he says pay attention to this or that - I will.
~ Dale G.
-
I've started managing my own investments so view Michael's site as a one-stop shop from which to get information and perspectives.
~ Dave E.
-
Michael offers easy reading, honest, common sense information that anyone can use in a practical manner.
~ der_al.
-
A sane voice in a scrambled investment world.
~ Ed R.
Inside Edge Pro Contributors

Greg Weldon

Josef Schachter

Tyler Bollhorn

Ryan Irvine

Paul Beattie

Martin Straith

Patrick Ceresna

Mark Leibovit

James Thorne

Victor Adair