

That’s the problem. The money the Fed creates gooses up the markets, but doesn’t do much for the economy, and banks aren’t lending. It’s crystal clear in history. Every time you see a big debt bubble in a fall boom—as in the 1860s and 1870s—a depression follows. We saw this from 1873–1877 and into the early 1880s. We saw the next big bubble into the roaring 1920s, followed by the Great Depression and debt deleveraging after that. In short, debt bubbles ultimately burst and then deleverage. Deleveraging debt destroys money, so there’s less money in the system and it means deflation in prices.
That’s very important for investors to understand. In a deflationary crisis—whether in the 1930s or what started in 2008—everything goes down: commodities, stocks, real estate, even gold and silver in many cases. In deleveraging an asset bubble, all assets go down and there’s nowhere to hide. Investors have to be in the U.S. dollar and very safe bonds and cash and wait for the crash, and then buy at the bottom. That’s the trick. Cash is king—cash and cash flow.
In contrast, in an inflationary crisis such as the one we had in the 1970s, commodities, gold and silver were booming. Japan was in a positive demographic cycle. Emerging countries benefited. Real estate loves inflation. In that environment, a lot of things go up, but stocks and bonds go down. In this environment, though, there’s nowhere to hide.
So people just have to get out of the way. Even with all the stimulus, the Fed has no way to restore normalcy with this debt level and this demographic downturn. The stimulus has merely created bubbles in stocks and commodities, and commodities are already going down pretty fast. We think stocks are next, so we expect another stock crash within the next few years. And the next crash will be worse than in 2008–2009 because the Fed has pumped everything up and stretched the system to the max.
This is what happens in the winter season. It’s a survival-of-the-fittest struggle for businesses to see who will dominate their industries for decades to come. So it’s a huge payoff for the companies that simply survive and it deleverages the whole debt and asset cycle and brings things back to affordability. So it’s a difficult season, but it’s necessary and actually good in the long term. Lower prices in general will increase the standard of living.
The government is trying to skip winter. It keeps heating things up, pouring the money into the economy so the banks don’t deleverage debt and the banking system doesn’t collapse as it did in the 1930s. The truth is, it’s only keeping us in high debt and maintaining a bubble that’s not sustainable. Sooner or later, this stimulus will result in a crash that takes down the economy.
The top 10% of consumers are the only ones still spending. We know from demographics that wealthier people marry and have kids a little later. Their kids go to school a little longer, so their spending peaks four to five years after the average person’s. After these folks’ spending peaks, which will be by the end of this year, we’ll have a second demographic drag on the economy.
TGR: So we’re basically just getting into this 2008–2023 winter depression. How deep will the trough go? Will it bottom at the midway point? What should consumers expect over the next 20 years?
HD: A winter season lasts from 13 to 15 years or so. The worst collapses in stock prices and real estate hit when the banking system deleverages. In the 1930s, that happened early on. In this case, the government took a lesson from the 1930s and decided to keep pouring money into the banking system to prevent its meltdown. But it can’t be done. There’s a limit to how much you can stimulate. It’s like a drug. It takes more and more of the drug and it has less and less effect until it has almost no effect, and then the drug itself kills you.
We’re seeing that in Europe already. The last round of stimulus there—Qualitative Easing (QE) 2—was massive and came well after QE2 in the U.S., but Europe’s already back in trouble again and is having to implement all sorts of emergency procedures. There’s no bailing out Spain. It has one of the biggest real estate bubbles in the world and a rapidly aging population. The Spanish people won’t be buying housing for decades.
TGR: What do you see in terms of stocks?
HD: The worst is likely to hit in the next two years. It’s a matter of when the stimulus stops working or when governments throw in the towel. At some point, for example, German citizens may just say they won’t bail out another country. They’ve been doing it to protect exports and avoid defaults on all of the money they’ve loaned out already, but considering the demographics, it’s a losing game.
We’ve studied all of the major debt bubbles and depressions in history, and this one is different because Keynesian economics, which came out of the Great Depression, wasn’t adopted as economic policy until the 1970s recessions. So now, for the first time in history, central banks around the world—the European Central Bank (ECB), the U.S. Federal Reserve, the Bank of China and the Bank of Japan—are actively fighting deflation. When banks start to deleverage or when deflation starts to step in, they just push money into the system. The question is: Do they lose control?
Japan has been through all of this before, but when it came into its crisis in the 1990s, it had budget and trade surpluses. The rest of the world was experiencing the greatest boom in history, which we’d predicted. There was mild inflationary pressure and everybody thought Japan was about to take over the world when it was about to collapse. We were among the few who predicted that ahead of time in the late 1980s.
Japan continued to push money into the system and never let private debt deleverage at all in either consumer or financial sectors. Japan is still carrying very high private debt, and its government debt has risen from 60% of gross domestic product (GDP) to 230% and still climbing. So Japan didn’t really go through a depression. It was more an on-and-off mild deflationary recession because the stimulus eased the pain. But now Japan’s debt is much larger than before the crisis and deleveraging still looms ahead. Japan has been a lost economy for 22 years now. Real estate is down 60% and stocks are still down nearly 80%, 22 years later.
Demographics say the Japanese economy will weaken even further after 2020. The interest on its debt will go up in a spring boom with rising inflation worldwide, and it will be bankrupt immediately because its debt is so high. It’s only because it’s borrowing at 1% or less that it can handle its deficits now. Sooner or later, this game has to end.
TGR: So Japan’s QE has raised government debt to more than 200% of GDP but only managed to postpone a depression?
HD: Yes, it kicked the can a couple of decades down the road. It’s like trying to resuscitate a patient with a defibrillator. You keep hitting the chest, clear, boom. At some point, the patient dies. If the bond markets allow the U.S. to keep putting in money like Japan, we’d end up with a balance sheet on the Fed at $5–6T and up with QE of $4–5T before this is over. We’ve only gone about $2T so far. The Fed stimulus pushes money into the banking system, but the banks don’t lend it to fuel economic growth. They cover their losses and reserves, and then turn around and reinvest the rest in government bonds and stocks. They’re speculating. The money ends up in the stock markets. It’s like crack in the markets, and the markets just want more crack. But the markets can’t continue to go up when demographic trends are pointing down.
TGR: Your earlier mention of losing control brings to mind the people of Greece out in the streets rioting because demands for further sacrifices and more fiscal austerity have become unbearable.
HD: It is true. One of our financial advisers who was there recently reported every third store is closed or boarded up. Greece is in a depression and Spain’s headed there. The ECB has already pumped $270 billion into Spain and Greece just to cover its bank runs, which may happen faster than the governments can fend them off. In the U.S., the vulnerability is much more in real estate, as in Spain. We have a backlog of close to 4 million foreclosures already in the system. At some point, the banks will realize that home prices are not coming back. That they haven’t come back in Japan after 21 years gives us a hint. But if the banks start dumping these millions of foreclosures that aren’t on the market, it would kill the housing market and trigger a bank crisis that the Fed couldn’t stop with stimulus.
China also is vulnerable. Exports, which drive most of its economy, are declining rapidly while government spending on vacant buildings and empty cities has created a real estate bubble. If that bubble begins to seriously break down, Chinese consumers with disposable income, the top 10% of the population, own the real estate that will lose its value.
TGR: A while ago, you said businesses that manage to survive the winter would dominate their industries for decades to follow. What advice do you have for those running companies to help them come out the other side of a depression?
HD: First, those who are running a company and thinking about retirement within five years should sell their companies and retire now. Those who want to keep their companies and hand them down to the next generation or continue to grow them should hunker down, cut costs, cut overhead and put off capital expenditures. Rent your building; don’t own it. Sell real estate. Sell marginal product lines. In fact, sell everything you don’t need. Do everything to raise cash because, as I said before, cash and cash flow are king. Be lean and mean. Office space, real estate, factories, warehouses, anything you want to invest in your company will be a lot cheaper after deleveraging. Even if your business weakens, if your competitors weaken more rapidly, you’re winning. At some point, a lot of your competition, just like a lot of banks, will fail.
“Investors should be looking to invest more in emerging countries because they’re going to outperform.”
We saw this phenomenon after the Great Depression. There was a big payoff for the companies that survived; they dominated their industries for decades to come. Everybody thinks the market leaders were born in the technology revolution in automobiles and electricity in the early 1900s and into the roaring ’20s. Certainly, the race was on then, but the shakeout of the Great Depression decided who was left standing. General Motors survived and absolutely dominated the automobile industry from the 1930s through the 1970s. In electronics, it was General Electric.
TGR: You’ve also emphasized the importance of cash and cash flow for investors, advising them to either exit the equity markets or greatly reduce their exposure to stocks.
HD: Yes. Take advantage of the fact that the Fed has revived stocks and sell when the market is high. Reinvest when the prices are low. Joseph Kennedy made his fortune in the early 1930s, getting out at the top of the market when his shoeshine boy was giving him advice. When stocks were down 87%, he was buying at $0.10–0.20 on the dollar.
TGR: What are you doing personally to preserve or grow your wealth during this winter?
HD: I moved from Miami to Tampa in 2005, at the top of the real estate bubble and I’ve been renting, so I avoided a huge loss. Real estate in my neighborhood is down about 50%, and probably will fall another 20–30% before it’s over. I’m just looking at investments to actually be short stocks. I’m looking at ProShares Ultra Short MSCI Europe (EPV), which is an exchange-traded fund (ETF) at two times short the MSCI Europe index. The ProShares UltraShort Financials ETF (SKF) is another good one, two times short financials, because the financials in Europe are tending to get hit the worst. I think there’s a rising chance in Europe in the next few months of either a mini-crash, about 20% off the top, or a major crash like 2008–2009, where Europe just blows up. One way or the other, you need to either be out of stocks or you need to bet on things going down.
TGR: Any other insights?
HD: We’re buying natural gas, which seems to be going up since it bottomed out at $2. We’re buying agricultural commodities because that’s the last thing to go down in demand, and emerging market demand is still strong. Apart from natural gas and agriculture, though, pretty much everything else we see going down.
TGR: What about gold?
HD: I think gold has another run in it. It’s trending down right now, but I’d expect gold to benefit from the early stage of this crisis. If we have one more big QE coming in the U.S. and Europe—especially in Europe—gold is likely to rally. We told people to sell silver when it hit $50/ounce (oz) in April of last year. Now we’re suggesting selling gold if we see a good rally, say, $2,000/oz or higher.
Ultimately, there’s a natural instinct to expect gold to go up in a crisis, but if you look at 2008, gold and silver went up in anticipation of a financial crisis. But when the crisis actually hit and debt started deleveraging and money supply started contracting, which happened in the second half of 2008 and early 2009, gold went down I think 32% and silver went down 50%.
TGR: Everything went down.
HD: Exactly. That’s the point. The only thing that went up was the U.S. Dollar Index and Treasury bonds. This time, I think Treasury bonds may turn around. People act as if German, U.S. bonds and United Kingdom bonds are risk free. They are not. These U.S. and UK governments are in terrible debt, and Germany is holding the bag for Europe. People are throwing money at negative yields just because they don’t know where else to go. A better bet might be to go long the dollar or, even better, short the euro. That would be a good hedge.
TGR: What’s the best investing advice you ever received, Harry?
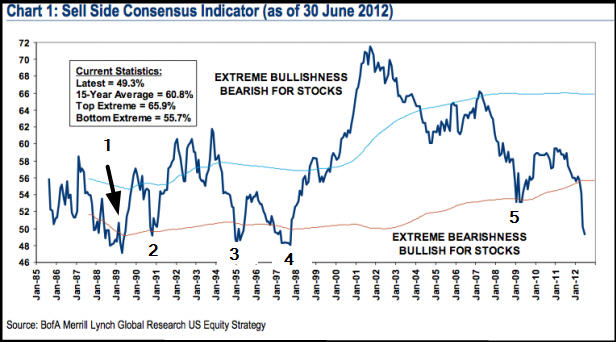
HD: Basically, I think you have to think contrarian, because it’s just human nature for people to pile into something, especially in these bubbles we’ve seen. They pile into tech stocks or real estate, thinking they can’t go down, and then the bubbles burst. I learned early on to think contrary to the crowd, something like Joseph Kennedy. Right now, most investors think these markets can’t go down because the Fed won’t allow them to. They call it “the Bernanke Put.” Well, if everybody’s thinking that, I don’t think that.
TGR: Whom do you view as the best investors?
HD: The classic ones are Benjamin Graham back in the good old days and Warren Buffett these days, although I think Buffett’s off base now that he’s become a cheerleader for the U.S. government.
TGR: You’re speaking at the MoneyShow in San Francisco in late August. What major themes will you cover?
HD: Basically three things: debt, demographics and deflation. People who argue that hyperinflation is ahead are dead wrong. Japan had zero inflation for the last decade despite massively more QE than we’ve done relative to its economy. It would have been a deflation if it hadn’t stimulated so much and the world hadn’t been in an inflationary mode. Debt deleveraging leads to deflation, and aging societies are deflationary. Old people are deflationary, young people are inflationary. The inflation of the 1970s had nothing to do with monetary policy. It was the baby-boom generation partying in college, spending their parents’ money. It’s expensive to raise kids, who don’t contribute economically until they get into the productivity curve in the workforce. At that point, productivity drives down inflation.
TGR: Do you expect the U.S. to fare better than Europe over the next two decades because of the echo boom, as the millennial generation gets into a serious spending cycle?
HD: Yes. The echo boom kicks in from about 2023 forward in the U.S. and in a lot of countries. It’s nowhere near the size of the baby boom generation, but enough to create growth again. But there’s no echo boom in Southern Europe or in China, where the workforce will start shrinking like Japan’s after 2015. Japan’s little echo boom runs out by 2020, and because Japan never deleveraged its economy, it’s not even benefiting much from it.
But, yes, there should be a worldwide boom with the stronger developed countries—Northern Europe, North America and Australia—doing fairly well, though as I say, not as strong as the boom we saw in the 1980s, 1990s and early 2000s. Excluding the developed countries of East Asia—Japan, Korea, China—the emerging world will really dominate in terms of demographics and workforce growth. Investors should be looking to invest more in emerging countries because they’re going to outperform. I would look first at India and Southeast Asia.
TGR: Should we be doing that now?
HD: Not yet. I’d wait until after the shakeout. China’s slowdown is hurting emerging countries, which depend on exporting resources, and so are the collapsing commodity prices. By the way, the 29–30-year commodity cycle has nothing to do with the 40-year demographic cycle, but they happened to peak in the same timeframe, around 2007–2008.
TGR: Other than going to cash, what else should people be doing to prepare for the depression/deflationary period ahead?
HD: Cut expenses and high-interest debt. I wouldn’t cut a mortgage if I’m paying 4–5% tax deductible on it, but get rid of credit card debt with interest at 22%. Don’t make any big capital expenditures. Don’t buy a house and don’t let your kid buy a house. If you’re more aggressive, you can bet on markets going down. For example, you actually can make money in the downturn if you short the euro, European stocks and U.S. financial stocks. But for most people, it’s just better to be safe.
TGR: Easier said than done these days.
HD: Unfortunately, the government is making it very difficult. The stimulus programs are knocking down interest rates on safer, long-term bonds so people can’t get yield anymore. If they go after yield, if they rush into bonds, stocks, commodities or especially dividend-paying stocks—which are the most popular thing now—they’ll get creamed when the stock market crashes. The alternative is to give up the dividends and low yields. Just be safe. You’d be crazy to buy a 10-year Treasury at 1.4% yield or a 10-year bond at 1.3% yield. All the countries are going to be in trouble.
TGR: Thank you, Harry, for your time and your insights.
Harry Dent will be a keynote speaker at the upcoming MoneyShow in San Francisco on August 24–26, 2012. Click here to register for free.
Harry S. Dent, Jr. is founder and CEO of the economic research and forecasting organization that bears his name and publisher of the HS Economic Forecast and the HS Dent Perspective. During the early 1980s, while a strategy consultant for Fortune 100 companies and new ventures at Bain & Co., Dent recognized the force that baby boomers exerted on the trends of the time, which led to his development of The Dent Method, a long-term forecasting technique based on the study of and changes in demographic trends and their economic impact that financial advisers and individual investors use via Dent’s Monthly Economic Forecast, Economic Special Reports, Demographics School and The Financial Advisors Network. HS Dent also provides two newsletter services. Former CEO of several entrepreneurial growth companies and a new venture investor, Dent also is a sought-after speaker and best-selling author. Since 1988 he has been presenting to executives and investors around the world, appearing on Good Morning America, PBS, CNBC, CNN and FOX and featured in Barron’s, Investor’s Business Daily, Entrepreneur, Fortune, Success, US News and World Report, Business Week, The Wall Street Journal, American Demographics, Gentlemen’s Quarterly, and Omni. Dent’s books include The Great Crash Ahead(2011), The Great Depression Ahead (2009), The Next Great Bubble Boom (2006), The Roaring 2000s Investor (1999), The Roaring 2000s (1998), The Great Jobs Ahead (1995), The Great Boom Ahead(1993) and Our Power to Predict (1989). Dent received his Bachelor of Arts degree from the University of South Carolina, graduating first in his class, and his Master of Business Administration from Harvard Business School, where he was a Baker Scholar and was elected to the Century Club for leadership excellence.
Want to read more exclusive Gold Report interviews like this? Sign up for our free e-newsletter, and you’ll learn when new articles have been published. To see a list of recent interviews with industry analysts and commentators, visit our Exclusive Interviews page.
Disclosure:
From time to time, Streetwise Reports LLC and its directors, officers, employees or members of their families, as well as persons interviewed for articles on the site, may have a long or short position in securities mentioned and may make purchases and/or sales of those securities in the open market or otherwise. Interviews are edited for clarity. Harry Dent was not paid by Streetwise Reports for participating in this interview.