
Timing & trends
The second of two periods of seasonal strength in the energy sector is approaching. The average optimal time is from July 24th to October 3rd. Thackray’s 2012 Investor’s Guide notes that a trade in the S&P Energy Index has been profitable in 10 of the past 15 periods.
Annual recurring reasons for seasonal strength include strong demand for energy used for air conditioning and declining refined product inventories when refiners are converting their production from gasoline for the summer driving season to heating oil for the winter heating season. Added to this year’s outlook is higher than average temperatures in North America this summer and forecasts for more of the same in August. In addition, U.S. heating oil and gasoline inventories already are at five year lows even before the annual conversion process has started setting the stage for significantly higher refined product prices this fall. Prices already have started to move higher. Since mid-June natural gas prices have jumped 42 per cent, wholesale gasoline prices have increased 16 per cent and heating oil prices have gained 16 percent.
International events also could impact crude oil and refined product prices. Iran has threatened on several occasions to shut down the Straits of Hormuz in response to the West’s growing sanctions designed to encouraging curtailment of Iran’s nuclear program. Most of the world’s crude oil shipments exported from the Middle East must pass through the Straits of Hormuz.
The Canadian energy sector could receive a boost this summer following news on Monday that China’s CNOOC made a “friendly” cash offer to acquire Nexen for US$15.1 billion. The offer came at a 61 per cent premium to Nexen’s closing price on Friday. The offer suggests that Canadian oil and gas producer stocks are undervalued and could prompt additional buying in the sector.
Ironically, energy equities and related ETFs have recorded only modest gains in July despite higher energy prices. Energy equities remain well below highs set in March and only began to outperform the S&P 500 Index and TSX Composite last week. Underperformance has been for good reason. West Texas Intermediate crude oil prices averaged US$88 per barrel in the second quarter, down from US$102 per barrel in the second quarter last year. Second quarter earnings and cash flow will be down substantially on a year-over-year basis. Investors have been reluctant to own the sector prior to the release of “difficult” second quarter results. The tip off will come this week when major Canadian and U.S. energy companies are scheduled to release results. If energy equity prices move higher despite bad news, the stage is set for a significant recovery by the sector into this fall.
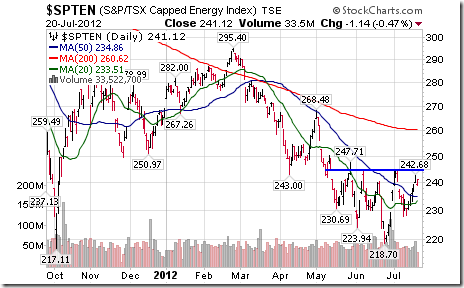
On the charts, the sector on both sides of the border has an improving technical profile. The S&P Energy Index broke to a 10 week high on Friday, the Philadelphia Oil Services Index broke above a reverse head and shoulder pattern last week and the TSX Energy Index will complete a reverse head and shoulders pattern on a break above 245.05. Preferred strategy is to accumulate energy equities and related ETFs at current or lower prices for a seasonal trade lasting until October.
A wide variety of Exchange Traded Funds in the energy sector as well as crude oil, natural gas and gasoline are available in North American equity exchanges. U.S. exchanges list 30 Energy ETFs. A list is available at http://etfdb.com/etfdb-category/energy-equities. Another 24 U.S. based ETFs trade oil, gasoline and natural gas. A list is available at http://etfdb.com/etfdb-category/oil-gas. The most actively traded U.S. listed ETF is the Energy Select Sector SPDR (XLE $67.28). Canadian exchanges list seven energy equity ETFs and eleven oil and natural gas ETFs. The most actively traded Canadian equity ETF is iShares on the S&P/TSX Capped Energy Index (XEG $15.06 Cdn.).
Don Vialoux is the author of free daily reports on equity markets, sectors, commodities and Exchange Traded Funds. He is also a research analyst at Horizons Investment Management, offering research on Horizons Seasonal Rotation ETF (HAC-T). All of the views expressed herein are his personal views although they may be reflected in positions or transactions in the various client portfolios managed by Horizons Investment. Horizons Investment is the investment manager for the Horizons family of ETFs. Daily reports are available at http://www.timingthemarket.ca/

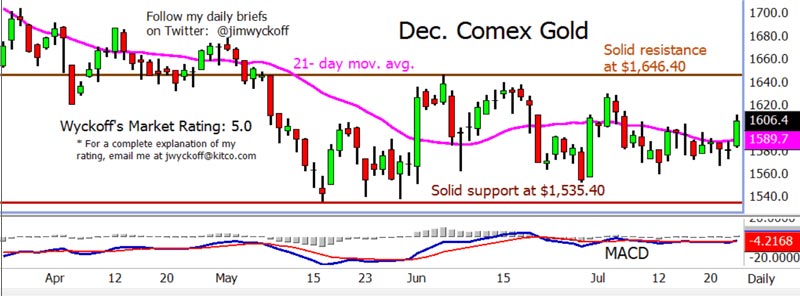
Jim Wyckoff of Kitco has a very useful chart online that shows that support and resistance levels I’ve spoken about. You can also notice that since June, gold has been making slightly lower highs and higher lows. This suggests a major move is approaching. I of course, think it shall be to the upside. Please note there are gold options expiring today and the “gang” normally like to lean on gold during these expiration’s. I’m sure those who wrote $1,600 strike prices were not happy with the rally yesterday. Today’s trading shall be interesting because it can be one of the rare expiration’s where the “gang” get squeezed. It couldn’t happen to a *&^%$ bunch, including their biggest cheerleader – Peter Grandich
Warning: Potent Comments from Central Banks and a Politician below
As Peter noted today was an important day in that despite any attempt by the options “Gang” to get the Gold Market back down to cover up the $1,600 strike price. Comex Gold finished the Pit Session $7 Higher on the European Central Bank chief Mario Draghi’s sudden shift in rhetoric. In Central Bank language Draghi said that they were prepared to use “nonstandard policy measures as an option”. Sounds like they are getting so desperate that if arresting Angela Merkel or burning down the Eiffel Tower would save the Euro the Central Bank would do it.
Draghi’s comments came as the market is also anticipating further stimulus in the U.S. The European Central Bank using “nonstandard policy measures” will almost certainly contribute to general market pessimism towards Governments in General, and paper currencies in particular. When you have Luxembourg Prime Minster Jean-Claude Junker saying“We all know what to do, but we don’t know how to get re-elected once we have done it”, you know that you can definitely trust Governments, and its financial arm Central Banks, to avoidwhat absolutely needs to be done.
Undoubtedly it will also boost investor confidence in a bottoming $1,600 Gold market. A Gold market that has been correcting for 11 months from its 1,900 high of last August. .
A sharply weaker dollar also lent support to gold. A softer dollar tends to underpin all commodities by making them cheaper in other currencies, plus some market participants tend to buy gold as a hedge against dollar weakness. No matter how you cut it, the Gold Market moved higher on the movements in currencies and potential Central Bank actions. – Robert Zurrer
(US Dollar & Euro Charts Below)


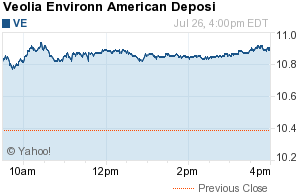
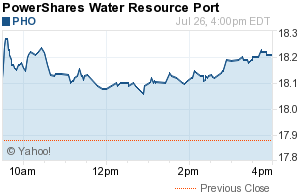
“Is water the gold of the 21st century?” asks Fortune. Answer: Yes, water is the New Gold for investors this century.
In 2010 global water generated over a half trillion dollars of revenue. Global world population will explode from 7 billion today to 10 billion by 2050, predicts the United Nations. And over one billion “lack access to clean drinking water.”
Climate and weather patterns are changing natural water patterns. And industrial pollution is making water a scarce commodity. So the good news is that huge “opportunities exist for businesses that can figure out how to keep the pipes flowing.”
Yes, it’s a hot market.
….read more analysis of the following topics HERE
- Population, the explosive driver in the demand for ever-scarcer water
- China’s mining “new gold,” for agriculture, industry, economic leadership
- New Gold hidden in steaks, auto tires, chickens, designer jeans
- Get your feet wet in wet stocks and watery ETFs

Late in the afternoon today (July 24th) word came via Bernanke pal Jon Hilsenrath that the Fed could be moving closer to taking additional actions to spur growth. There’s little doubt in my mind that this is indeed the case. In a recent note Bridgewater estimated that in the past few months global growth has slowed from a 3.3% rate down to 1.9%. This lower global growth should inevitably also cause lower inflation, leading developed market central banks to loosen policy via Quantitative Easing while emerging market central banks choose rate cuts. Whether you agree with these policies or not, I believe recent economic developments will cause the Fed to act.
Astute observers have noted that the recent plunge in US Treasury yields has primarily been a decline in real yields. Ten year break-evens, as an example, have declined only ~20bps since May down to 2%. Ten year nominal yields have dropped over 50bps in the same time period falling under 1.40% as of today’s close. Despite Chairman Bernanke profession that “additional tools” remain in play, I believe we will see additional large scale asset purchases “LSAP’s” in the form of Agency Mortgage Backed Securities. What will this accomplish and how is it different than last time?
Just as the repeated usage of an anti-biotic can have diminishing benefits, I believe that the impact of QE too will see a diminished impact. Here’s two reasons why:
1.) Little impact will flow through to mortgage borrowers
2.) Other fixed income “risk asset” yields are substantially lower today:


“With summer doldrums well and truly upon us markets have been drifting lower on low volume and trying to hold their May lows. Most metals and certainly gold have performed better and seem to have bottoms in place. As we note in the updates there are three companies on the HRA list that have been getting a lot more attention from traders and several others that are getting traction based on results to com.”.
“Major markets have not been cooperating thanks to debt issues that won’t go away soon. There are plenty
of headwinds still but commodity prices, though lower, are all at levels that makes them hard to pin the
blame on for weak markets.”
“Gold has defended its recent lows well, though not without a couple of scares along the way. Whatever the day to day comments of central bankers, few can see a way out of the current crises that doesn’t involve massive money printing. The US may have the lowest yields but it’s done the least about controlling expenditures so Washington will be printing right along with everyone else. Gold will benefit.”
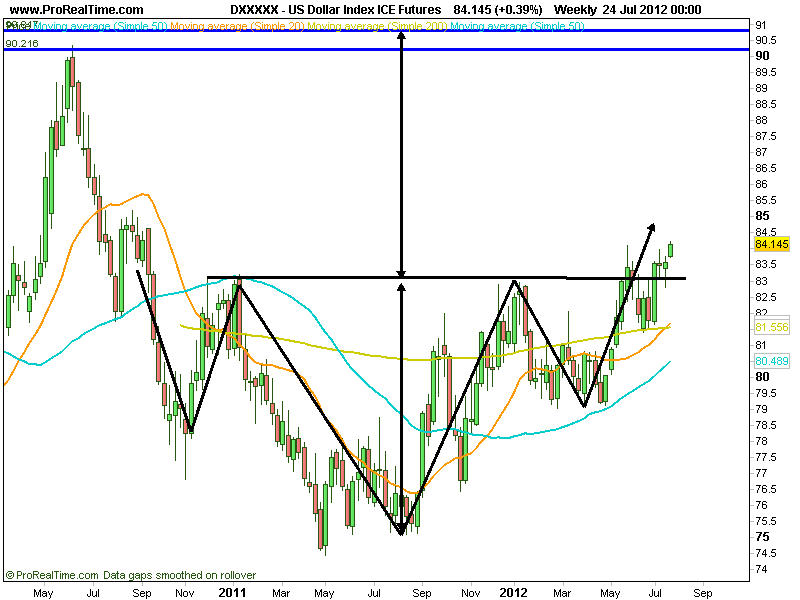
“The Dollar continues to be helped by its safe haven status. Every disappointment out of Europe has
generated upticks in the US Dollar Index which is now trading near a two year high”.
…. read the entire 5 page analysis HERE
US Dollar Chart

-
I know Mike is a very solid investor and respect his opinions very much. So if he says pay attention to this or that - I will.
~ Dale G.
-
I've started managing my own investments so view Michael's site as a one-stop shop from which to get information and perspectives.
~ Dave E.
-
Michael offers easy reading, honest, common sense information that anyone can use in a practical manner.
~ der_al.
-
A sane voice in a scrambled investment world.
~ Ed R.
Inside Edge Pro Contributors

Greg Weldon

Josef Schachter

Tyler Bollhorn

Ryan Irvine

Paul Beattie

Martin Straith

Patrick Ceresna

Mark Leibovit

James Thorne

Victor Adair