Personal Finance

Greg Weldon: “What’s up for grabs is absolutely key to understand”

 “At difficult times requiring sophisticated analysis, it is Greg’s time to shine. He has been top of these events for so long other analyst’s turn to Weldons work because it has been so good, is so good.” –  Michael Campbell.

gold QE3-300x250

Is the Federal Reserve going to save us all with QE3?  Weldon say’s “absolutely they will do QE3. The questions are only the timing, how to execute and how much will be needed to be effective”. There is a great deal of uncertainty right now as these markets and the environment have never been more difficult. “The fed will keep dangling the QE3 carrot in front of the markets long enough to keep them in check, so that they don’t hit another slide into a deflationary mode, which they are really on the verge of doing”. So QE3 is coming and the markets sense that. The real question is when. Greg spells out below some of the challenges the Fed faces in timing its QE3 stimulus below.

“Never has there been been a more critical fiscal or political situation. No one can really debate the fact that the fiscal future of the US hangs in the balance. That is a daunting process that really, in my mind, keeps the Fed on hold for the moment. Regardless the hope will run out at some point and the fed will move. You’ll get a rally, it will be disappointing,”

That and the Fed won’t have a lot of bullets left should QE3 fail. That and there is an election coming.

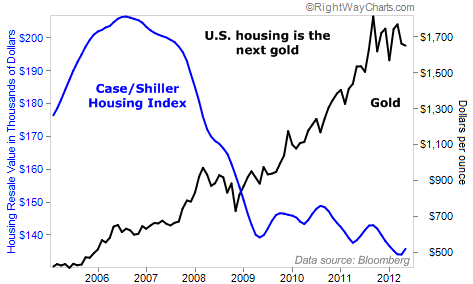
 With previous stimulus packages “We knew you would get some commodity inflation, some inflation in the markets, but you would not get the type of inflation that would show up in the regular economy, like wage inflation for exampe. You just wouldn’t have it. The trillions of dollars printed and pumped in sent the equity markets and commodity markets higher. It also re-liquified the banks and kept the system from collapsing into itself, yet it had very little efect on the real economy. The US economy is sick and getting sicker with US existing home sales recently seeing its biggest monthy decline, and US Food and Energy prices, particularly gasoline, are now down 3 months in a row. Further the US. posted the biggest retail sales decline in its history and the US labour market is clearly in a long term crisis of unemployment. Case closed”.

The markets are living on hope here, but that can only last so long. The real question is, can Bernanke can pull off something monetarily before the election?

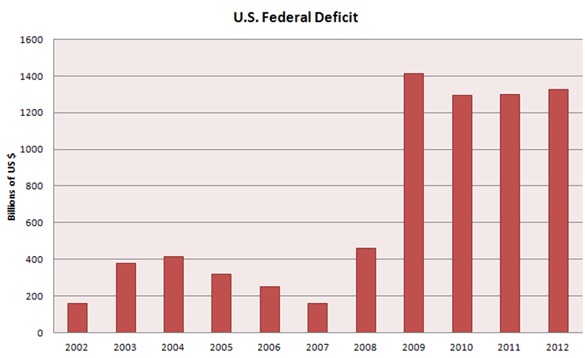
Whats up for grabs is absolutely key to understand,  what is happening now, in Europe and the USA, is  not a minor event, not even a major event. It has  the possibility of being a catastrophic event.” Weldon gives one example to underscore that point. As the fiscal situation stands, June was one of the top 10 spending months in US history and that spending was twice that of the revenue taken in. Public borrowing for June was an enormous 200 billion, on course to 1.3 trillion in borrowing for 2012. You’ve also have the situation where the treasury is introducing new bonds at the same time the Fed is is spending billions to take bonds out of circulation. “The fiscal picture is working against the Fed and its doing it right now in a major way”. Wow” So it makes it even more difficult for the Fed in terms of timing of QE3. 
Casey Research 1
 
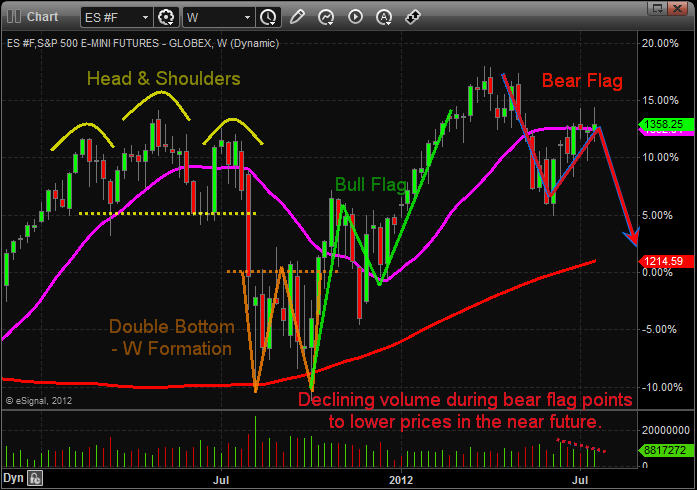
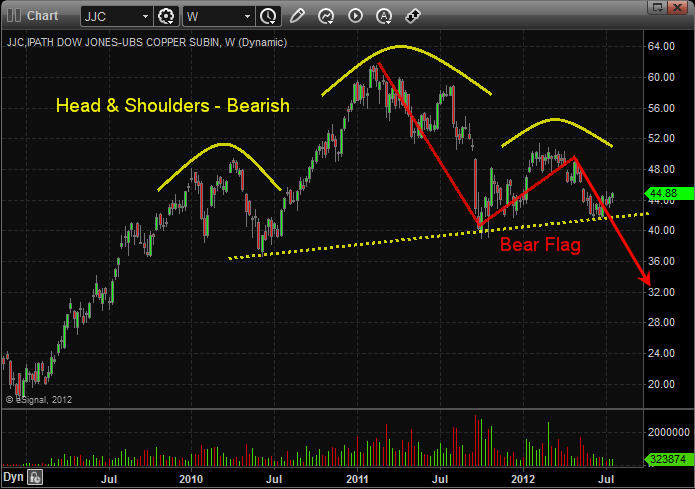
When they do do QE3, and they will do it says Greg, he thinks its likely that the markets will be at a lower level than they are now when the Fed pulls the trigger. For traders and investors they’ll not onl have the opportunity to loadup at lower prices, but lowerprices in markets will be the signal that the Fed is about to act and unleash QE3. Further, he thinks that there will likely be an immediate pop in the markets but the situation is so dangerous right now that if the Fed’s timing is not nearly perfect , and the and the markets don’t respond,  it will be the Fed’s worst case scenario described below:
 
As for the type of action the Fed is likely to take, one factor is that since it can’t lower interests past zero, the only place the Fed has any hope of bringing long term rates down is  by messing around and manuipulating in the long end of the Bond Market. Greg thinks that when you look at it from that perspective, a solution is not possible and “that is just reality.“The reality being that when push comes to shove, and we stare into that deflationary abyss, “every central banker in the world will choose to reflate no matter what the cost because they think that they can deal with reflation better. Iin their minds its preferable to the pain of deflation. That’s the bottom line. The question becomes when does their pumping of money not work? There are no easy solutions to this and Europe is demonstrating that right now”

Yesterday the 10 Year T-Note hit a record low interest rate of 1.402%

1669a8e1587aec21664a1607d464e16c

Bottom Line, this is a and extremely dangersous market. Mark’s key point on the timing of QE3 is that it is likely to come with markets at a lower level from where they are now. That would be consitent with the Federal Reserve and Governments natural tendency to  react to and unfolding crisis. 
 
Best reduce risk wherever possible.
You can also get some guidance on how survive and thrive this crisis by trying Weldon’s research publications (explained in more detail below) by signing up for a FREE TRIAL for thirty days.


Weldon Financial produces independent research for the sophisticated investor and/or trader and offers investment management solutions that capitalize on global market trends. Greg Weldon is the founder and sole producer of all the research and operates his money management services as a registered Commodity Trading Advisor. 

Weldon’s Money Monitor offers a very independent, objective view of the global markets by applying a top down market analysis and a bottom up technical analysis. Greg also publishes The Metal Monitor and The ETF Playbook offering specific focus on the precious metals markets (prices of Gold, Silver, etc.) and the world of Exchange Traded Funds, respectively. He has a creative and captivating writing style and his loyal readers have claimed that the ‘research pays for itself over time’. 

The Global Macro-Discretionary Program manages money for individuals, joint, trust, corporate and partnership accounts. Mr. Weldon approaches his investment selections from a top-down macro-perspective and then applies his quantitative discipline from the bottom-up to execute his methodology, seeking to produce an absolute return while sharply focusing on risk management. This program invests in a diverse range of futures contracts across the commodity, currency, global stock index, and global fixed-income sectors. Weldon’s Commodity Long-Short Program takes a more quantitative approach, using our proprietary Momentum Trading Indicators, and invests strictly in the strongest ‘bullish’ and ‘bearish’ commodities. And, our Metals-Only Program is also quantitatively driven and seeks to profit in bullish and bearish markets using a select basket of precious metals. 

You can also get some guidance on how to deal with this crisis by Weldon’s research publications are explained in more detail in the Research section below including an invitation to sign up for a FREE TRIAL for thirty days.


The Anatomy of The Future Gold & Silver Bubble

 
….read more HERE

The Bond King Doesn’t Like Bonds… “Real Assets Are the Better Bet”

Over the weekend, the Bond King “tweeted” twice…

His points were simple: You can’t make money in bonds. Real assets are the better bet now. 

I agree with the Bond King. And I think one “real asset” looks like a great bet here.

Bill Gross is the “Bond King”… He earned this reputation from decades of outperforming his peers in bonds. And he runs the world’s biggest bond fund. But he doesn’t like bonds today.  

A key reason he doesn’t like them is because after inflation, you’re actually losing money in bonds. You’re losing “purchasing power.” 

The Bond King asked, “How will investors maintain purchasing power? Stocks maybe. Real assets are the better bet.” 

“Real assets” typically means commodities and real estate. And between those two, there’s one clear winner for me.  

Take a look at the chart below, from the latest issue of my True Wealth newsletter. It shows real estate versus gold. To me, real estate looks like the place to be.

Gold vs Shiller

The price of gold has gone up for 11 years straight. Meanwhile, real estate is dirt-cheap by any measure… It’s more affordable than ever (thanks to record-low mortgage rates)… And the uptrend is just beginning.

When even the Bond King says you don’t want bonds, you know it’s time to lighten your load in bonds and other paper assets (like cash in the bank).

He says real assets are the better bet. Based on his track record, you should listen.

Of the real assets out there, I believe real estate is the one that offers the least downside risk and solid upside potential.

Listen to the Bond King.

Get rid of some of your bonds (and other paper assets) and replace them with real assets.

Real estate is my favorite real asset now… It’s what I’m doing with my own money… You should consider doing the same.

Good investing, 

Steve


Further Reading:

Many DailyWealth editors agree real estate is a terrific value right now. Catch up on the “cheap housing” argument here…

Why the Government Pays Me $1,250 Every Month  
“It’s no wonder some of the wealthiest people I know have been quietly doing this for years,” Mark Ford explains.

How to Make $44,200 – Tax Free – While You Sleep 
To understand the true value in housing, you have to understand one thing…

10 Smart Questions to Ask Before Buying a Stock

smart-person

perspectives commentary

Does diversification make you safe from market swings? Watch this week’s Stockscores Market Minutes video for the answer.Click here to watch the video on Youtube.
How do you assess a stock that you are considering for purchase? There can be an infinite number of answers to that question, some methods are effective and others will lead you to random results. Here are some things to consider when doing your analysis before you purchase a stock for your portfolio.
1. Understand who is in control of the stock
The best stock purchases come when control is shifting from sellers to buyers, when a downward trend is ending and an upward trend is beginning. That is also the most difficult moment to predict. It is easier to find stocks that the buyers have control of but are not yet well in to their upward trend. To do this, look for stocks that have rising bottoms on their stock chart but are not yet well in to an upward trend. A simple guideline is that stock’s that have a Sentiment Stockscore of 60 or higher are in the control of the buyers, but we want to get these stock early in the upward trend, not well in to it.
2. Know the trend of the company’s sector
A stock’s price performance will have some correlation to the market in general and a stronger correlation to other stocks in a similar industry. If you are considering an oil stock, check out the chart and the Stockscores indicators for an oil stock index. These are available on Stockscores in the Sector Watch tool, or by knowing the symbol of the industry index or ETF.
3. Find out if there will be a supply of new stock in the future
This is a rule more for smaller capitalized stocks, but it is a good idea to find out if stock issued from a recent financing will become free trading in the near term. If a company issues new shares to raise money, the new shares will come to the market and the investors that bought that financing may sell those shares when they are allowed to. Many newly issued shares have a hold period, so it is worth doing the research to find out when past issued shares come free trading. You can do this for US stocks by going to www.edgar.com and for Canadian stocks by going to www.sedar.com, or by going to the company’s website and checking out their news releases and regulatory filings.
4. Identify price zones where sellers will act
Investors have a memory and so too does the market. The market will remember past price tops and areas of sideways price trading. If a stock is moving up in to these price zones, there is a good chance that the upward momentum will stall there. Take the time to look at a stock’s chart going back at least two years to see areas where sellers may find inspiration to unload more stock and cause a top to an upward trend.
5. Look for signs of new information
A stock’s price will not move on what has happened in the past, it will move on what happens in the future. This means that fundamental information that is announced in the future will have a great affect on the movement of stock price. Within every company, there are a small group of investors that tend to get better information than others and these people may act in the market ahead of important fundamental events, creating abnormal market activity. Looking at a stock chart for signs of abnormal activity, including abnormal volume levels, abnormal price movement or breaks out of trading ranges can be a good way to identify stocks that may have big news coming.
6. Find out the dates of potentially significant news announcements
Big price moves in stocks are event driven, so it pays to do some research to find out if there is big news coming in the future. Is a company in a legal dispute that could soon be resolved? Are they testing a new product that may soon come to market? Are they seeking new resources that could improve their ability to make money in the future? Look for any event that could soon be announced and have a major effect on the stock’s price and assess the risks of a downward move versus the potential rewards of an upward move.
7. Read the message of the market
Stock charts tell us a story about what investors feel (emotional) about a company and what they know (rational) about a company. Learn to read the chart patterns to understand if the company is doing good things and if the market likes what they are doing. The best opportunities come when the market is just beginning to learn of something that will have lasting and positive effects on the company’s ability to make money. By getting in early on these hot story stocks, investors can enjoy lasting money making trends.
8. Think about what the crowd may be thinking
The crowd tends to be late trend investors so it is best to be one step ahead of the crowd. The crowd will take their investment cues from the mass media which makes the mass media a good contrary indicator. If an investment idea is front page news or the lead story on a widely watched TV program, it is likely that you are nearing a top in the stock. Be wary of following the crowd.
9. See if there are signs of emotion in the market
Emotional decision making causes investors to misprice stocks, either to the upside or the downside. In times of panic selling, there are bargains. In times of euphoria, there are overpriced stocks. To identify emotion, look for parabolic (curving) trends and high volume. In these cases, it is better to go against the crowd as the stock is likely to move back to the linear trend line.
10. Determine whether investors are confident or uncertain
Price volatility is an indication of investor confidence in the price they have given to the stock. Think of the stock market as a mechanism where investors can cast their vote on what the true value of the company is. Buyers buy because they think the stock is worth more and sellers sell because they think the stock is worth less. When buyers and sellers come to some agreement on price, you will find low volatility, sideways trading. When there is uncertainty, prices will change dramatically in a short period of time, often making the risk of the stock greater than the potential reward simply because the market does not have a good understanding of what the company is worth.

perspectives stocksthatmeet

This week, I used the Stockscores Market Scan to look for stocks that have a Sentiment Stockscore of greater than 59 but less than 76 and which traded at least 2500 times on Monday. That turned up a lot of stocks, I checked the charts to see which have them are not already well in to an upward trend. I searched for stocks that have chart patterns that are building toward an upward trend. Here are a few examples:

perspectives stocksthatmeet

1. GALE
GALE has been building optimism for about a month, I like it on weakness as it pulls back to the upward trend line which it is doing now. Support at $1.55.

chart1

2. CLDX
CLDX is building an optimistic pattern under resistance at $5.60, watch for a break through that price level as a cue that the stock wants to go higher. Support at $5.20.

chart2

3. HZNP
HZNP has been going up for a while but went in to a pull back flag pattern over the past few weeks. Today, it breaks from that flag and looks like it can continue higher. Support at $7.

Chart3

References


See which sectors are leading the market, and their components.


Disclaimer
This is not an investment advisory, and should not be used to make investment decisions. Information in Stockscores Perspectives is often opinionated and should be considered for information purposes only. No stock exchange anywhere has approved or disapproved of the information contained herein. There is no express or implied solicitation to buy or sell securities. The writers and editors of Perspectives may have positions in the stocks discussed above and may trade in the stocks mentioned. Don’t consider buying or selling any stock without conducting your own due diligence.


Buckle Your Seatbelts, Dr. Copper’s About to Get Bumpy

It was just about a year ago today when the S&P was sitting at fresh highs and everyone was enjoying a rather upbeat summer.  It was a nice summer, the markets were calm, and there was a surreal sense of optimism.  Then, in the matter of a few days, things got real ugly, real quickly. 

Well, it doesn’t seem like too much has changed since then.  We’ve had mixed earnings reports, ever-evolving worries in Europe, and the always looming fiscal mess in the US.  Once again, are we in the calm before the storm?

It looks like things in Europe may start to heat up again.  Riots turned violent again in Spain as protestors took to the street over austerity measures.  With seemingly no resolution, a sinking tourism industry in the PIGS, and a typically hot summer August on its way, all signs point to further turmoil.

Technically, we’re currently seeing a number of bearish indicators setting up in the S&P and other markets. First, on the weekly chart of the S&P 500 Futures we can see what appears to be a bear flag formation developing.  Note the recent rise in price since the beginning of June on decreasing volume. 

7-23-12-tgaog-SP1

A second look at the S&P daily illustrates two intermediate time frames that are currently pointing down.

  • Completion of two intermediate cycles within longer term five wave pattern
  • Downwards wave one from April until beginning of June followed by wave two correction from June until present.
The wave two correction typically proceeds the longest wave, wave three, which is pointing towards a large move down (Note that in the first shorter term cycle the downwards wave three was the longest by far.  We expect the same to be repeated in the longer term cycle.)

7-23-12-tgaog-SP2


A look at the longer term view using the weekly chart again supports our argument for a major correction. We have just completed a five wave pattern since the 2009 lows, and it is looking more like a big pull back is due. Remember most major trends end after the fifth wave. 

7-23-12-tgaog-SP3

 If we take a look at the copper ETF, “JJC”, we are provided with further justification. Copper is often referred to as “Dr.Copper” due to its industrial application and is known to be a leading indicator for equity markets. Copper has significantly underperformed equity markets and is likely leading the next move down. A look at the weekly chart which points to a rather dismal outlook. There is a major head and shoulder patterns developing. 

7-23-12-tgaog-SP4

Last summer turned into a bloodbath with nothing but red candlesticks taking stocks and commodities sharply lower. If you haven’t already, it’s time to lock in some profits. Short, intermediate, and long term cycles are pointing down, and the increasingly bearish technical developments cannot be ignored.  We’ll be looking at entering multiple shorts potentially in the very near future once/if setups present themselves. Buckle up and stay tune for more…

Stay in the loop by joining my free weekly newsletter and weekly video to stay ahead of the crowd:www.TheGoldAndOilGuy.com