
Stocks & Equities
This week could be a huge one for stocks and commodities. This morning the dollar index is taking another run at our weekly chart resistance level. If it can break out and start to rally this week then a possible 4-6 week sell off in stocks and commodities may be just starting.
Watch the morning video or at least the last 4 minutes where I cover the SP500 intraday and daily chart which shows the main cycles and what we should be expecting within the coming days and weeks.

re- Market Analysis Points:
– Dollar index is making new highs this morning and if it can hold up into the close today then I would expect it to keep running higher for a few weeks.
– Oils has pulled back 5% from its high last Thursday and is now testing support and starting to bounce.
– Natural gas is holding up well after Friday’s strong rally to new highs. It may be forming a bearish pattern with the three sharp surges to new highs pattern which I explain in the video.
– Gold and silver trader trading down 1+% and are likely to find a little support today as they test support levels. They are at risk of a major breakdown but currently they are still holding up.
– Bonds are reaching new highs this morning but looking ready for a 1-3 day pause. They are a little overbought.
– SP500 charts have been the most interesting the past couple months which is why I keep focusing on it.
If you did not read my special report and wave counts then do so here: http://www.thegoldandoilguy.com/articles/put-your-seatbelts-on-its-about-to-get-bumpy/
Watch Video Now: http://www.thetechnicaltraders.com/ETF-trading-videos/
The video clearly explains where the market seems to be trading in terms of cycles and what we should expect this week and in the coming month.
Chris Vermeulen
Tags: Market Cycle, market forecast, Stock Market Cycles, Stock Market Predictions
This entry was posted on Monday, July 23rd, 2012 at 8:56 am and is filed under Daily Market Trades, Market Forecast, Stock Market Predictions, Traders Buzz, Trading Videos. You can follow any responses to this entry through the RSS 2.0 feed. Both comments and pings are currently closed.

After being sucked into the general commodities correction, silver has been relentlessly drifting lower since late February. But this weakness has forced the white metal down to a very bullish place technically. Silver is now quite undervalued compared to prevailing gold prices, its primary driver. Thus it has great potential to rally mightily in the coming months to regain much lost ground relative to gold.
Silver is a fascinating commodity that has won a fanatical following among traders. It is extremely volatile, with big spikes or plunges always possible. This makes it irresistibly alluring to speculators, who alternately pile in to ignite huge rallies before running for the exits to spawn near-crashes. The perpetual back-and-forth struggle between greed and fear is the essence of speculation, and silver embodies it.
But what drives these winds of sentiment that buffet silver around? Gold. Silver traders constantly look to the yellow metal’s fortunes to figure out whether they should buy or sell the white metal. While there are rare and short-lived exceptions, the vast majority of the time silver only rallies significantly when gold is strong and only sells off materially when gold is weak. Gold is the key to silver’s price action.
Greed flares up in silver traders’ hearts when gold is strong, motivating them to aggressively buy silver and catapult it higher. And fear rears its ugly head when gold is weak, scaring silver traders into dumping silver hand over fist which crushes its price. Because gold overwhelmingly influences silver-trader psychology, it is the primary driver of silver. Technically this has proven irrefutably true for decades now.
And silver’s recent correction is no exception to this rule. Silver’s last major interim high was on February 28th, the exact day gold’s latest top was carved. The next day gold plunged when the Fed Chairman failed to hint at a third round of quantitative easing in testimony before the US Congress. Since then, silver has lost 26% while gold only gave back 12%. This has left silver “undervalued” compared to gold.
Now since silver doesn’t spin off any earnings like a stock, it can’t be valued with traditional valuation metrics like price-to-earnings ratios. But its historical relationship with gold is so strong that it can be valued compared to gold, an alternative valuation measure. When silver gets too high relative to gold, a correction is due to restore this relationship. And when it gets too low, like today, a rally is probable.
This first chart simply looks at the silver price superimposed over the gold price. Before 2008’s once-in-a-century stock panic, silver tracked gold very closely. But the panic’s epic fear superstorm forced hyper-speculative silver to decouple from gold to the downside. Silver eventually caught up with gold again, and overshot to the upside in a mini-mania in early 2011. And today it is once again way too low.
Before the stock panic, silver’s correlation with gold was very tight both visually and statistically. Silver had a pre-panic r-square with gold of 94.7%. This means nearly 95% of silver’s daily price action was statistically explainable by gold’s own! Silver was truly a leveraged secondary play on the gold price, rallying when gold was strong and selling off when gold was weak. Gold overwhelmingly drove silver.
But the stock panic’s extreme fear radically disrupted this historical relationship. While gold plunged 27% between July and November 2008, silver plummeted 53%! This dragged silver to a 34-month low, while gold only hit a 14-month low. Silver was simply too low relative to gold, creating an incredible buying opportunity as I discussed just after the panic. Silver would have to soar to reestablish this relationship.
Interestingly during the panic, silver’s r-square with gold plunged to 52.5%. Only half of its daily price action was statistically explainable by gold’s own. This brings up a second important point for silver traders to understand. While gold is silver’s primary driver, the stock markets sometimes usurp it. Major stock-market down days generate so much fear that it spills into silver and taints this hyper-speculative metal’s sentiment.
After the panic silver indeed rallied strongly with gold, but the panic-driven gap between these metals persisted for a couple years. Silver didn’t really start regaining favor with traders in a big way until autumn 2010 when it started surging much faster than gold. By late 2010 it had finally caught up with gold, regaining its tight pre-panic relationship with the metal that drives its traders’ psychology.
But provocatively silver’s strength had started to feed on itself. The huge silver rally enticed more capital into silver, which forced its price even higher, which drew in still more capital. The result was a mini-mania in early 2011 where silver blasted higher to hugely overshoot the gold price. While fun, silver was extremely overbought and the rampant greed was mind-boggling. So a sharp plunge was imminent.
I warned our subscribers in advance, just as silver was topping. And the resulting plunge was actually a near-crash, an extreme selling event nearing crash magnitude. Unfortunately silver’s mini-mania had pulled most near-term buying forward, leaving overwhelming selling pressure in its wake. So silver started grinding lower on balance, ultimately correcting 46% between April 2011 and June 2012.
The latest part of this correction since February is particularly interesting for us today. Note that silver had nearly regained its historical relationship with gold before Bernanke’s latest QE3 scare hammered the precious metals. But the subsequent outsized selloff in silver, which leveraged gold’s downside in recent months by 2.2x, has left silver too low relative to gold today. A panic-like gap is back, a very bullish omen.
Silver, which is trading near $27 this week, would have to rally to $35ish to regain its historical “valuation” relative to gold. This is a 30% move higher, and assumes gold doesn’t advance which would push the silver target even higher. This silver catch-up rally is likely to begin soon, no later than September. Once we get through this year’s usual precious-metals summer doldrums, silver has a lot of ground to make up.
But silver’s near-term potential is even greater than this as evidenced by the Silver/Gold Ratio. The SGR mathematically quantifies silver’s close relationship with gold It is calculated by dividing the daily silver close by the daily gold close and charting the resulting multiple over time. Since the true SGR results in tiny decimals (like 0.017 today), I prefer to use an inverted Gold/Silver Ratio scale as an SGR proxy.
For me at least, it is a lot easier to think in terms of ounces of silver per ounce of gold (58) than the other way around. So the SGR proxy on this chart is rendered in blue off the right axis, superimposed over the raw silver price in red. This particular perspective on silver’s relationship with gold is far more precise than the visual comparison in the first chart. And it shows silver is quite undervalued relative to gold.
Prior to the epic discontinuity of the stock panic, silver traded in a range between 60 ounces per ounce of gold on the low side to 45 on the high side. This is highlighted in darker blue in this chart. When silver was in favor among speculators it was high in this range, and when it was out of favor it was low. The pre-panic average was 54.9. But silver plummeted so fast during the panic this average briefly fell to 75.8.
Silver was quick to recover after the stock panic, temporarily regaining the lower support of its trading range as early as autumn 2009. But then it drifted lower again until autumn 2010, when gold rallying to new all-time nominal highs finally rekindled greedy excitement among silver traders. So silver took off like a rocket, blasting higher in a mini-mania that ultimately peaked at an SGR near 32 in April 2011.
This incredible spike opens up another technical perspective beyond silver’s horizontal trading range relative to gold. As you can see on this chart, the SGR was actually in a secular uptrend before the panic and regained that trend channel for over a half year in 2011. So there is a chance as silver’s allure spreads to more mainstream speculators this metal could once again be pushed back up into that secular uptrend.
Today the SGR is trading near 57.9, it takes almost 58 ounces of silver to equal the value of a single ounce of gold. But this is very low in the SGR’s trading range, and way below its secular uptrend. These metrics yield a variety of near-term upside targets for silver, all possible between this autumn and next spring. No matter how you want to look at silver today, it remains quite undervalued relative to gold.
After the SGR has fallen relentlessly for 14 months, silver is certainly due for some outperformance relative to gold. Silver enthusiasm is like a sine wave oscillating around the gold price, periods of underperformance are followed by periods of outperformance and vice versa. So conservatively it is not hard to imagine silver shooting back up near the top of its horizontal SGR trading range by next spring.
This means silver would have to rally until just 45 ounces of it equaled the value of an ounce of gold. At this week’s gold price of $1580, a 45 SGR implies a silver price of $35. Interestingly this is the same target the first chart yielded, so once again it is a 30% rally from today’s levels. That’s not too shabby at all, and would certainly lead to soaring prices for today’s all-but-abandoned silver miners’ stocks.
But what if gold rallies too? Throughout its decade-long secular bull, gold has averaged a seasonal rally around 19% between late July and late May during its strong season following its summer doldrums. If gold is 19% higher by next spring, we are talking $1875ish. Plug a 45 SGR into that, and silver’s upside target for its coming strong season rises to $42. This is an impressive 54% rally from this week’s levels!
But since silver has been out of favor relative to gold for so long, I suspect merely seeing silver head back up near the resistance of its pre-panic trading range is fairly conservative. So how about an aggressive upside target? If silver regains favor among speculators again over its coming strong season, which is certainly possible, it could punch back into its secular uptrend in SGR terms. Its midpoint is 34 now.
At today’s gold prices, a 34 SGR implies a silver price of $46. This is 70% higher than today’s silver prices! But if you assume a normal seasonal gold rally between now and spring, a 34 SGR implies $55 silver by May. This is a staggering 104% above today’s levels! While this higher target is a lot less likely since speculators will have to fall in love with silver again for it to happen, it is still definitely possible.
Regardless of which SGR target you think is most likely in silver’s upcoming strong season, there is no doubt that silver is undervalued relative to gold today. After being out of favor compared to gold for over a year, silver has been driven to such compelling price levels that it shouldn’t take much of a gold rally to get speculators salivating over silver again. And gold’s usual summer-doldrums drift is nearing its end.
Don’t underestimate the power of this mean-reversion tendency in the precious metals. Back in February 2009 when I first ran these charts just after the panic, the SGR was trading way down near 72. There was so much silver despair after its panic-driven plunge that people thought I was nuts for thinking silver would ever recover. But recover it did, not only regaining its historical average relative to gold but far exceeding it.
This is a fantastic lesson for precious-metals-stock investors and speculators to take to heart. Recently despair hammered the gold stocks and silver stocks down to panic levels relative to the gold price! I wrote about this extensively, explaining what extreme bargains PM stocks have become. Yet traders are still so scared they won’t touch PM stocks with a ten-foot pole. They believe a mean reversion isimpossible.
But as silver’s meteoric mean reversion and overshoot relative to gold proved in late 2010 and early 2011, sectors don’t stay out of favor forever. Sooner or later new investors and speculators recognize the incredible undervaluations in left-for-dead sectors and start buying. And this feeds on itself, as nothing begets higher prices like higher prices. Silver, silver stocks, and gold stocks are all overdue to benefit from this cyclical mean-reversion phenomenon.
And now is the time to start buying, in the heart of the summer doldrums. Nearly every year like clockwork, gold drifts sideways in the summer while silver and the PM stocks grind lower. This is driven by the lack of seasonal gold-demand spikes, as I explained in an essay last week. This leads to widespread capitulation among precious-metals traders this time of year, just before the big autumn rally.
So seasonally the best entry points for gold, silver, and the PM stocks are spread across the next couple weeks. Precious-metals psychology is down near an ebb of despair this time of year, leading to excessively-low prices in the entire PM complex. Even though the summer doldrums happen every year, for some inexplicable reason PM traders seem to be frightened anew each time summer rolls around.
The bottom line is silver is now quite undervalued relative to gold. It has been losing ground compared to its primary driver for over a year now following a massive mini-mania spike. But the selling in recent months has been excessive, driving silver too low relative to prevailing gold prices. So silver is likely to outperform gold in this year’s upcoming strong season for the precious metals, which is due to start soon.
Brave contrarians willing to fight the crowd have a great opportunity today to buy silver and silver stocks cheap ahead of this rally. As usual the summer doldrums have frightened the weak hands into selling low. And with silver cheap relative to gold, and silver stocks trading near panic levels thanks to the gold-stock capitulation, the bargains today are amazing. Seize the day and load up before the autumn rally.
By Adam Hamilton, CPA
Questions for Adam? I would be more than happy to address them through my private consulting business. Please visit www.zealllc.com/adam.htm for more information.
Thoughts, comments, or flames? Fire away at zelotes@zealllc.com“>zelotes@zealllc.com. Due to my staggering and perpetually increasing e-mail load, I regret that I am not able to respond to comments personally. I will read all messages though and really appreciate your feedback!
Copyright 2000 – 2012 Zeal Research (www.ZealLLC.com)

Dog days of summer? Not much happening in the markets? Tight trading ranges? Yes, all are true. But that’s no reason to be complacent! Quiet markets and tight trading ranges can be very deceiving, often leading to surprises. (
(Ed Note: If you’d prefer to watch this presentation in Video go HERE)
The last couple of weeks since I last spoke with you by video haven’t seen much in the markets other than tight trading ranges, a lot of coiling up like a spring ready to break.
That’s somewhat understandable considering we’re almost in the dog days of summer. And there’s a lot of uncertainty about what’s happening in Europe and, of course, the latest developments in the Middle East with Iran and Syria.
The major trends have not changed so let’s go right to the charts.
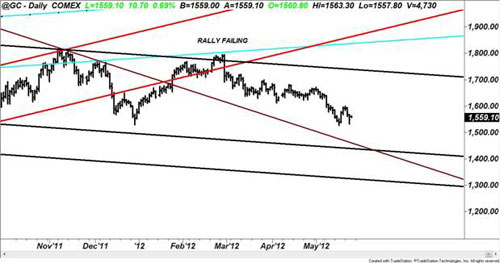
Gold: Here is a fresh new chart of gold. As you can see, gold is largely going quite a bit sideways. It’s coiling up and that’s usually an indication of a substantial move coming.
I do believe that it will be to the downside. Nothing’s changed there.
My system signals continue to suggest a sharp move to the downside; however, in a tight trading like this anything goes. I wouldn’t be surprised to see one last rally out of gold, even up to $1,680, before the next leg down occurs. You can see right here there’s tremendous resistance overhead in gold between $1,680 and $1,700.
Bear in mind, I’m long-term very bullish on gold, but that next leg up in gold will not materialize until we get a solid test of long-term support down below $1,500, probably around the $1,400 level.
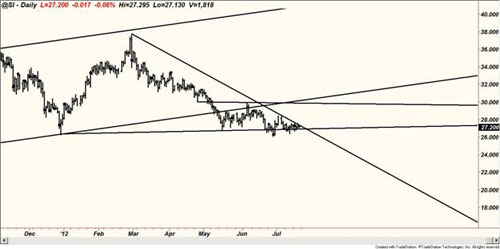
Silver: Silver, much like gold as you can see here, is really coiling up in a very tightly wound trading action here. Silver, like gold, could stage one last rally. However, I believe that we are still very likely to see $23 and $20 silver before silver’s long-term bull market reemerges.
You can see here it’s on the edge of doing something in this contracting triangle — we’re very close to perhaps a short-covering rally or a complete breakdown.
There isn’t much in the way of support once $26 is broken. There’s some minor technical support at $23, and then really no support until around the $20 level. So keep your eyes on both gold and silver. I think we’re close to some significant moves there despite the recent, very tight, sideways action.
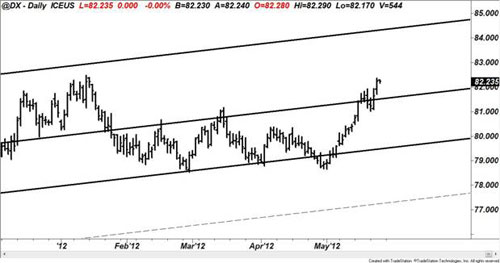
U.S. Dollar Index: The dollar is looking very healthy here, again, because the euro is so sickly. The dollar has had a nice uptrend, which I correctly forecast.
We’ve pulled back a little bit and we could pull back a little bit further basis the Dollar Index to about 83, but then we should see another leg higher to the 86, 87 level as Europe’s crisis continues to roll on.
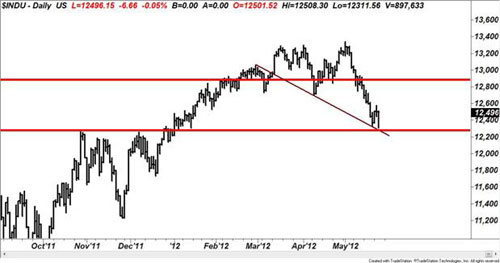
Dow Industrials: The Dow Industrials have been very resilient, which is a testament to what I’ve been telling you all along — that it is in a new long-term bull market; but short- and intermediate-term, the Dow is not acting that well.
The internals on the Dow Industrials are not very strong. The breath of the recent rally is not very healthy. Volume is lackluster. As you can see from this pattern here it’s really not, as Elliott Wave people would call it, impulsive to the upside.
This is a correction. And we are now at a very significant resistance level in the Dow. So I would not be surprised to see the Dow start to roll over.
I’m still looking for a test just below 12,000, 11,500, maybe even 11,000 down here, before the next big leg up in the Dow Industrials occurs.
As quiet as the markets have been in choppy, tight trading ranges over the last couple weeks, and the fact that we’re heading into the dog days of summer, I do recommend that you stay in touch with all my writings and keep abreast of the markets because, as you can see from these charts, things are coiling up and that’s usually a sign, a precursor, of some big moves ahead.
So stay tuned and have a good week.

The Age of Deflation is Intensifying:
Last week I wrote about how interest rates on some European government debt was trading at a negative yield…that is…you buy short term German or Swiss bonds and you get your money back…minus a safekeeping charge. This week the number of European countries with government securities trading at negative yields grew to include Germany, Switzerland, Holland, Finland, Denmark and Austria….while the yield on Spanish 10 year government bonds rose to 7.3%…their highest level since the introduction of the Euro.
This week the value of the Euro fell to a 2 year low against the US Dollar, a 12 year low against the Yen, a 21 year low against the CAD and a 23 year low against the AUD.
Credit Quality Spreads Widen:
The market is focused on Spain…where the debt problems only seem to be getting worse…while at the same time citizens of countries that might provide financial help, particularly Germany, seem to be increasingly unwilling to do so….this is making the “Euro debt crisis” an even tougher problem to solve…fear is driving capital from the periphery to the center in an attempt to find relative safety…the yield spreads between problem countries and perceived safe havens continues to widen.
The Crisis Could Get Much Worse – Quickly:
Despite the fact that several European financial crisis have come and gone over the past couple of years it now feels as though the crisis could suddenly take a dramatic turn for the worse…the debt problems seem to be getting much bigger and the solutions seem to be getting much harder to find. A dramatic turn for the worse would have a contagion effect on global markets…which would inspire central bankers to take dramatic action…have no doubt, when push comes to shove central bankers will fight deflation with stimulus.
A Real Crisis Could Produce a Real Solution:
Perhaps a really dramatic crisis will force the politically unpalatable action necessary for a lasting solution to the European debt crisis…such a solution would certainly include default/bankruptcy in some form…either a debt write-off or a dilution of liabilities through the adoption a new currency.
If The Stock Markets Aren’t Much Worried – The Credit Markets Certainly Are:
Until Friday the major European and North American stock markets had made good gains for the week…they appeared oblivious to the European credit market stresses, and to the growing evidence of a global economic slow down. Perhaps the markets sensed more central bank stimulus was coming soon, although Fed Chairman Bernanke seemed to rule that out during his Congressional presentations…or perhaps the stock markets were benefiting from capital flows seeking safety….however they turned sharply lower Friday as the Spanish debt crisis intensified.
Despite the European stresses and the evidence of a global economic slowdown the DJI has rallied nearly 1,000 pts from its June 4 lows to this week’s highs…the British, German and French stock markets have also made good gains while the AUD has rallied over 8 cents, and the CAD is up 3.5 cents. However, if the stock markets aren’t worried the credit markets certainly are…witness the negative yields in perceived European safe haven countries and note that the yields on all US Government debt are at or near all time record lows…even while the US Treasury issues new debt at a record pace.
Two Big Risks Ahead For Investors As The Macro-Economic Deflation Intensifies:
1) Asset prices decline, and
2) Taxes on “rich” people will go up. This will make it harder to preserve capital…and it won’t much matter which political party is in charge…the “math” of the debt problems supersedes political dogma…way more money has been borrowed than will ever be repaid…and somebody…maybe everybody…is going to get stuck with the “bill.” As veteran analyst Richard Russell says of a bear market, “He who loses the least wins.” My long term savings remain very conservative and liquid and I’ve also been very cautious lately with my short term trading accounts.

All over Europe right now Banks are going Bankrupt, Governments are flat broke or worse, and currencies are all over the place. Now the US Federal Reserve thinks some US Money Market Funds are so wobbly they are considering limiting the amount of money an investor can withdraw from them.
European institutions are so stricken that currently investors are actually paying a financially secure Germany to take their money. These financial storms in Europe and the US are creating waves that could smash against Canadian shores at any moment, so now might be a good time for an investor to examine their exposure to Money Market Funds. A startling line from a Fed Official in the artice below: “The delay would ensure that redeeming investors remain partially invested in the fund long enough to share in any imminent portfolio losses or costs arising from their redemptions,”
Fed Eyes Limiting Money-Market Fund Withdrawals
NEW YORK–The Federal Reserve Bank of New York said it supports limiting some types of money-market fund withdrawals in a bid to protect those funds from suffering the equivalent of a bank run.
The recommendations came from a staff report released Thursday. New York Fed President William Dudley in a press release accompanying the document said he “strongly” endorses the ideas put forth by authors Patrick McCabe, Marco Cipriani, Michael Holscher and Antoine Martin.
“Further reform of money funds is essential for our nation’s financial stability,” Mr. Dudley said.
The analysts propose that money-market funds could be strengthened if they were to have a “minimum balance at risk.” As envisaged by the authors, this balance “would be a small fraction of each shareholder’s recent balances that would be set aside in the event that they withdrew from the fund,” the press release said.
While regular transactions would be allowed as they are now, this special minimum balance would be locked up for 30 days. “The delay would ensure that redeeming investors remain partially invested in the fund long enough to share in any imminent portfolio losses or costs arising from their redemptions,” the bank explained.
The idea advanced in the New York Fed paper seeks to force investors to be more mindful of what they are doing with money-market fund investments. Many perceive the funds to be a very safe and liquid place to park funds. But that notion was tested during the 2008 financial crisis, and some have worried that in the current environment, money-market funds could be a prime conduit for importing Europe’s ongoing financial crisis to the U.S.
Money-market funds currently hold some $2.7 trillion in assets, according to the paper. They own, as of late 2011, around 40% of all dollar-denominated commercial paper, the New York Fed said.
The report provides fodder for Securities and Exchange Commission Chairman Mary Schapiro as she inches her divided agency toward a vote as early as this summer on a proposal to strengthen money-fund regulations. SEC officials described the New York Fed paper as a “blueprint” for the changes Ms. Schapiro would like to make.
Ms. Schapiro, joined by Federal Reserve and Treasury Department officials, sees money funds as one of the weakest links in the financial system despite reforms adopted two years ago to make the industry more resilient to widespread redemptions. Fund firms and other experts say the cash-like investments rarely run into serious trouble.
To publicly float her proposals, Ms. Schapiro needs “yes” votes from two of her four fellow commissioners. For months, three of the commissioners have said they don’t believe there is sufficient evidence additional money-fund overhauls are needed, effectively blocking the proposals’ advancement.
A number of Fed officials have been anxious about money-market funds for some time. Central bankers see the funds as a prime source of risk in large part because their structure is such that when trouble, or the fear of trouble, arises, investors have every incentive to withdraw all their funds. That can create the equivalent of a bank run.
In congressional testimony Wednesday, Fed Chairman Ben Bernanke said money-market funds are currently a potential source of financial-market instability. He expressed his support of regulators’ attempts to lower the source of risk posed by money funds.
Bottom Line, Canadians Banks are well capitalized, tightly regulated and some of the safest in the world. That said, there is no rule that say’s they can’t reinvest your cash in Banks/Corporations/Government short term paper so they can pay you a small investment return. Suddenly Money Market Funds are riskier when you consider what just happened in, Spain (small savers in Banks are losing billions of Euros), or MF Global which filed for Bankruptcy after investing in European sovereign debt. to counter this risk, this Federal Reserve will simply prevent you from taking all of your cash from a Money Market Fund in one transaction. Oops. A Global “Bank Run” would make it extremely difficult for Money Market Funds to liquidate the short term securities it invests in so that they can pay you back promptly.
In short, no longer assume that you can always get your cash from a Money Market Fund when you want it. Moreover there is the possibility that the “cash” you have in a Money Market Fund could vaporize as it has for so many Spaniards and investors in the Broker/Dealer MF Global.
Things are getting very tough worldwide. Be sure to take the time to check on any cash you have in Money Market Funds.


-
I know Mike is a very solid investor and respect his opinions very much. So if he says pay attention to this or that - I will.
~ Dale G.
-
I've started managing my own investments so view Michael's site as a one-stop shop from which to get information and perspectives.
~ Dave E.
-
Michael offers easy reading, honest, common sense information that anyone can use in a practical manner.
~ der_al.
-
A sane voice in a scrambled investment world.
~ Ed R.
Inside Edge Pro Contributors

Greg Weldon

Josef Schachter

Tyler Bollhorn

Ryan Irvine

Paul Beattie

Martin Straith

Patrick Ceresna

Mark Leibovit

James Thorne

Victor Adair