
Stocks & Equities
|
Put Your Stock Market Shopping List Together Right Now Stocks have gone nowhere over the past year. The S&P 500 closed yesterday just about where it was on July 10, 2011. So buy-and-hold investors have little to show for their efforts. Traders, on the other hand, have had plenty of chances to profit. You just had to pick the right time to buy and have your shopping list ready ahead of time… Last year, for example, we pointed out several buying opportunities here, here, and here. Each of those buy points came on the heels of sharp market selloffs and resulted in immediate 7%-20% gains. But you had to act fast. And you had to be ready BEFORE the market sold off. Now, I’m telling you again – get ready. Stocks are poised for another quick selloff. And if history repeats, any sharp decline in July could lead to a late-summer rally. Take a look at this chart of the S&P 500…
 The blue circles show the similarity between the action over the past month and that of July 2011. The red line marks the key support level at 1,275. At the very least, stocks should come back down and retest the early June low at about 1,275. Right now, it looks like that level will hold, and traders should get ready to buy at 1,275. But it all depends on how a handful of technical indicators look when we get to that point. For example, the McClellan Oscillator – which was overbought last Thursday and hinted at a strong decline – has fallen into neutral territory. Another 50-point drop or so in the S&P 500 should be more than enough to push the Oscillator into “oversold” territory and signal the potential for a rebound. Other indicators show the same thing. But we won’t know for sure until we reach that point. The only thing we do know for sure is last year, the biggest gains from “rebound rallies” happened in the first few days of the rally. Traders who didn’t prepare ahead of time got left behind. Even though the market appears poised for a sharp decline over the next week or two, now is the time to get ready for an imminent rally phase. Don’t buy anything yet – just get your list together. I’ll let you know when I think the time is right to go shopping. Best regards and good trading, Jeff Clark |
|

Quote
“But now something beyond the incompetence of the financial elite and the big banks may be putting capitalism in peril — an unmistakable odor of amorality, sleaziness and corruption.” Pat Buchanan
Of Interest
Europe Accelerates Aid to Spanish Banks (Bloomberg)
China’s Deflationary Threat (Businessweek)
Commentary
Long positions on commodity futures increased the most in two years. As it relates to the managed money category of the Commitment of Traders report, hedge funds decide to pile in during the week ending July 3. Do hedge funds know something we don’t? Or are they just positioning ahead of a third and fourth quarter they expect will be a repeat of 2011 and 2010?
China just announced an unexpected increase in their trade surplus, a result of an unexpected decline in imports. Notable were the declines in commodity imports – especially copper, iron ore, and crude oil. Some might say this decline was seasonal sluggishness. Some might say it was only a matter of time. We think the risk is to the downside unless the Chinese government’s promised infrastructure stimulus projects create notable demand for commodities and raw materials before the year is over. Don’t bet on it – sustained demand from these projects, considering their relatively modest profile, would be quite the feat. Chinese GDP is to be reported on Friday. Expectations are for a print below 8%. Investors have been quick to predict China’s managed slowdown will bottom out in the next few months. That makes sense, considering China’s resiliency over the last two years. But when second quarter results are released Friday, we’re likely to see a sixth consecutive slowdown in China’s growth rate. Chinese officials appear somewhat desperate, considering their surprise rate cuts recently. I’m not too confident Chinese policymakers can have the influence they once had on the economy; there are too many external forces to keep the pressure on China’s economy.
Action
We’ve talked about our expectations for copper to continue its downturn; same goes for crude oil, as we just released a recommendation on DTO last week. But iron ore may be an area of interest – the Market Vectors Steel ETF (SLX) holds shares of key iron ore and steel industry players (though the volume is rather low). Time to sell short SLX as Chinese iron ore imports begin to dissipate?


The media is now fixated on an apparently new feature dominating the economic landscape: a “fiscal cliff” from which the United States will fall in January 2013. They see the danger arising from the simultaneous implementation of the $2 trillion in automatic spending cuts (spread over 10 years) agreed to in last year’s debt ceiling vote and the expiration of the Bush era tax cuts. The economists to whom most reporters listen warn that the combined impact of reduced government spending and higher taxes will slow the “recovery” and perhaps send the economy back into recession. While there is indeed much to worry about in our economy, this particular cliff is not high on the list.
Much of the fear stems from the false premise that government spending generates economic growth. People tend to forget that the government can only get money from taxing, borrowing, or printing. Nothing the government spends comes for free. Money taxed or borrowed is taken out of the private sector, where it could have been used more productively. Printed money merely creates inflation. So the automatic spending cuts, to the extent they are actually allowed to go into effect, will promote economic growth not prevent it. Even most Republicans fall for the canard that spending can help the economy in general. But even those who don’t will surely do everything to avoid the political backlash from citizens on the losing end of any specific cuts.
The only reason the automatic spending cuts exist at all is that Congress lacked the integrity to identify specifics. Rest assured that Congress will likely engineer yet another escape hatch when it finds itself backed into a corner again. Repealing the cuts before they are even implemented will render laughable any subsequent deficit reduction plans. But politicians would always rather face frustration for inaction than outright anger for actual decisions. In truth though, only an extremely small portion of the cuts are scheduled to occur in 2013 anyway. If it comes to pass that Congress cannot even keep its spending cut promises for one year, how can they be expected to do so for ten?
The impact of the expiring Bush era tax cuts is much harder to assess. The adverse effects of the tax hikes could be offset by the benefits of reduced government borrowing (provided that the taxes actually result in increased revenue). But given the negative incentives created by higher marginal tax rates, particularly as they impact savings and capital investment, increased rates may actually result in less revenue, thereby widening the budget deficit.
In reality, the economy will encounter extremely dangerous terrain whether or not Congress figures out a way to wriggle out of the 2013 budgetary straightjacket. The debt burden that the United Stated will face when interest rates rise presents a much larger “fiscal cliff.” Unfortunately, no one is talking about that one.
The current national debt is about $16 trillion (this is just the funded portion…the unfunded liabilities of the Treasury are much, much larger). The only reason the United States is able to service this staggering level of debt is that the currently low interest rate on government debt (now below 2 per cent) keeps debt service payments to a relatively manageable $300 billion per year.
On the current trajectory the national debt will likely hit $20 trillion in a few years. If, by that time interest rates were to return to some semblance of historic normalcy, say 5 per cent, interest payments on the debt would then run $1 trillion per year. This sum could represent almost 40 per cent of total federal revenues in 2012!
In addition to making the debt service unmanageable, higher rates would depress economic activity, thereby slowing tax collection and requiring increased government spending. This would increase the budget deficits further, putting even more upward pressure on interest rates. Higher mortgage rates and increased unemployment will put renewed downward pressure on home prices, perhaps leading to another large wave of foreclosures. My guess is that losses on government insured mortgages alone could add several hundred billion more to annual budget deficits. When all of these factors are taken into account, I believe that annual budget deficits could quickly approach, and exceed $3 trillion. All this could be in the cards if interest rates were to approach a modest five per cent.
If the sheer enormity of the red ink were to finally worry our creditors, five per cent interest rates could quickly rise to ten. At those rates, the annual cost to pay the interest on the national debt could equal all federal tax revenues combined. If that occurs we will have to either slash federal spending across the board (including cuts to politically sensitive entitlements), raise taxes significantly on the poor and middle class (as well as the rich), default on the debt, or hit everyone with the sustained impact of high inflation. Now that’s a real fiscal cliff!
By foolishly borrowing so heavily when interest rates are low our government is driving us toward this cliff with its eyes firmly glued to the rear view mirror. For years I have warned that a financial crisis would be triggered by the popping of the real estate bubble. My warnings were routinely ignored based on the near universal assumption that real estate prices would never fall. My warnings about the real fiscal cliff are also being ignored because of a similarly false premise that interest rates can never rise. However, if history can be a guide, we should view the current period of ultra low rates as the exception rather than the rule.

Gold-stock investors aren’t making any money.
My colleague Frank Curzio explained why last month. The cost of producing an ounce of gold is soaring. The rising prices of heavy equipment, mine infrastructure, roads, labor, electricity, and fuel are all eating into the bottom line.
Major gold miner Barrick Gold, for example, saw its cost of production rise 22% from 2011 to 2012. That’s a huge increase. It’s hurting profits… and it’s hurting shareholders, who are down 20% over the last year.
But not all gold stocks are suffering. A few couldn’t care less about the cost of permits or infrastructure. They’re getting paid regardless. Let me explain…
…..read it all HERE

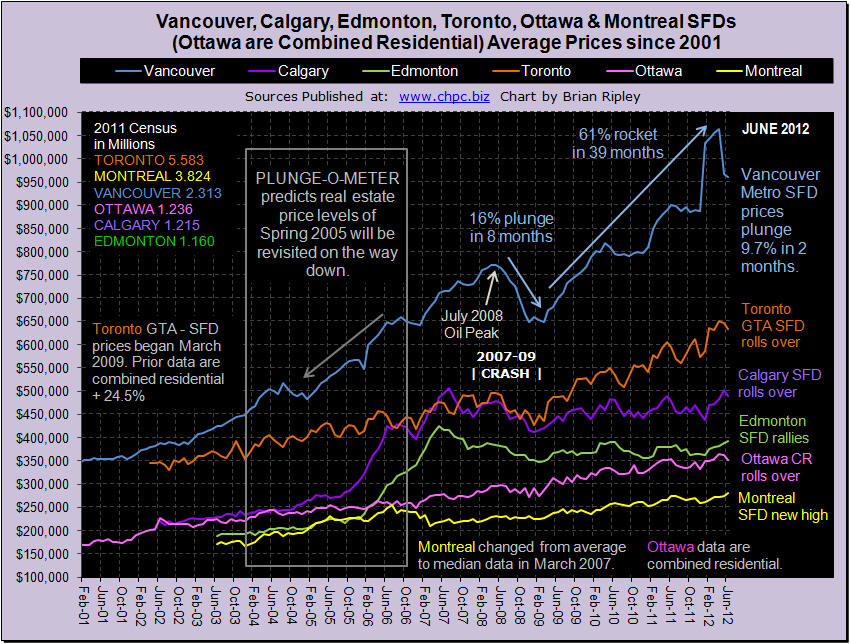
The chart above shows the detached housing prices for Vancouver, Calgary, Edmonton, Toronto, Ottawa* and Montréal (*Ottawa are combined residential). In June 2012 urban flippers met up with huge sales resistance across Canada (Scorecard) with double digit M/M drops of 29% in the Montreal condo market and 28% in Edmonton townhouses. Pricing power has been hit in the hot markets of Vancouver and Toronto (Plunge-O-Meter). SFDs have dropped 9.7% in Vancouver and 2.4% in Toronto in the last 2 months while Montreal SFDs hit a new record high and Edmonton continued their 5 month rally despite news of huge energy production gearing up in the Bakken (U.S.) and the Bazhenov (Russia). The 10yr less the 2yr spread widened by 5 bps against a 36 month trend of narrowing since May 2009; no big deal yet, but the last time this happened, the 10yr less the 2yr spread narrowed from Spring 2004 to Summer 2007 (similar duration as now) which set up the change to widening and the 2007-2009 crash. It’s an interesting comparison, buckle up.
Ed Note: Go to http://www.chpc.biz/charts.html to view individual City Charts


-
I know Mike is a very solid investor and respect his opinions very much. So if he says pay attention to this or that - I will.
~ Dale G.
-
I've started managing my own investments so view Michael's site as a one-stop shop from which to get information and perspectives.
~ Dave E.
-
Michael offers easy reading, honest, common sense information that anyone can use in a practical manner.
~ der_al.
-
A sane voice in a scrambled investment world.
~ Ed R.
Inside Edge Pro Contributors

Greg Weldon

Josef Schachter

Tyler Bollhorn

Ryan Irvine

Paul Beattie

Martin Straith

Patrick Ceresna

Mark Leibovit

James Thorne

Victor Adair