
Timing & trends
North American equity markets are believed to have reached an intermediate low on June 4th. However, macro and micro events (e.g second quarter reports) are expected to dampen enthusiasm for equities until the second half of July. Look for lots of volatility between now and then. This is typical of a market that is developing a base building pattern prior to an important intermediate move on the upside. Now is the time to do your homework on markets and sectors that are top purchase candidates after the base building period is complete.
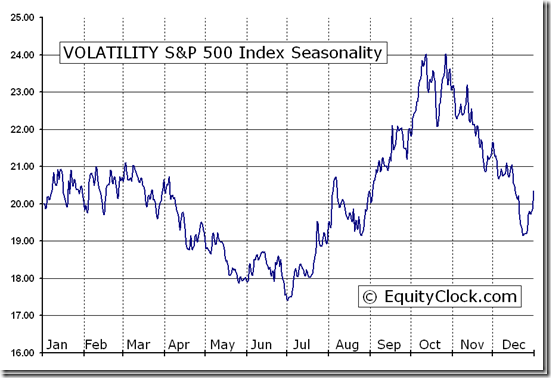
From Equity Clock: Its about to get Interesting – VOLATILITY S&P 500 Index (^VIX) Seasonal Chart
The spectacular response in equity and currency markets to news from Europe on Friday about a possible resolution of Europe’s credit crisis had a significant impact on short term technical indicators. Many markets and sectors at least moved above their 20 day moving average.
Significance of the Eurozone agreement is yet to be revealed. The two page document is the starting point for a plan. The devil is in the details.
Macro events will continue to impact equity markets this week. International events that could impact markets this week include China’s PMI on Sunday night, PMI indices from Switzerland, Italy, France, Germany, the United Kingdom and the Eurozone on Monday, Merkel and Monti meeting on Wednesday and Bank of England and Eurozone central bank interest rate announcements on Thursday.
Intermediate technical indicators improved, but were surprisingly muted. Many equity indices moved to the high end of their recent trading range, but failed to break above those levels. Above these levels lies a band of resistance. Tests of the band of resistance are expected to happen early this week.
Economic news this week is expected to confirm that economic growth in the U.S. continues to slow. The focus is on the employment report on Friday.
Earnings news is not a factor this week. However, the frequency of negative guidance prior to release of second quarter results has escalated and responses to negative guidance has been substantial. Analysts continue to lower consensus second quarter revenue and earnings estimates, sighting slowdowns in Europe and China and the negative impact of currency translation. Despite a year-over-year earnings gain of 33% by Apple, the largest S&P 500 company, S&P 500 companies are expected to report a year-over-year earnings decline of 0.7%.
Seasonal influences early in July are positive during the U.S. Independence day holiday and surrounding days. Main reason for strength is quarter-end money flows and positive anticipation of second quarter results. The former likely will happen, but the latter likely will not.
Cash on the sidelines remains substantial, but is unlikely to be invested until the market determines who will become the next U.S. President.
North American equity markets have a history of moving higher during the second half of a U.S. Presidential election year.
Volumes will be lighter than usual this week due to statutory holidays.
The S&P 500 Index gained 27.14 points (2.03%) last week with all of the gain occurring on Friday. Intermediate trend is down. The Index is testing the top of an eight week trading range between 1,266.74 and 1,363.46. The Index remains above its 20 and 200 day moving averages and moved above its 50 day moving average on Friday. Short term momentum indicators are neutral.

The TSX Composite Index gained 161.02 points (1.41%) last week. Intermediate trend is down. Seven week trading range is between 11,209.55 and 11,824.61. The Index remains below their 50 and 200 day moving averages, but moved above its 20 day moving average on Friday. Short term momentum indicators are neutral. Strength relative to the S&P 500 Index has returned to negative from a brief period at neutral.

Crude Oil gained $4.84 per barrel (6.05%) last week. Intermediate trend is down. Crude remained below its 50 and 200 day moving averages, but moved above its 20 day moving average on Friday. Short term momentum indicators are recovering from oversold levels. Strength relative to the S&P 500 Index is negative, but showing early signs of change.

Gold gained $26.00 per ounce (1.65%) last week. More than the week’s gain was recorded on Friday. Intermediate trend is down. Seven week trading range is between $1,526.70 and $1,642.40. Gold remained below its 200 day moving average and closed just below its 20 and 50 day moving averages. Short term momentum indicators turned upward from oversold levels on Friday. Strength relative to the S&P 500 Index is neutral/slightly positive.

Go HERE for more of Don’s Vialoux’s Monday analysis of 45 Market Charts


As to Europe’s financial troubles, don’t get caught up in the talk that Europe’s leaders are fixing the massive problem. They are not.
Talk of Eurobonds is conditional upon member countries balancing their budgets, which is not likely to happen. It’s also conditional upon member countries effectively giving up their sovereignty, which is also not likely to happen.
While Europe might be able to buy some time, the European sovereign-debt crisis will not die off until the entire euro region comes crumbling down and the euro breaks up — either via Greece, Spain and/or Italy withdrawing, or perhaps Germany taking the lead and calling it quits on the euro down the road.
Either way, I see more trouble ahead for Europe — a lot more.
And that brings me directly to the markets: They are not in good shape.
Gold is threatening to break critical support at the $1,544 to $1,546 level. It remains under pressure due to fear and panic by investors who want almost nothing but cold, hard cash these days and who don’t want to take much market risk at all.
If gold breaks that $1,544 level, look for gold to plunge much lower.
Ditto for silver, which is on the verge of cratering through the $26 level. If that happens, take it as a leading indicator that both the European Union and the United Sates are plunging deeper into a depression.
I say “depression” and not recession because that’s what it is. Most of Europe is definitely in a depression, with unemployment rates that exceed those seen during the 1930s Great Depression.
Here in the United States, we just don’t know it yet. But all the available evidence that I study tells me that the U.S. economy, when measured in terms of honest money, gold, is already in a depression.
Bottom line: Most asset markets will remain under pressure from …
First, fear and panic that Western economies are melting down, leading to “risk-off” trades and a flight of capital into cold, hard cash.
Second, fear and panic that Western leadership is also heading down the wrong path, mandating and taxing things that really belong in the private sector, and in which the government should not be involved.
Third, fear and panic that there’s almost nowhere to hide your wealth these days, unless you can find another planet to put your money.
And more. I don’t like it one bit at all. But that’s the reality we face now, and will be facing for years to come.
When will it all end? When will there be a better day?
Not for a while. And not until the U.S. wakes up and smells the coffee and realizes it will not be immune to a sovereign-debt crisis and that our leaders are also embarking down the wrong path, trying to socially engineer a solution through tax-and-spend measures, through class warfare, and more.
There is a light at the end of the tunnel; however, it’s a few years off. In the meantime, I maintain my views …
1. Keep most of your liquid funds in cash, ready to be deployed on a moment’s notice, but as safe as can be right now. The best way: A short-term Treasury-only fund in the U.S., or equivalent.
2. Hold on to all long-term gold holdings. You do not want to let go of those. Short term, gold is heading lower. Long term, it’s heading to well over $5,000 an ounce.
3. Consider prudent speculative positions to grow your wealth. Like those I have recommended in myReal Wealth Report, which are doing great right now as silver falls, as the euro struggles, and more.
Most importantly, question everything Washington tells you. Only by doing that will you ever come away with an objective view of what’s really going on in our country. Ditto for Europe and its leaders.
Stay tuned and best wishes,
Larry
P.S. My Real Wealth Report subscribers are gearing up for our next online Market Update and Strategy Briefing, which takes place tomorrow, Tuesday, July 3. In this special online presentation, we’ll be looking closely at the markets, what’s coming next and the strategies that make sense right here and now. But you have to be a member to be able to view this exclusive briefing — so //www.gliq.com/cgi-bin/click?weiss_uwd+0109201-1+UWD1092+vgbb@shaw.ca+%20%20%20%20%20%20%20%20++3+4422655++E-Acquisition%20Lead“>click here to start your risk-free Real Wealth Report trial today!

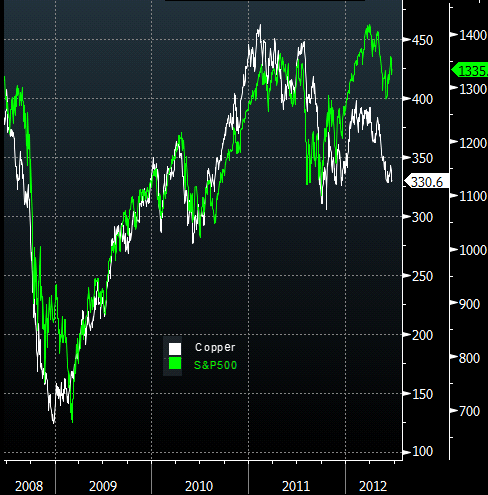
The dislocation between US equities and Brent crude (chart below and discussed there) is by no means unique. A very similar picture is developing between S&P500 and copper. And as with oil, one can blame it on supply fundamentals, but the reality has more to do with a sharp deterioration in global demand as world economies slow.
Miller Tabak : – Traders often refer to the red metal as Dr. Copper because it is the only one that has a PhD in economics, and tends to be a great leading indicator of economic conditions. If you follow that thesis, and go by recent trends, Copper could be telling an ugly story for equities.
…
Copper first bottomed in December 2008, while the S&P waited until March 2009. In 2010, Copper made its low for the year in June, vs. July for the S&P. The 2011 peak in Copper was February, vs. May for the S&P. 2012 is almost identical to last year, with Copper again topping out in Feb., while the S&P made its high in March. There are no guarantees that Copper will make a new low for the year, and even if it does that equities will follow, but it certainly bears watching given the historical significance of the relationship.
The dislocation between US equities and Brent crude (discussed here)
….more articles at Sober Look

It may feel like I’m out of touch with the precious metals markets to broach the subject of a mania today, but I think the table is being set now for a huge move into gold and silver.
There are, however, very valid reasons to reasonably expect a mania in our sector. For one thing, manias have occurred many times before, but the main issue is that a mania in gold and gold stocks is the likely result of the absolute balloon in government debt, deficit spending, and money printing. Saying all that profligacy will go away without inflationary consequences seems naïve or foolish. Inflation may not attract investors to gold and silver as much as force them to it.
Now, one could make the argument that any rush into gold and silver will be muted if no one has any savings, especially given that demographers say a quarter of the developed world will soon be retired. But even if individuals are wiped out, the world’s money supply isn’t getting any smaller, and all that cash has to go somewhere.
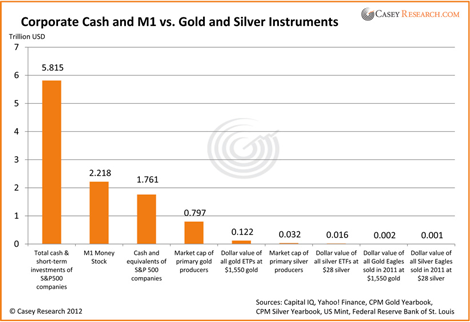
I wanted to look at cash levels among various investor groups to get a feel for what’s out there, as well as how money supply compares to our industry. Data from some institutional investors are hard to come by, but below is a sliver of information about available cash levels. I compared the cash and short-term investments of S&P 500 corporations, along with M1, to gold and silver ETFs, coins, and equities. While the picture might be what you’d expect, the contrast is still rather striking.
Naturally, not all this money or read more about Economic News and Ideas on Debt, the Market, Gold, Oil, and Investing HERE


-
I know Mike is a very solid investor and respect his opinions very much. So if he says pay attention to this or that - I will.
~ Dale G.
-
I've started managing my own investments so view Michael's site as a one-stop shop from which to get information and perspectives.
~ Dave E.
-
Michael offers easy reading, honest, common sense information that anyone can use in a practical manner.
~ der_al.
-
A sane voice in a scrambled investment world.
~ Ed R.
Inside Edge Pro Contributors

Greg Weldon

Josef Schachter

Tyler Bollhorn

Ryan Irvine

Paul Beattie

Martin Straith

Patrick Ceresna

Mark Leibovit

James Thorne

Victor Adair