
Personal Finance

As a follow-up to Michael’s How to Invest Using Options workshop our partners at Disnat have put together some hands-on trading seminars for you. These free one hour sessions will walk you through the steps of buying and selling calls and puts on the Disnat online platform. These seminars are designed to give you the confidence to start using Michael’s strategies in your own portfolio.
Wayne Fredrikson and his team have scheduled two live Lunch & Learn sessions, as well as an easy-to-access online Webinar. Choose whichever format suits you best. We encourage you to use this valuable tool as part of your education about options trading.
To register for the lunch or the webinar please email Daniel Suen at daniel.suen@vmd.desjardins.com or call him direct at 604-678-4983
Lunch & Learn: Max Capacity per session (10)
Disnat offices in Vancouver, Suite 1060 – 401 West Georgia Street
· June 28 (Thursday) 12:00 pm to 1:00 pm
· July 5 (Thursday) 12:00 pm to 1:00 pm
Webinar: How to Execute Mike Campbell’s Strategy with Disnat
· June 28 (Thursday) 6:00 pm to 7:00pm
Please feel free to contact me if you have any questions.
Grant Longhurst
MoneyTalks

Trading volumes in Gold Mining stocks have fallen…and that’s a good thing for what’s coming.

FOUNDER and chairman of Longwave Analytics and Longwave Strategies, Ian Gordon believes we’re on the precipice of very difficult and frightening times and predicts complete financial collapse.
Those periods of darkness though is when Gold Bullion really shines. Gordon, who recently published a special edition of his Investment Insights entitled “The Gold Rush of the 1930s Will Rise Again,” believes that companies with gold in the ground now will be the ones to prosper. In this interview with The Gold Report, Gordon discusses where he thinks the Dow will bottom.
The Gold Report: In a recent edition of Investment Insights, you charted the NYSE Arca Gold BUGS (Basket of Unhedged Gold Stocks) Index (HUI) of senior Gold Mining stocks, gold itself, the TSX Venture Exchange as a proxy for junior mining stocks and one particular gold company from Dec. 29, 2000. All four were equalized to $100 to make the comparison accurate. What did they show?
Ian Gordon: I wanted to look at relative performance since 2000, when gold bottomed out at around $250/ounce (oz)—that was the beginning of the big bull market. The chart shows that the HUI has outperformed all the other benchmarks since 2000. Since then the value of the HUI has increased about 10 times. The second best performer has been gold itself, which has increased about six times. The Venture Exchange has increased just over two times.
TGR: You’ve been monitoring the trading volumes of junior precious metal equities, which are down significantly from levels established in the previous decade.
Ian Gordon: They’re at about 20% of the volumes in 2008 when the Venture Exchange began to perform very well. That performance was enhanced by rising volume. Since its peak, which was in about April 2011 on the Venture Exchange, the volume has been falling quite dramatically, along with price.
I maintain that is actually bullish rather than bearish because normally volume should follow price. What we have here is volume that is not going anywhere near where price is going. Volume has been decreasing in a downward market. People have been moving their money out because they are scared of the risk associated with investing in the junior stocks, but there has been essentially no buying coming into the Venture Exchange to offset the selling.
TGR: You believe we’re now in the winter of the Kondratieff Cycle and that it started in 2000 (http://www.longwavegroup.com/kondratieff-cycle).
Ian Gordon: It’s not that I believe—I’m convinced. We’re in the winter, the deflationary depression stage of the cycle when debt is essentially washed out of the economy. That process is always a very difficult period. This is only the fourth winter in the long wave cycle. The same process of debt deleveraging occurred in all of the previous winters. In 1837, the stock market peaked followed by a crash, which ushered in the winter depression. The same happened after 1873 and 1929. We are enduring the same process again, going through debt elimination, concurrent with the winter of the cycle.
The reason we picked 2000 for the chart is because winters are always signaled by a peak in stock prices concluding the big autumn stock bull market. Some people will say that the Dow Jones Industrial Average actually made a higher high in 2007 and that’s true. However, the speculative end of the market never got anywhere near where it had been in 2000. That’s what happens in the final stage of the big autumn bull market—there’s a massive amount of speculation. In the current cycle, speculation occurred in the NASDAQ. The NASDAQ is absolutely nowhere near where it was at its peak in March 2000.
TGR: Is it typical for junior stocks to perform as well as they did in the winter of the Kondratieff Cycle?
Ian Gordon: I don’t have a record of the actual trading in the junior sector at the beginning of the depression stage following the 1929 stock market peak. All I know is that the money was moving dramatically into the physical metal as well as into the producingGold Mining companies’ shares. What we do know is during the 1930s, huge amounts of capital were employed to fund exploration and build gold mines throughout Canada and the United States. There were many mines developed here in Canada at that time and, according to the US Bureau of Mines, there were 9,000 gold mines operating in the United States in 1940.
There is the example of Homestake Mining. Homestake enjoyed very dramatic moves in its share price in the ’30s even though the Gold Price was fixed at $20.67/oz until 1934, when it increased to $35/oz. Investors were Buying Gold stocks regardless of a massive decline in the Dow, which dropped 90% between 1929 and 1932. Homestake’s share price fell to $65/share during the stock market crash of 1929, but was up to $83/share in 1930 to $138/share in 1931. By 1933, it reached $373/share. During those years the company paid out significant dividends as well.
TGR: The Dow Jones is around 12,500 now. Are you surprised at all that the Dow continues to do as well as it’s doing?
Ian Gordon: I’m pretty sure that the stock market is manipulated by the authorities. I know that people will say that’s just conspiracy nonsense. However, Fed Chairman Ben Bernanke and former Chairman Alan Greenspan both have said they feel that stock prices are extremely important to the confidence of the American people. That confidence leads to confidence in the economy. If stock prices can be held at high levels, people feel wealthy when they look at their mutual fund statements and when they spend money. I don’t believe that this kind of manipulation is sustainable. I’m a big believer that markets follow natural law.
TGR: Once the Federal Reserve loses the ability to prop up the stock market, will we see a collapse and a rush into gold, much as we did in the early 1930s?
Ian Gordon: Yes. I believe that the Dow will bottom at around 1,000 points or less, mirroring the economic depression caused by the debt bubble collapse.
TGR: Allow me for a minute to play devil’s advocate. The investors of the 1930s didn’t have the options that investors now do. There are now currency markets. Investors can put their money in Renminbi, German bonds, Swiss bonds, exchange-traded funds, real estate or other commodities. Why is it going to be gold?
Ian Gordon: Because gold is money. Unlike paper money, there’s no debt attached to gold. The Chinese are Buying Gold. The central banks are Buying Gold. They’re Buying Gold because it’s the money of last resort.
TGR: Do you expect interest rates to go up dramatically?
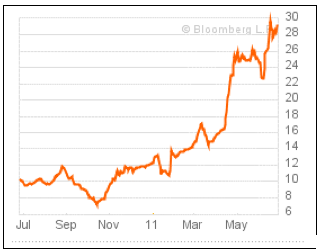
Ian Gordon: Yes. The big debtor nations are having problems with interest rates. Look at Greece. Go to Spain and then Portugal. Interest rates in Spain are over 6%. Italy is getting up over 6%. Imagine what happens to the US if interest rates go to 6%. It’s going to be a massive problem. The whole system is collapsing here. It’s going to be very traumatic. The move to gold is going to be very dramatic as a result. The move for anybody who has gold assets in the ground is going to be very big, as it was in the 1930s.
TGR: You’ve helped raise hundreds of millions of Dollars in equity financings for juniors that you feel are deserving companies. What are some examples of those?
Ian Gordon: Let me tell you what I think a deserving company is, first of all. Deserving companies are well managed with good assets in areas without major political risk.
It’s been much more difficult lately to find companies that you want to get involved with simply because political risk has increased in many parts of the world, Argentina and El Salvador, for example.
TGR: Do you do site visits?
Ian Gordon: I do fewer now than I used to. I’m getting to be 70 years old and I just find that a lot of traveling is a little onerous. I spend a lot of time discussing companies. I often make several calls a week to different companies that I have an interest in.
TGR: You wrote in your paper, “What we must do is hold shares in companies with already good gold in the ground assets, properly managed, and with sufficient cash to last at least another 18 months, even if that means cutting back on planned exploration expenditures.” Does that mean we can expect at least another 18 months of poor performance from junior precious metal equities?
Ian Gordon: I don’t expect that’s going to happen, but I want to be prepared because it might be a difficult period for companies to obtain financing. Things in Europe are going to unravel pretty quickly. I don’t think it’s going to take 18 months for this thing to completely collapse, but it might.
TGR: Do you have some parting thoughts for our readers, Ian, before I let you go?
Ian Gordon: What we face here is something that is actually quite frightening: the breakup of the world monetary system, which is a credit-based system. I don’t know how the economy functions without credit. It’s very difficult and we are facing frightening times. But it’s in these periods of darkness that gold really shines. Gold companies are going to come to the fore, just as they did in the 1930s, particularly the ones such as those that we’ve been discussing today with good gold-in-the-ground assets in politically safe locations.
TGR: Thank you, Ian.
Get physical Gold Bullion at the lowest possible price with BullionVault…

Europe is heading into a full-scale disaster. Even the Dollar Bounces Back, Pessimism Persists in Europe.
You see, the debt problems in Europe are not simply related to Greece. They are SYSTEMIC. The below chart shows the official Debt to GDP ratios for the major players in Europe
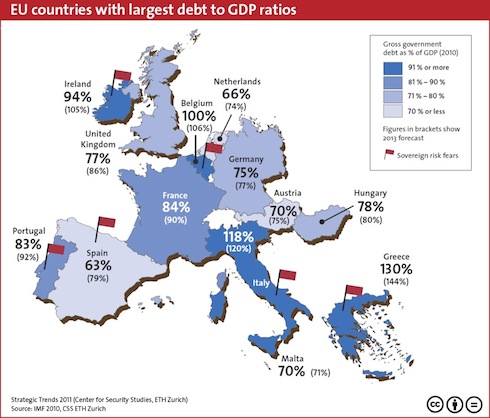
As you can see, even the more “solvent” countries like Germany and France are sporting Debt to GDP ratios of 75% and 84% respectively.
These numbers, while bad, don’t account for unfunded liabilities. And Europe is nothing if not steeped in unfunded liabilities.
Let’s consider Germany. According to Axel Weber, former head of Germany’s Central Bank, Germany is in fact sitting on a REAL Debt to GDP ratio of over 200%. This is Germany… with unfunded liabilities equal to over TWO times its current GDP.
To put the insanity of this into perspective, Weber’s claim is akin to Ben Bernanke going on national TV and saying that the US actually owes more than $30 trillion and that the debt ceiling is in fact a joke.
What’s truly frightening about this is that Weber is most likely being conservativehere. Jagadeesh Gokhale of the Cato Institute published a paper for EuroStat in 2009 claiming Germany’s unfunded liabilities are in fact closer to 418%.
And of course, Germany has yet to recapitalize its banks.
Indeed, by the German Institute for Economic Research’s OWN admission,German banks need 147 billion Euros’ worth of new capital.
To put this number into perspective TOTAL EQUITY at the top three banks in Germany is less than 100 billion Euros.
And this is GERMANY we’re talking about: the supposed rock-solid balance sheet of Europe. How bad do you think the other, less fiscally conservative EU members are?
Think BAD. As in systemic collapse bad.
Indeed, let’s consider TOTAL debt sitting on Financial Institutions’ balance sheets in Europe. The below chart shows this number for financial institutions in several major EU members relative to their country’s 2010 GDP.
| Country | Financial Institutions’ Gross Debt as a % of GDP |
| Portugal |
65% |
| Italy |
99% |
| Ireland |
664% |
| Greece |
21% |
| Spain |
113% |
| UK |
735% |
| France |
148% |
| Germany |
95% |
| EU as a whole |
148% |
Source: IMF
As you can see, financial institutions in Germany, France, Italy, Spain, the UK, and Ireland are all ticking time bombs.
Indeed, taken as a whole, European financial institutions have more debt than Europe’s ENTIRE GDP. Let’s compare the situation there to that in the US banking system.
Taken as a whole, the US banking system is leveraged at 13 to 1. Leverage levels at the TBTFs are much much higher… but when you add them in with the 8,100+ other banks in the US, total US bank leverage is 13 to 1.
The European banking system as a whole is leveraged at nearly twice this at over 26 to 1. That’s the ENTIRE European Banking system leveraged at near Lehman levels (Lehman was 30 to 1 when it collapsed).
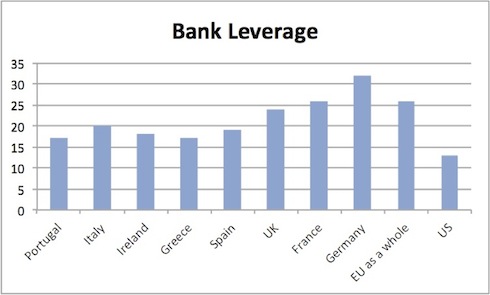
To put this into perspective, with a leverage level of 26 to 1, you only need a 4% drop in asset prices to wipe out ALL capital. What are the odds that European bank assets fall 4% in value in the near future as the PIIGS continue to collapse?
These leverage levels alone position Europe for a full-scale banking collapse on par with Lehman Brothers. Again, I’m talking about Europe’s ENTIRE banking system collapsing.
This is not a question of “if,” it is a question of “when.” And it will very likely happen before the end of 2012.
The reason that this is guaranteed to happen before the end of 2012 is that a HUGE percentage of European bank debt needs to be rolled over by the end of 2012.

I trust at this point you are beginning to see why any expansion of the EFSF or additional European bailouts is ultimately pointless: Europe’s ENTIRE BANKING SYSTEM as a whole is insolvent. Even a 4-10% drop in asset prices would wipe out ALL equity at many European banks.
On that note I believe we have at most a month or two and possibly even as little as a few weeks to prepare for the next round of the EU Crisis.
With that in mind, I’ve begun positioning subscribers of my Private Wealth Advisory for this very possibility. We’ve already locked in over 30 winning trades this year by finding “out of the way” investments few investors know about and timing our positions to benefit from the various developments in Europe. When you combine this with our 2011 track record, we’ve had 66 straight winners and not one closed loser since July 2011.
Indeed, we just locked in two gains of 8% and 10% in less than two weeks’ time.
So if you’re looking for the means of profiting from what’s coming, I highly suggest you consider a subscription to Private Wealth Advisory. I’ve been helping investors navigate risk and profit from the markets for years. I can do the same for you. Indeed, my research has been featured in RollingStone Magazine, The New York Post, CNN Money, the Glenn Beck Show, and more. And my clients include analysts and strategists at many of the largest financial firms in the world.
Indeed, interest is growing to the point that we’re not considering closing the doors on this newsletter and starting a waiting list. So if you’ve been putting off subscribing, you need to get a move on to reserve on of the remaining open slots.
To learn more about Private Wealth Advisory and how it can help you make money in any market…
Best Regards,
Graham Summers
Chief Market Strategist
Phoenix Capital Research

TradersVideoPlaybook.com

a Devaluation hits the employed by effectively cutting their wages…
THE DIFFICULTIES experienced by the US middle classes can be, in my opinion, traced to the delinking of the US Dollar from gold in 1971, writes Nathan Lewis at New World Economics.
Now, I know a lot of people are going to say that is ridiculous. But, one reason I say that is, even by the US government’s own statistics, the income of the median full-time male worker begins to stagnate at exactly that point, after rising by huge amounts during the 1950s and 1960s.
The median US full-time male income was $47,715 in 2010. In 1969, it was $44,455. The 1969 numbers are of course “adjusted for inflation,” and you know that the government’s inflation adjustments are thoroughly low-balled. With slightly more honest statistics, the trend would not be flat, but instead downward over the past forty years.
Another way of looking at it is in terms of ounces of gold. After all, gold was the monetary basis of the United States for 182 years, from 1789 to 1971, so why shouldn’t we use that as a measure of how much people are really getting paid?
Our median worker, in 1969, made $8,668 nominal. But, in those days, the Dollar was worth 1/35th of an ounce of gold. It works out to 248 ounces of gold. In 2010, the Dollar’s value was, on average, about 1/1224th of an ounce of gold, and the full-time male worker was making only 39 ounces of gold. This figure exaggerates the situation somewhat, due to the rapid decline of the Dollar vs. gold in recent years, but it describes, I would say, the economic reality of the situation.
Think of it like this: what if, in year 1, the average Mexican full-time male worker was making 8,668 Pesos per year, and the Peso’s value was one peso per Dollar. The Mexican worker is making the monetary equivalent of $8,448. In year 40, after four decades of “easy money” and currency deterioration, the average Mexican worker is making 47,715 pesos, but the Peso’s value has fallen to 35 pesos per Dollar. We can see that the Mexican worker is making only $1,363, and no amount of government statistical tomfoolery or “purchasing power parity” arguments will change that fundamental fact.
The fact that you can buy an iPad in Mexico City today, while forty years ago you would have to make do with a television set based on vacuum tubes, doesn’t change the fact that the Mexican worker is making less. For some reason, we are able to see these things easily when I take the hypothetical example of a Mexican worker, but Americans are prone to states of denial when asked to consider that maybe a similar thing has been happening to them.
This is why you “can’t devalue yourself to prosperity.” “Prosperity” mostly means higher wages. But, each time you devalue the currency, wages tend to go down in real terms, even if they go up in nominal terms.
The Keynesians are quick to argue that their “easy money” policies will lead to a reduction in unemployment. Sometimes, this works (though not always). It often works because, when wages have been lowered via currency devaluation, then there is more demand for labor due to the lower price. Currency devaluation might help the unemployed, but it hurts the employed – always a much larger number – because their wages have been effectively cut.
Not only do things line up perfectly in terms of timing, but it makes sense on a theoretical basis too, because stagnation and indeed a real decline in wages is exactly the outcome you would expect from a funny-money policy.
However, that is not the only thing that happened to the US middle class in those years. In general, we have a slightly better tax system now than then, at least for upper incomes. I would like to see a much better tax system, more like an 18% flat tax of the sort that Steve Forbes and others have long promoted.
Reducing taxes on upper incomes may make the rich richer. However, I don’t see how they make the middle class poorer – and that is the problem we are talking about here — unless perhaps the tax cuts reduce funding for government services. That has not been the case at all: tax revenue as a percentage of GDP has been about as pancake flat as anything can be for the last sixty years. The variation which does exist (notably the large decline in the last few years) is mostly related to economic performance, not tax policy changes. Government spending as a percentage of GDP is at historic highs today.
However, one thing that has happened over the past forty or sixty years is that taxes on lower incomes have increased. The payroll tax was 3% in 1960, or 6% if you consider both the employer and employee portions. Today, it is 6.2%, or 15.3% taking both sides and also considering Medicare. That’s a big increase.
Sales taxes have risen from an average of 7.0% in 1983 to 9.6% in 2010. Unfortunately, the data becomes murkier going farther back, but it appears that this trend higher in sales taxes has been taking place since the 1950s.
Also, the basic exemption has been driven lower and lower, mostly due to inflationary “bracket creep.” In 1950, a married couple was exempt on its first $1,200 of income. That might not sound like much, but in 1950, per-capita income was about $1,510. In 2010, per-capita income was $40,584, and a married couple was exempt on only the first $11,400 of it.
Overall, we’ve seen a gradual increase in the tax rates on the first $50,0000 of income. Today, for a family of four that makes over $36,900 — not exactly a high hurdle — you’ll be paying 15% on marginal income, plus 15.3% in payroll taxes (directly or indirectly), plus about 10% in sales taxes, plus additional state-level and possibly city-level income taxes, plus property taxes (directly or indirectly), plus additional fees and taxes on your phone, gasoline, and whatnot. A single taxpayer hits this level at $14,650. That is, in my opinion, much too heavy a burden at this income level.
Another theme of the past four decades or so has been “outsourcing,” first to South Koreans or Mexicans, but especially to Chinese or Indians in the past fifteen years or so. The problem is that a huge new supply of labor has been introduced to the world market economy. This tends to favor capital, i.e. business owners, which is one reason why US corporate profit margins have been recently near their highest in decades.
This has been a problem that we have been trying to deal with for literally the entire history of industrial capitalism. In general, I like to think of the “capital:labor ratio.” This is more of an idea than an actual number. All economists agree that rising incomes are basically a reflection of rising productivity. You can’t have it until you make it. Think of a person with “little capital.” We tend to like hole-digging for these examples, so let’s give them a stick. The person can’t dig many holes with a stick. Their productivity is low. Now we give them more capital, such as a hand shovel. Their productivity increases. Now we give them still more capital, in the form of a mechanized backhoe. Their hole-digging abilities take a huge leap skyward. Now we give them a huge amount of capital, in the form of a giant excavator found in some mining operations. Their hole-digging abilities increase again. They have become much more productive.
In practice, “capital” usually doesn’t take the form of these simplistic examples. It could be education, or investment in software research and development, or investment in a high-end hotel resort, instead of these outdated “man with big machine” notions. But, the basic idea still holds: when there is a lot of capital and relatively little labor, then individual wages tend to rise. The investment of a billion Dollars in a high-end hotel resort allows several hundred people to provide high-end hotel resort services, in a similar fashion that investment in a billion Dollars of digging equipment allows several hundred people to provide excavation services.
Although capital does flow internationally somewhat, I find that, in general, places with high levels of capital creation (i.e. a high savings rate and low taxes upon capital and income) also tend to have high levels of domestic investment. China takes all the awards here, as it has a savings rate of about 50%, which is extraordinary. Chinese people are climbing the ladder from stick to shovel to backhoe to giant excavator very quickly as a result. The US has a very low savings rate, commonly under 5%, which contributes greatly, I think, to the capital-starved character of the US economy today.
In short, “labor” has effectively increased dramatically in the US due to “outsourcing,” while “capital” is scarce due to a low savings rate and some of the worst treatment of capital, in terms of taxes, in the developed world.
None of the things that we have enumerated thus far really has much to do with the so-called “1%.” However, particularly in the last few years, the character of US policy has become distinctly corporatist, favoring large-scale theft (“bailouts”) particularly by the financial sector, although also by the defense, education, and healthcare sectors in my opinion. Many corporations have also used their political influence to allow themselves to engage in behavior that is destructive to the middle class, such as predatory or just plain excessive lending, for homes, autos and education, which might otherwise have been curtailed. The US healthcare system has also become effectively predatory upon the middle class, claiming 17% of GDP to provide what costs 5-8% of GDP in other developed countries.
In short, certain businesses are using their influence of the political system to take the government’s money. And, since it is mostly the “99%” who provide this money, via their tax payments, this constitutes theft from the middle class by the oligarchical class. So far, this theft has been financed essentially by debt, so the effect on the middle class has not been felt directly. But, debt will need to be paid, and it is the taxpaying “99%” that will do the paying.
Those four elements – devaluation of wages by currency mismanagement; mediocre tax policy including a gradual increase in tax rates on lower incomes; the deteriorating capital:labor ratio; and crony capitalist theft and predatory activities – constitute the basis for the deterioration of the US middle class today. How could they be resolved?
- A policy of stable money, in practice returning to a gold standard system as was used for most of US history until 1971.
- Major tax reform, including both a reduction in top rates and a dramatic reduction in taxes on lower incomes
- The intent to improve the capital:labor ratio, mostly by way of removing obstacles to capital accumulation, and promoting a much higher savings rate. Note that this is completely contrary to Keynesian notions focusing always on increasing “consumption.”
- Ending all “crony capitalist” payoffs, and regulating corporate activity that tends to be destructive of middle-class welfare.
Unfortunately, we aren’t anywhere near having a rational discussion about any of these topics. Democrats, for the most part, don’t even understand them. Republican thinkers often do understand them, but rarely talk about them as it tends only to result in an explosion of Democratic angst.
I think it would be nice if Republicans could focus their attention a little more on the median and less-than-median workers and families in the US Explain how policies such as the ones above will help them more than any tax-and-spend scheme devised by the Democratic party. Unfortunately, Republicans have made themselves largely unelectable due to the fact that Republican governments tend to forget everything they said in the election, and instead, once in office, embark on an orgy of war, police state expansion, and even bigger payoffs to their crony capitalist buddies.
Perhaps, before this crisis era is through, the US political system will get back on track again. But, in the end, it might be some other country that manages to find the Magic Formula for wealth and prosperity – the kind of wealth and prosperity that “lifts all boats,” as it used to be said.
This article was originally posted at Forbes.
Thinking about a Gold Investment? See how BullionVault makes investing in gold safer, cheaper and easier…


Please Note: All articles published here are to inform your thinking, not lead it. Only you can decide the best place for your money, and any decision you make will put your money at risk. Information or data included here may have already been overtaken by events – and must be verified elsewhere – should you choose to act on it. Please review


-
I know Mike is a very solid investor and respect his opinions very much. So if he says pay attention to this or that - I will.
~ Dale G.
-
I've started managing my own investments so view Michael's site as a one-stop shop from which to get information and perspectives.
~ Dave E.
-
Michael offers easy reading, honest, common sense information that anyone can use in a practical manner.
~ der_al.
-
A sane voice in a scrambled investment world.
~ Ed R.
Inside Edge Pro Contributors

Greg Weldon

Josef Schachter

Tyler Bollhorn

Ryan Irvine

Paul Beattie

Martin Straith

Patrick Ceresna

Mark Leibovit

James Thorne

Victor Adair