
Stocks & Equities
You do not need to be terribly good at reading the tea leaves to spot the alarm calls for next Monday morning. Greece will have its general election result and Egypt may well have elected a member of the Islamic Brotherhood as president.
Call it a double whammy if you like, and it is so obvious that markets are going to anticipate it, then again being confronted with a new reality is never quite the same as expecting it to happen.
New hope or hopeless case?
….read more HERE

OPEC is meeting today (June 14th( in Vienna. And boy, does this group have a lot to talk about.
That’s because the price of U.S.-benchmark West Texas Intermediate crude is down about 25% since hitting a 10-month high of $110.55 a barrel back in March.
That’s a big move in anyone’s book. But I think the price could drop even lower from here.
Part of the reason for that big move down? More supply.
‘A Tremendous Oil Surplus’
According to data from Platts, crude oil production from OPEC rose to 31.75 million barrels per day in May. That’s up 40,000 barrels a day from April; it exceeds OPEC’s own production ceiling by 1.75 million barrels a day, and is the highest level since October 2008.
This occurred even as Iranian supplies were being squeezed by a drop in the number of customers willing to take its oil. Kuwait, Libya and especially Saudi Arabia led production higher.
The Saudis could face pressure from some countries at the Vienna meeting to rein in production. In fact, OPEC president, Abdul-Kareem Luaibi, who also serves as Iraq’s oil minister, told reporters on Monday: “It’s very clear there is a tremendous surplus that has led to this severe decline in prices in a very short timespan. This will not serve anyone.”
So that should put a floor under oil prices, right?
While we could see a bump in the price of crude, the short-term trend for oil prices is actually down. In fact, I wouldn’t be surprised to see crude drop to $70, $65 or even LOWER before the pendulum swings the other way.
Let me give you some reasons why …
#1. Saudi Arabia Could Tell OPEC to Take a Hike.
Recently, Saudi Arabia increased its production to 10 million barrels a day to pick up the slack from sanctions against fellow OPEC member Iran. What’s more, Saudi Oil Minister Ali al-Naimi said the desert kingdom saw increased oil production (and lower prices) as a “stimulus” for the sputtering global economy.
What’s more, Mr. al-Naimi said Saudi Arabia’s analysis “suggests we will need a higher (production) ceiling than currently exists.”
While the Saudis will see how other OPEC members react before formulating a position, Mr. al-Naimi added that his country needs to be allowed to produce more than it currently does. Saudi Arabia says it has spare capacity of another 2.5 million barrels per day.
Is Mr. Luaibi, the oil minister for Iraq, going to tell the Saudis otherwise? Iraq’s oil exports are expected to rise to 2.9 million barrels-per-day next year, from 2.4 million barrels this year. So, Mr. Luaibi might have trouble convincing the Saudis to cut back.
It may all be a wash because Saudi Arabia said it is going into the meeting planning not to ask for OPEC to raise the production level. But that won’t stop it from cheating like a bandit … indeed, any OPEC country that can produce more oil seems to be ready to do so, regardless of quotas.
Also, Saudi Arabia has every incentive to keep prices low enough to discourage a search for alternative fuels and keep demand high for its oil.
Sources say while Iran needs $117 oil to balance its budget, Saudi Arabia is happy with $100 oil. I think the Saudis might be happier with even-lower prices than that, considering that they can pump oil for an estimated cost of $20 per barrel.
Think about it: If the Saudis keep the price of oil low enough, long enough, a lot of expensive deepwater-oil projects will have to be shelved.
Compare their $20-per-barrel cost with North Sea fields that have a marginal cost of about $60 per barrel, while other new deepwater discoveries can cost from $70 to $90 per barrel.
That means more market share for the Saudis, who can ride prices back up again after they put some deepwater competitors out of business.
#2. U.S. Oil Production Soars; Imports Drop.
U.S. oil production has risen 25% since 2008 (an additional 1.6 million barrels per day), and last year, the United States registered the largest increase in oil production of any country outside of OPEC. America’s oil production could increase by 600,000 barrels per day this year.
Hydraulic fracturing has led to a monumental increase in U.S. natural gas and oil production, which will only increase further as the country’s demand for those resources grows.
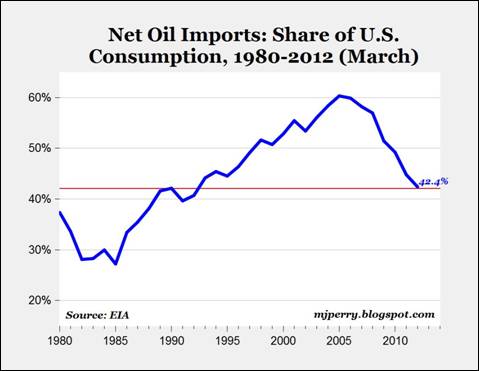
Result: We are becoming more independent of imported oil. Net petroleum imports have fallen from 60% of total consumption in 2005 to 42% today. Here’s a chart I picked up from economics professor Mark J. Perry’s excellent Carpe Diem blog …
What’s more, the composition of our imported oil is changing. The output of Canadian oil sands has tripled since 2000. Not only is Canada a friendly country, but Canada’s production is already hooked into the North American oil grid. So, more production from Canada lowers U.S. oil prices, which already trade at a steep discount to the Brent crude international benchmark.
I’m not saying we’re going to be free of imported oil, or even free of importing oil from countries that hate us. I’m saying that the more independence we get with our energy supply, the better off we are.
Does more oil supply here in the U.S. translate to lower prices at the gas pump? Bet on it! The average price for a gallon of regular gasoline in the United States fell 15.9 cents to $3.624 in the past three weeks.
#3. Global Economic Growth Is Slowing Down.
The debt crisis is just one problem Europe is grappling with. Another is that economies all over Europe are slowing down rapidly, including the engine of Europe, Germany.
This economic slowdown — with a threat of recession — is weighing on oil demand and prices. In fact, Europe’s fuel demand has fallen so fast that nearly a quarter of Europe’s refinery capacity was taken offline in May, as refiners responded to declining demand for gasoline and diesel.
The euro zone accounts for just 12% of global oil demand, or about half as much as the United States. But since oil prices are made on the margins, a euro-zone recession will be a heavy weight on crude.
Meanwhile, in China, imports went up 0.4% in May to a record 6 million barrels, but that’s because China is building up oil stockpiles. In fact, the most bullish news for oil is that China diverted 40 million barrels to its strategic petroleum reserve and could add another 85 to 110 million barrels in the second half of the year.
But China’s economy is hitting the brakes. China’s inflation dipped to a two-year low in May while economic activity remained weak. Steel production fell 2.5% in May compared to April. Iron ore spot import prices fell 8% through most of May. And output of copper fell 1.4% month-on-month, its second-consecutive month of decline.
Here in the U.S., our economy is still growing. But job creation slipped alarmingly in April and May, and manufacturing orders slid lower in the last two months.
I don’t know if we’re going into another recession. In fact, I hope we can avoid it, and one thing that will help us avoid a recession is lower oil prices. But the fear of a recession should be enough to cause traders to make bearish bets on oil prices. And that could send oil prices lower, faster than anyone thinks possible.
OPEC has a poor record of halting such dives. Deutsche Bank data shows that, over the past 20 years, OPEC has slashed production 13 times to try and prop up prices. Three-quarters of the time, the tactic has succeeded within three months. There are three notable exceptions: 1998, 2001 and 2008. In each instance, amid a worldwide economic slump, it took an average of 15 months for the cuts to work.
So oil prices should go lower. Hooray! But don’t get too comfortable …
Why the Drop in Oil Prices Won’t Last Longer-Term
I am expecting oil prices to go down in the short term, but they’ll probably bottom and head higher again by next year at the latest.
For one thing, the election results should clear up the gridlock in Washington one way or another, so we’ll see more economic stimulus. And there will likely be more stimulus in Europe, as well as in China and other countries. That should get the global and U.S. economies firing on all cylinders again.
Another reason — the ramp-up in production from Saudi Arabia is amazing, but advances in technology will only get you so far. You can’t extract an infinite amount of oil from a finite world. So, I expect production in Saudi Arabia to peak either because the Saudis cut to support prices or because aging oil fields simply can’t keep up.
Meanwhile, the marginal cost of oil production, defined as the cost of pumping the last and most expensive barrel required to satisfy demand, is rising as old, cheap oil is pumped and new wells and fields cost much more. If the oil price falls below the marginal cost, there is no incentive to produce more oil. That will remove supply from the global market until prices go higher again.
According to The Wall Street Journal, in 2011, the average marginal cost of oil production was $92.26 a barrel for the 50 largest listed oil and gas companies. And it will reach $100 a barrel next year.
Of course, the best-laid plans of mice and oil men often go awry, so we’ll see what really happens down the road.
4 Ways to Profit from Lower Oil Prices
- For now, you should be hedging bullish positions in oil producers, if you have any. And if you have the stomach for speculation, rallies in oil can be shorted.
- Also, you might want to look at long positions in companies that do very well when oil prices go down — airlines, for example.
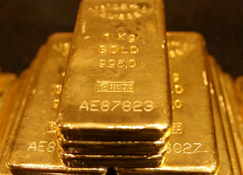
- And you know who is helped by falling oil prices? Gold miners! Fuel costs are a big part of the cost-per ounce, so as oil prices go down, profits go up for well-run miners.
- One more thing to consider — when oil prices do bottom, we should see some really attractive opportunities on the long side in the under-loved energy companies.
All the best,
Sean
P.S. What will come out of OPEC’s meeting? As a member of my Red-Hot Global Resources service,you can be among the first to find out how I’m playing the ebb-and-flow of oil prices. Sign up for your risk-free trial membership today!


China is widely expected to overtake India as the world’s biggest consumer of gold this year with gold purchases rising by 10 per cent, according to the leading Chinese bank ICBC. Why?
The Chinese are moving out of the dollar and into gold. That is what a seemingly ill-educated gold trader in the Sharjah Gold Souk told us earlier this year.
King for a day
You don’t need to be a genius to see the logic behind this move. The dollar might be king today but only against the faltering euro. But what happens when we are reminded that US debts are running at levels comparable with Greece?
As the largest holder of foreign dollar reserves the Chinese are only too painfully aware of how exposed this leaves their savings in a slump. US treasuries are the biggest bubble in history as legendary investment adviser Dr Marc Faber reminded us recently (click here).
Diversification for protection really means something if you have most of your wealth tied up in US t-bonds. And where do you go for safety? Things have already gotten so bad for the Swiss franc that it has become pegged to the euro to stop further appreciation.
Then again if you are Indian and with your money in gold and not rupees then you are laughing. The massive depreciation of the rupee puts gold at a fresh all-time high in rupees, even while it is several hundred dollars off its dollar-denominated high of last September. This experience is not lost on the Chinese.
There are less and less safe haven assets in the world and more and more financial markets are manipulated by central banks because they have control over the supply of paper money. Gold and silver they can suppress through the collusion of the bullion banks but this will not withstand the pressure of massive demand for precious metals as the global economic system cracks up.
Base rate scenario
Imagine what the US economy would look like with the base rate set to Italian levels of six per cent. Asset values from bonds to stocks to real estate would be decimated. A deflationary depression would set in.
And yet nobody currently looks seriously at what is a very obvious future scenario as the artificial supports used to keep the world economy afloat since the global financial crisis begin to fail. The Chinese in buying gold and silver are just peering a bit further into the future and buying insurance against the worst case scenario.
The problem is that a seriously mishandled eurozone sovereign debt crisis may now make this the base case scenario.
About Peter Cooper:
Oxford University educated financial journalist Peter Cooper found himself made redundant by Emap plc in London in the mid-1990s and decided to rebuild his career in Dubai as launch editor of the pioneering magazine Gulf Business. He returned briefly to London in 1999 to complete his first book, a history of the Bovis construction group.
Then in 2000 he went back to Dubai to become an Internet entrepreneur, just as the dot-com market crashed. But he stumbled across the opportunity to become a partner inwww.ameinfo.com, which later became the Middle East’s leading English language business news website.
Over the course of the next seven years he had a ringside seat as editor-in-chief writing about the remarkable transformation of Dubai into a global business and financial hub city. At the same time www.ameinfo.com prospered and was sold in 2006 to Emap plc for $27 million, completing the career circle back to where it began a decade earlier.
He remains a lively commentator and columnist as a freelance journalist based in Dubai and travels extensively each summer with his wife Svetlana. His financial blog www.arabianmoney.net is attracting increasing attention with its focus on investment in gold and silver as a means of prospering during a time of great consumer price inflation and asset price deflation.


-
I know Mike is a very solid investor and respect his opinions very much. So if he says pay attention to this or that - I will.
~ Dale G.
-
I've started managing my own investments so view Michael's site as a one-stop shop from which to get information and perspectives.
~ Dave E.
-
Michael offers easy reading, honest, common sense information that anyone can use in a practical manner.
~ der_al.
-
A sane voice in a scrambled investment world.
~ Ed R.
Inside Edge Pro Contributors

Greg Weldon

Josef Schachter

Tyler Bollhorn

Ryan Irvine

Paul Beattie

Martin Straith

Patrick Ceresna

Mark Leibovit

James Thorne

Victor Adair