
Stocks & Equities
Europe’s dominating the news. But the question is: Will it solve its problems? Based on what the markets are telling me, I don’t think so.
Be sure to check out my latest market update by clicking here now.
Best wishes,
Larry
P.S. Right now, the U.S. is looking relatively good compared to Europe. However, the markets are still in a disinflationary mode, which I’ve been forecasting for you.
Gold: Here’s a new weekly chart of gold. As you can see, gold has broken its major uptrend from the low in 2008 and it’s so far been unable to penetrate back above this uptrend line. We could see a brief rally up to about the $1,700 level, but even that would not turn around gold’s immediate downtrend. It’s far more likely that we’ll continue to see lower lows in gold until there is a coordinated central bank intervention in the sovereign debt crisis. And I don’t see that occurring immediately. Therefore, the bias remains to the downside in gold.
….read more &view all charts at http://www.uncommonwisdomdaily.com/will-europe-solve-its-problems-14408?FIELD9=2
Silver: Here’s my latest updated weekly chart of silver. Here you can see that silver is making lower highs and lower lows. Basically it’s tested the $26 level no less than five times counting the last couple of weeks. That’s usually a sign that it’s breaking down that support floor here and the next test will likely penetrate right through that floorboard and see silver drop substantially lower to at least $23 where I have some system support and probably even lower to $20, perhaps even just below $20, depending on how long it takes for silver’s next leg down to unfold?

The Bottom Line
Look for lots of volatility during a base building period for equity markets lasting until mid-July when difficult second quarter earnings reports are released. Thereafter, intermediate prospects are expected to improve.
Equity Trends
The S&P 500 Index gained 47.52 points (3.73%) last week on lower than recent volume. Intermediate trend is down. Support is forming at 1,266.74 and resistance is forming at 1,334.93. The Index recovered above its 20 and 200 day moving averages, but remains below its 50 day moving average. Short term momentum indicators are trending higher. Stochastics already are overbought, but have yet to show signs of peaking.

Percent of S&P 500 stocks trading above their 50 day moving average increased last week from 12.80% to 30.20%. Percent is trying to recover from a deeply oversold level.

Percent of S&P 500 stocks trading above their 200 day moving average increased last week from 45.60% to 56.80%. Percent has returned to a slightly overbought level.

The ratio of S&P 500 stocks in an uptrend to a downtrend (i.e. the Up/Down ratio) improved last week from 0.40 to (123/292=) 0.42. Thirty S&P 500 stocks broke resistance (notably utility stocks) and 19 stocks broke support.
Bullish Percent Index for S&P 500 stocks increased last week from 47.60% to 48.20% and remained below its 15 day moving average. The Index remains in an intermediate trend down despite strength in the S&P 500 Index last week.

The Up/Down ratio for TSX Composite stocks slipped last week from 0.43 to (66/156=) 0.42. Eleven stocks broke resistance and 12 stocks broke support.
Bullish Percent Index for TSX Composite stocks slipped last week from 46.03% to 45.82%, but managed to move above its 15 day moving average. The Index remains in an intermediate downtrend.

The TSX Composite Index gained 139.43 points (1.23%) last week on lower than recent volume. Intermediate trend is down. Support is forming at 11,209.55 and resistance is forming at 11,727.58. The Index moved above its 20 day moving average, but remains below its 50 and 200 day moving averages. Short term momentum indicators are trending higher. Stochastics already are approaching overbought levels. Strength relative to the S&P 500 Index recently changed from negative.

Percent of TSX stocks trading above their 50 day moving average increased last week from 24.21% to 29.48%. Percent is intermediate oversold and showing early signs of recovery.

Percent of TSX stocks trading above their 200 day moving average increased last week from 28.97% to 33.47%. Percent is intermediate oversold and showing early signs of recovery.

The Dow Jones Industrial Average gained 435.63 points (3.59%) last week. Intermediate trend is down. Support is forming at 12,035.09 and resistance is forming at 12,555.26. The Average recovered to above its 20 and 200 day moving averages, but remains below its 50 day moving average. Short term momentum indicators are trending higher. Stochastics already are overbought, but has yet to show signs of peaking. Strength relative to the S&P 500 Index remains positive.

Bullish Percent Index for Dow Jones Industrial Average stocks increased last week from 63.33% to 66.67% and moved above its 15 day moving average. The Index remains intermediate overbought.

Bullish Percent Index for NASDAQ Composite stocks increased last week from 46.42% to 46.77% and remained below its 15 day moving average. The Index continues to trend down.

The NASDAQ Composite Index gained 110.82 points (4.04%) last week on lower than recent volume. Intermediate trend is down. Support is forming at 2,726.68 and resistance is forming at 2,873.59. The Index recovered above its 20 and 200 day moving average, but remained below its 50 day moving average. Short term momentum indicators are trending up. Stochastics already are approaching overbought levels, but have yet to show signs of peaking. Strength relative to the S&P 500 Index remains negative.

The Russell 2000 Index gained 31.77 points (4.31%) last week. Support is forming at 729.75 and resistance is at 775.65. The Index moved above its 20 and 200 day moving averages, but remained below its 50 day moving average. Short term momentum indicators are trending higher. Strength relative to the S&P 500 Index is neutral/negative.

The Dow Jones Transportation Average gained 150.81 points (3.06%) last week on lower than recent volume. Intermediate trend is down. Support is forming at 4,795.28 and resistance is forming at 5,159.84. The Average recovered to above its 20 and 200 day moving averages, but remains below its 50 day moving average. Short term momentum indicators are trending up. Strength relative to the S&P 500 Index remains positive.

The Australia All Ordinaries Composite Index slipped 4.75 points (0.11%) last week. Intermediate trend is down. The Index remains below its 20, 50 and 200 day moving averages. Short term momentum indicators are trending up. Strength relative to the S&P 500 Index remains neutral.

The Nikkei Average added 19.01 points (0.23%) last week. Intermediate trend is down. Short term momentum indicators are trending higher. The Average remains below its 20, 50 and 200 day moving averages. Strength relative to the S&P 500 Index remains negative.

The Shanghai Composite Index fell 91.99 points (3.88%) last week despite news that the Bank of China reduced its lending rate by 0.25% to 3.25%. Intermediate trend is down. Support is at 2,242.34 and resistance is at 2,478.38. The Index remains below its 20, 50 and 200 day moving averages. Short term momentum indicators are oversold, but have yet to show signs of bottoming. Strength relative to the S&P 500 Index has been positive, but is showing signs of change.

The London FT Index gained 114.22 points (2.15%), the Frankfurt DAX Index fell 133.56 points (2.13%) and the Paris CAC Index added 34.68 points (1.15%) last week.


The Athens Index fell another 9.21 points (1.84%) last week. Intermediate trend is down. The Index remains below its 20, 50 and 200 day moving averages. Short term momentum indicators are oversold, but have yet to show signs of bottoming. Strength relative to the S&P 500 Index remains negative.

…. More on Currencies,Gold, Commodities http://www.timingthemarket.ca/techtalk/2012/06/11/tech-talk-for-monday-june-11th-2012/

Investors barely care if growth is real or not…
WE YEARN for clarity. For a day of reckoning. But it seems far in the future. Yesterday, the world waited for Mr. Bernanke to reveal his intentions. Instead, he said he was keeping his options open, writes Bill Bonner for the Daily Reckoning.
That was good enough to keep some steam in the stock market. But not enough to keep Gold Prices going up.
Both gold bugs and stock market bulls are counting on the Fed to come through. And it probably will.
We saw yesterday how the 1% got to be so rich. The feds — aided and abetted by consumers and the financial industry — bubbled up the amount of cash and credit in the US by 50 times in the last 50 years.
“That explosion of credit changed the world,” writes Richard Duncan in his new book, The New Depression.
Yep…for one thing it made the rich richer. That money didn’t go to wage earners. It went into stocks and bonds — the assets owned by the 1%.
The stock market began its epic march up the mountain in 1982. Since then, it’s gone up 13 times (as measured by the Dow).
US GDP is up about 13 times too.
But much of the “growth” in stocks and GDP in this period was phony. The tape measure, used to track growth, was calibrated in Dollars. And the Dollars — stretched by the feds — lied.
Just look at what has happened in the last ten years. From its low in the early 2000s, stocks are up about 50%. Investors might think they are ahead of the game.
But measure that increase in terms of gold…and the gains disappear. Instead, stocks are DOWN 16%. In terms of oil, stocks are down even more — 43%.
And now the feds tell us the economy is in ‘recovery.’ Yes, they admit, it’s not a great recovery. But the economy is growing. And if we wait long enough everything will be put right.
Oh yeah? At this rate the US will never reach full employment. Because, each month, more people are looking for work than finding it. Why? Because little of this ‘growth’ is real. It’s just what you get when you put an extra $2 trillion of cash and credit into the system.
But investors don’t seem to care whether the growth is real or not. Instead, they’re waitin’…prayin’…hopin’ for another round of MONEY! They want that old elixir…more cash and credit…that Miracle-Gro that the feds use to turn the economy green.
Oh yes, dear reader, we are five years into the Great Correction crisis…and once again, the world (and especially Barack Obama) turns its weary eyes to Dr. Bernanke.
“Touch us…heal us… Take away our pains. Lift us up to paradise.”
Or, at least put us back in the White House!
And word on the street is that Ben Bernanke is getting ready.
“Fed considers more action…” says The Wall Street Journal.
“Stocks rise on hopes of more stimulus,” reports The Financial Times.
But not all the Fed team is on the same page. Richard Fisher, of the Fed bank of Dallas, is clearly not:
“I believe that were we to go down the path to further accommodation at this juncture, we would not simply be pushing on a string but would be viewed as accomplice to the mischief that has become synonymous with Washington.”
Our guess is that Mr. Fisher will be left behind. If not now…later.
Matthew O’Brien, writing in The Atlantic, explains why.
Save Us, Ben Bernanke, You’re Our Only Hope
By Matthew O’Brien
This may not be our darkest hour, but the disappointing May jobs report showed the US economy once again slowing towards stall speed. It’s not just the anemic 69,000 jobs the economy added last month. More disconcerting were the sharp downward revisions to previous months. It looks like we could be in for an unwelcome rerun of the summer doldrums we have gotten to know all too well in 2010 and 2011.
Markets have a bad feeling about this. It isn’t just about the deteriorating US outlook. Europe and China are turning to the dark side of growth too. The Euro is continuing its game of Schrödinger’s currency: At any moment it is both saved and doomed. Right now, it’s looking more and more doomed. Then there’s the slowdown in China — along with India and Brazil. These economies powered global growth during the dark days of 2008 and 2009, but seem certifiably wobbly now.
The Fed is our last hope — and there isn’t another. Republicans in Congress continue to block further fiscal stimulus, despite historically low borrowing costs and a clear need for better infrastructure. So that leaves Ben Bernanke & Co. as the last and only line of defense.
Will the Fed be an accomplice to Washington’s mischief? You bet. Because this is an economy that has depended on more cash and credit for at least 30 years. It can’t stop now.
Here’s another Fed governor, more in sync with the times. The Wall Street Journal has the report:
The Federal Reserve must stand ready to do more if the US growth outlook worsens, a top central banker said Wednesday.
If the outlook deteriorates such that the unemployment rate doesn’t fall to levels consistent with the central bank’s mandate and if the medium-term outlook for inflation falls significantly below the Fed’s 2% target, “then additional monetary accommodation would be warranted,” John Williams, president of the Federal Reserve Bank of San Francisco, said in prepared remarks to Seattle-area community leaders in Bellevue, Wash.
Mr. Williams is a voting member of the policy-setting Federal Open Market Committee.
You heard it here first, dear reader: There’s no reverse gear in this car. It won’t back up to correct its mistakes. Instead, it races along until it hits a brick wall.
Buying Gold? Get the safest gold at the lowest prices at BullionVault…


Unemployment Rate in Canada Stays Flat in May; Europe Continues to Add to Global Uncertainty
The S&P TSX Composite closed at 11,500.63, up 1.23% for the week, but down 3.8% since the start of the year and uncomfortably close to 2012 lows.
Canadian employment numbers came in on Friday slightly above expectation with 7,700 new jobs being created during the month of May. Consensus estimates for the month were for 5,000 new jobs. The numbers, while a little higher than expected, essentially put an end to the strong month-over-month momentum we have seen March. Collectively, March and April brought with them 140,000 new jobs; a 30 year record for Canada’s economy. Although the prudent minded knew to look at the numbers with caution, there were, not surprisingly, many optimists that hoped the performance was the start of a new trend. Clearly they were disappointed by the May numbers. Overall the Canadian unemployment rate remained flat at 7.3%.
While we continue to see mixed data in North America, the situation in Europe is nothing less than clear. The continent continues to struggle with an unyielding debt problem which many fear is spilling over into the global marketplace. After rallying at the start of the year, nearly all major global stock markets are now either down or flat. Although Greece remains firmly in the spotlight, Spain has moved a few steps up the ladder to release its financial woes upon the world. Spanish banks have come under serious pressure which has caused economists and analysts to predict that the country will formerly request an EU bailout on Saturday, making it the fourth nation in Europe to do so. The International Monetary Fund is currently in the process of conducting an audit on how much money Spain would require (due out Monday) with preliminary estimates at €50 to €60 billion and potentially higher. Not surprisingly, ratings agency Fitch announced on Thursday that it was reducing Spain’s credit rating by three notches on from A to BBB. This rating is now only one notch above junk status.
The situation with the PIGS (Portugal, Italy, Greece, and Spain) is analogous to what happens to an individual person that takes on too much debt. As an individual’s debt continues to grow, and their ability to pay that debt declines, naturally creditors will require a higher interest rate to compensate them for the additional risk. But at some point, creditors will just stop lending the money regardless of the rate that the debtor is willing to pay. This is true unless of course someone with a better credit rating and balance sheet agrees to co-sign the loans. In the case of Europe, this reluctantly generous co-signer is of course Germany. But Germany’s graciousness is not without a self-serving purpose as they stand to benefit more than anyone by the preservation of the Euro.
In the pre-Euro area, each of the debtor nations would simply allow their currency to de-value which would have the natural effect of lowering their respective debt burdens in real purchasing power terms. Although this is quite painful in the short term, it has historically been the only way to sort these issues out, as was the case with Argentina’s debt crisis in 1999 – 2002. The short-term pain was intense, but Argentina did recover and now enjoys one of the highest economic growth rates in Latin America.

![]()
Here is a video link to an interview that I did at the World Resource Investment Conference last week, click here to watch on YouTube.
Trading is simple, but not easy. Despite its simplicity, most people who try to trade have a hard time finding consistent profitability. Trading well is as much about doing certain things right as it is about avoiding the common mistakes. Here is a list of the common causes of trader failure.
1. Lack of Knowledge
Trading does not have to be complex or involve a sophisticated understanding of capital markets. In one day, I can teach a person the skills that I use as a trader. However, like riding a bicycle, being good at applying those skills takes practice and usually involves some painful mistakes through the learning process. You probably were pretty wobbly the first time you pedaled a bicycle but, with time, you found your balance and got good at it. Trading is no different.
However, unlike riding a bike, there are thousands of ways to trade. You have a choice in what you trade, the hold period for your trades and the strategies you apply.
There are many options for people looking to learn trading. You can take classes, study online, read books or try to figure it out on your own. Each approach to learning has a cost; don’t underestimate the price for how you intend to learn.
With so many approaches to acquiring the knowledge you need to trade, there is not necessarily just right and wrong ways to learn. It becomes a question of what is right for you, what best fits your learning style. What is most important is that you get educated before you risk a penny of your money in the market. Most people can’t beat the market because they don’t know what they are doing. Don’t let a lack of knowledge ensure your failure.
2. Poor Risk Management
The focuses for most aspiring traders are the decisions to enter and exit the trade. They spend a lot of time trying to find the right stock to buy and then try to make a good decision on when to enter. They miss out on the most important component of the trading process.
Risk management is that often forgotten piece of the trading puzzle. Without capital to trade with, you have nothing to do. Protect your capital first and never try to get rich overnight. Some might get lucky in the short term but those who fail to manage risk over the longer term will go broke. That is guaranteed.
For every trade, you need to know your downside. Being wrong is part of trading so you must have a plan for what to do when you are wrong.
3. Insufficient Capital
Since being wrong is part of a profitable trading strategy, you need to allow for drawdowns of your capital base. There will be times when market conditions will not be great for the strategies you are applying.
When planning your trading business, you must allow for this potential deterioration of capital. You may make five steps backward before you start to go forward, make sure you have the capital to ride out these losing periods.
4. Trading Without Proven Strategies
I have seen a lot of people trade without a strategy that they have tested. They think that they can beat the market by doing things that make sense. This is often the biggest problem with people who are successful in other areas of life.
It is a bad idea to think that you can beat the market by being smart. The markets rarely do what makes sense, at least in the context of the information that we have. This is because the market often moves on information that most of us just don’t have.
For that reason, it is smart to have a set of trading rules that you first test exhaustively before you trade. Your testing must determine whether the rules yield a positive expected value. Over a large number of trades, your rules should make a profit. What happens on any individual trade really does not matter.
5. Failure to Follow Rules
The rules you define and test are only effective if you follow them. While this is easy for all of us to understand, it is a very hard thing to actually do. We break rules because we are afraid of losing money. Emotion is a hard thing to overcome.
To minimize the impact of emotion requires a comfort with the risk you are taking. Most traders find that paper trading, simulated trading without using real money, is not too hard. It is only when they have their capital at risk that they start to make mistakes.
The solution to this problem is to not take more risk than you are comfortable with. The best traders are those who don’t care about the money. The more you can do to take out emotion, the better your chances will be to follow the trading rules.
6. Lack of Determination
Doing anything well requires the determination to learn and gain expertise. This is very much the case for trading because it is such an emotional pursuit. There will be times when the novice trader will feel overwhelmed with emotion and ready to give up.
I don’t think trading is something that can be done well by someone who does not like it. Having a passion for trading is what will get you through the hard times and ensure that you stick with it when your heart may tell you otherwise.
7. Poor Focus
The shorter the time frame you trade, the more focused you need to be. Position trading (hold period measured in weeks or months) is not that demanding mentally because you have a lot of time to make your trading decisions. Swing trading (hold period measured in days) requires you make quicker decisions but is not as demanding as day trading. The day trader (hold periods measured in hours or minutes) has to make decisions in only seconds and work hard to not miss out on good trading opportunities.
It is hard to trade if you have a lot of distractions while you are trading. You have to do what is necessary to avoid letting outside factors have an effect on your trading decisions.
8. Inability to Adapt
The market is constantly changing and you need to be able to adapt with it. That means applying trading strategies that are appropriate for the present conditions; you may not want to apply a buying strategy in a market with strong downward momentum.
Avoiding chasing the market with your rules is a challenge that many traders have trouble with. You should have a set of trading principles that do not change over time, these based on source of opportunity that you are pursuing. Do not constantly change the rules of your tested and proven strategies.
However, how and when you apply your strategies will change as the market evolves. I keep a stable of trading strategies that I apply as conditions warrant.
![]()
Markets took a step in the right direction this week with the bounce back that I was expecting. The indexes have not overcome the pessimism yet but could do so soon, watch for a break of the downward trend line on the major stock market indexes. In the mean time, there are a few stocks able to do well despite the market weakness. This week, I ran the Stockscores Simple strategy Market Scan and found a few stocks with decent charts. Here they are with my comments:
![]()
1. DRAD
DRAD made an abnormal up break with abnormal volume on Friday, taking it through resistance from a rising bottom. Good potential provided it does not pull back to close below support at $2.16.

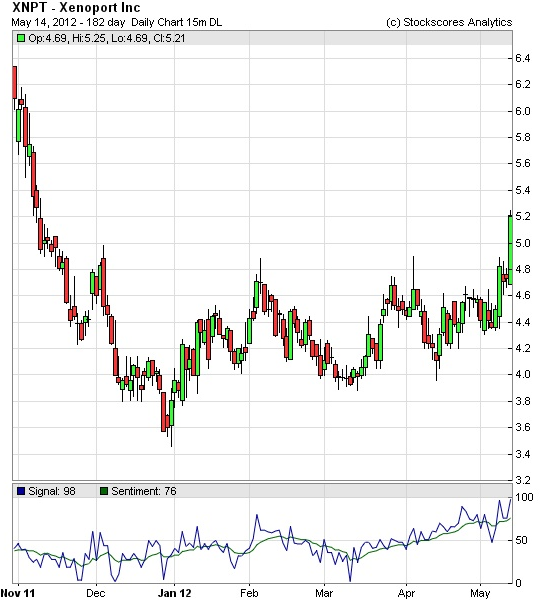
2. UNIS
A good ascending triangle break on UNIS Friday with abnormal volume supporting the break. The reward for risk will improve with a pull back. The stock is breaking its long term downward trend, a good sign for a turnaround. Support at $3.95.

3. TCAP
A nice weekly chart breakout from a cup and handle pattern on TCAP as the stock moves to five year highs after sitting under $20 resistance for over a year. Support at $19.75.
References
- Get the Stockscore on any of over 20,000 North American stocks.
- Background on the theories used by Stockscores.
- Strategies that can help you find new opportunities.
- Scan the market using extensive filter criteria.
- Build a portfolio of stocks and view a slide show of their charts.
- See which sectors are leading the market, and their components.
Disclaimer
This is not an investment advisory, and should not be used to make investment decisions. Information in Stockscores Perspectives is often opinionated and should be considered for information purposes only. No stock exchange anywhere has approved or disapproved of the information contained herein. There is no express or implied solicitation to buy or sell securities. The writers and editors of Perspectives may have positions in the stocks discussed above and may trade in the stocks mentioned. Don’t consider buying or selling any stock without conducting your own due diligence.


-
I know Mike is a very solid investor and respect his opinions very much. So if he says pay attention to this or that - I will.
~ Dale G.
-
I've started managing my own investments so view Michael's site as a one-stop shop from which to get information and perspectives.
~ Dave E.
-
Michael offers easy reading, honest, common sense information that anyone can use in a practical manner.
~ der_al.
-
A sane voice in a scrambled investment world.
~ Ed R.
Inside Edge Pro Contributors

Greg Weldon

Josef Schachter

Tyler Bollhorn

Ryan Irvine

Paul Beattie

Martin Straith

Patrick Ceresna

Mark Leibovit

James Thorne

Victor Adair