
Bonds & Interest Rates
|
These Stocks Yield Up to 13.5%… But I Doubt You Know About Them |
|
My husband Melvin and I bought our first home when we were expecting our first child. After an exhaustive search, we settled on an up-and-down duplex. It was built in the 1940s and had a rental suite in the basement. The purchase was a good decision from a financial standpoint. Rental payments covered a substantial part of our mortgage, and about two years later we were able to sell it for 20% more than we paid. But from a lifestyle perspective, it was not ideal. First, the rental suite’s bathroom faucet started leaking. Then ceiling tiles came tumbling down. Soon the rent was a week overdue and counting. There was always something. I learned some important lessons from that experience. First, carefully selected real estate could be highly profitable. Second, I didn’t want to deal with the upkeep required by rental properties. Thankfully, there are real estate investment trusts (REITs). As an income investor, you likely know plenty about these securities. REITs own leased property, letting investors own a diversified portfolio of properties and letting someone else look after the hassles of managing them. As one of my first picks for my premium High-Yield Investing advisory, I added shopping center REIT Simon Property Group (SPG) at $53.00 per share in August 2004. I sold it nearly three years later at $94.95, after collecting $9.06 per share in distributions, for a total return of 96%. Equity Inns (NYSE: ENN), a lodging REIT added shortly after in January 2005, did even better. Total returns were 118% in just under three years. Sun Communities (NYSE: SUI), which runs manufactured home communities, was added in October 2010 and so far has provided total returns of about 40% in just over a year and a half. You can see why I like REITs. There’s just one problem. U.S. REITs have been sharply bid up since the spring 2009 bottom. As a result, their yields, which move inversely to prices, have come down. U.S. equity (non-mortgage) REITs are yielding an average 3.4%, according to the benchmark MSCI U.S. REIT index. The solution? Canadian REITs. You may not have heard of them, but Canadian REITs (CanREITs) are similar in many ways to their U.S. counterparts. As in the United States, to qualify as a REIT in Canada at least 75% of revenues must come from rental income. CanREITs also pay out most of their taxable income to avoid paying corporate taxes and maintain their REIT status. Better yet, while most U.S. REITs pay dividends quarterly, most CanREITs pay monthly. One difference between the two is that most U.S. REITs are corporations, but CanREITs are generally unincorporated investment trusts. That means, in case of bankruptcy, unitholders would be responsible for the REIT’s liabilities. However, CanREITs typically guard against this possibility by purchasing insurance and excluding unitholders from liability in their loan contracts wherever possible. The biggest difference, though, is their size. In the United States, you can choose among dozens of large capitalization REITs. Simon Property Group (NYSE: SPG), for example, has a market cap of around $45 billion. In Canada, the selection is more limited. The largest REIT by market cap is RioCan (TSX: REI.UN; OTC: RIOCF), a shopping center developer with a market cap of $7 billion. Only 16 CanREITS have market caps over $1 billion.
But at this point, many Canadian REITs are yielding higher than their U.S. counterparts. The average Canadian REIT pays a 5.0% yield, compared to 3.4% for U.S. REITs. This includes Canada’s Scott’s REIT (TSX: SRQ.UN; OTC: SOREF), which owns buildings leased to KFC, Taco Bell, Subway, and Shell gas stations, among others. Right now the shares yield more than 13.5%. Meanwhile, Canada has a healthy housing market, strong banks, and effective government policy that underlie a healthy business environment. As measured by the S&P Case-Shiller U.S. Home Price Index, housing prices in the U.S. have declined 26% as of the end of 2011. In contrast, housing prices across Canada actuallyincreased 17% during that period, as measured by Canada’s National Bank Home Price Index Composite. Of course, the key to successful REIT investing is selecting the specific property sector most likely to benefit from the current economic environment. There’s no guarantee, but in my view the two strongest Canadian REIT sub-sectors right now are office space and apartments. In many Canadian cities, the going market rate for office rents is now higher than lease rates. When these leases expire, therefore, rents should rise, driving REIT cash flow higher and potentially boosting distributions for office REITs. Meanwhile, there’s a lack of new multi-family supply in Canada. Consistent and stable demand is based on population growth and the housing needs of new immigrants. Proposed legislation to make underwriting standards harder for first-time home buyers may also lead to more people remaining as renters. One more thing… You might think it’s difficult to buy Canadian stocks. However, the vast majority of large-cap Canadian REITs are inter-listed and trade on an over-the-counter (OTC) exchange in the United States. Many U.S. brokers, such as T.D. Ameritrade and Interactive Brokers, provide easy online access to the Toronto exchange, but some brokers may require you to place a phone order. You can also trade Canadian REITs over the counter in the United States, but liquidity is more limited than if you trade directly on the Toronto exchange. Good Investing!
P.S. — If you haven’t already seen it, don’t miss StreetAuthority’s report — Top 5 Income Stocks for 2012. These five select investments pay dividend yields of 7.5%… 8.8%… even 11.5%. For more details on these investments you can visit this link. Disclosure: StreetAuthority owns SUI as part of High-Yield Investing’s model portfolio. In accordance with company policies, StreetAuthority always provides readers with at least 48 hours advance notice before buying or selling any securities in any “real money” model portfolio. Members of our staff are restricted from buying or selling any securities for two weeks after being featured in our advisories or on our website, as monitored by our compliance officer. |

The Energy Report: Since we last talked in November, oil went from $90-110 per barrel (bbl). Has it established a floor that will stick? Or, as Porter Stansberry predicted during the summit, is it getting ready to crash? He said that the same sort of technology that brought on the glut of natural gas will lead to an abundance of oil that will depress prices.
Marin Katusa: Porter was basing his comments on the success of shale gas in North America, and with that you have natural gas liquids and some oil. In North America, gas became a victim of its own success, worsened by a warmer-than-expected winter. But understand that gas, in general, has very localized markets.
When it comes to the oil sector, people think Exxon Mobil Corp. (XOM:NYSE), Royal Dutch Shell Plc (RDS.A:NYSE; RDS.B:NYSE) and ConocoPhillips (COP:NYSE) are the biggest players. The big players are actually the national oil companies (NOCs)—Saudi Aramco, Petróleos Mexicanos (Pemex) and Petróleos de Venezuela, which are not reinvesting in operations and exploration. Their production is decreasing as a result. Cantarell, in Mexico, is one of the greatest oilfields in the world, but it’s decreasing by 3.5% every year. The NOCs are distributing profits to fund massive social programs. For instance, more than 55% of Venezuela profits from oil-funded social programs.
By the way, America imports more than a million barrels of Venezuelan oil each day and pays a premium over what it pays for domestic oil. But that’s another story.
I don’t necessarily agree that the same reasons North American natural gas went under $2 per thousand cubic feet ($2/Mcf) would apply globally. India and Japan are signing $14–15+/Mcf. It’s twice that in Europe. North America is a unique case; the rest of the world is nowhere near that when it comes to shale exploration.
TER: Will that change when the U.S. starts exporting in 2015 or so?
MK: I think 2015 is a very aggressive timeline. Eventually, the market will fix itself. But to say that oil will go to $40/bbl by Christmas? I wouldn’t take that bet. That said, for two years we’ve been using $60/bbl oil for our equations. We publish the best netbacks in the business every quarter. So if a company can make money at $65/bbl oil, it will make a lot of money at $105/bbl oil. But if you invest in companies that need $90/bbl oil to break even, you’re not going to do so well.
TER: You said the market will fix itself. Will oil go down to, say, that $60/bbl you’ve been using?
MK: Buyers are not paying producers $103-105/bbl. Because of the massive differential for selling less, the Canadian oil sands producers are selling as low as $63/bbl. In the Bakken, they’re selling for $72/bbl. So it finds its equilibrium. In the Canadian oil sands, existing production can be profitable at $60/bbl, which we’ve been saying for a couple of years. New production, if it’s open pit, it needs $90/bbl oil to be economic due to the massive inflation in equipment, trucks, tires and skilled workers.
TER: Why do we quote oil at $105/bbl if it costs $63–72/bbl?
MK: A lot of people think that Suncor Energy Inc. (SU:TSX; SU:NYSE) or any given oil producer is making $105/bbl for oil, but companies are selling their product for $63/bbl. It depends on the differential and Suncor’s selling price versus the West Texas Intermediate (WTI) crude oil price, which is the posted price. Gas producers in Edmonton are getting much lower prices than what’s quoted in the Henry Hub. The oil price in North America or the Brent price isn’t necessarily the same price a company is selling its oil for.
Rick Rule: It’s pretty complex. What people think of as the posted crude oil price comes from either WTI or Brent. That used to be the way the world worked, but we have localized differentials now. One of the differentials that Marin was speaking about is the differential between light sweet crude and heavy crude. And the differentials widen and tighten depending on a variety of factors.
For example, production efficiency in Venezuela, the traditional source of Gulf Coast sour crudes, is a factor. Transportation and infrastructure bottlenecks are factors. We’re now to the point where a critical pipeline that once transported crude from the Gulf Coast to the U.S. Midwest has been reversed because of production declines in Mexico and Venezuela, which in turn encourages U.S. Gulf Coast refiners to take heavy crude out of Canada.
All of this is what creates localized markets in oil. The international light sweet crude markets are very stout. Nigerian bonny crude and Brent crude’s international trade is marked by tightness as a consequence of declining supplies in traditional frontier market exporters, such as Nigeria as well as Venezuela and Mexico.
The North American domestic market is ironically awash in oil as a consequence of three factors: The high price of gasoline has begun to destroy demand along with the weak economy. The incredible de-bottlenecking that’s gone on in the Athabasca tar sands has doubled tar sands production in four years. And the conjunction of technologies that Marin was talking about has produced a flood of shale oil, particularly in the Bakken.
….read more HERE

![]()
The easiest way to make money is to trade the hot market. This rule applies to stocks, commodities, currencies, real estate, collectibles – anything that is traded between people. To put your odds for success at their highest, you have to trade where the action is.
Think back to when you had your best success. Perhaps you made great profits trading Silver stocks a few years ago. Maybe you made a fortune flipping houses 7 years ago. It is possible that many of you banked cash by shorting stocks or buying volatility last summer. No matter when or where it happened, your best and most memorable success likely came when there was a boom in the market you were trading. You rode a strong trend.
If you revisit any of those trades, trying to re-live the feeling of easy money, you have probably felt frustrated. Formerly hot markets are not much fun when they have gone cold. How does it feel to trade Silver stocks now or to own a number of homes that you cannot sell? Lousy!
Assets are worth owning when their price is going up. This seems obvious but it is amazing how many investors I meet who own stocks because they were going up in the past, not because they are going up now. There are a lot of investors living in the past.
We have to live in the now but how do we know where the next hot trend will be? How can we find the hot market today?
I often talk about how I never know anything about the companies that I trade, that I only trade symbols, but that is a little bit of hyperbole. I do have an awareness of the types of companies that I trade; I want to know enough to be able to see trends in capital flows.
Each day, I do a Market Scan on Stockscores to see which stocks have moved up more than expected. This tool has a filter for Abnormal Price Gain, an important distinction from just looking for %gain. One stock could make a 3% gain but, if the stock is quite volatile, that gain could not be abnormal. A 3% gain for Microsoft is very different than a 3% gain for a penny stock.
To be able to compare gain on a level playing field, we have to consider the gain in consideration of the stock’s historical volatility. That is why we use the concept of statistically significant price gain. We want to find the stocks that are gaining more than we expect given how the stock normally trades.
When we scan the market for stocks that are making statistically significant gains, we will find stocks that are up more than expected but there is a greater message there. Some stocks will be up because they are part of a hot market. I pay attention to the company names and look for themes. If I see a number of stocks from the same sector moving up, I know that there is something going on in that market.
The market has been generally quiet in the past couple of months but there have been areas of the market that have done well. Shipping stocks had a run, Chinese companies did well for a few weeks and US retail stocks have done well for some time. Playing good charts in these strong sectors has paid off.
As you follow the stock market, maintain an awareness for the areas of the market that are showing a disproportionate amount of strength. If you hear a number of times about a sector of the market doing well, take notice. Follow the action and play the hot market. Doing so will have a significant effect on your performance.
![]()
The current market is somewhat trendless making it necessary to play stocks that are trading on their own story. In search of the Alpha factor, we look for stocks trading abnormally and breaking from good chart patterns.
I did a Market Scan for stocks making an abnormal day up with abnormal volume and trading at least 1000 times a day. This found 22 stocks, I inspected the charts and found the following had a good chart:
![]()
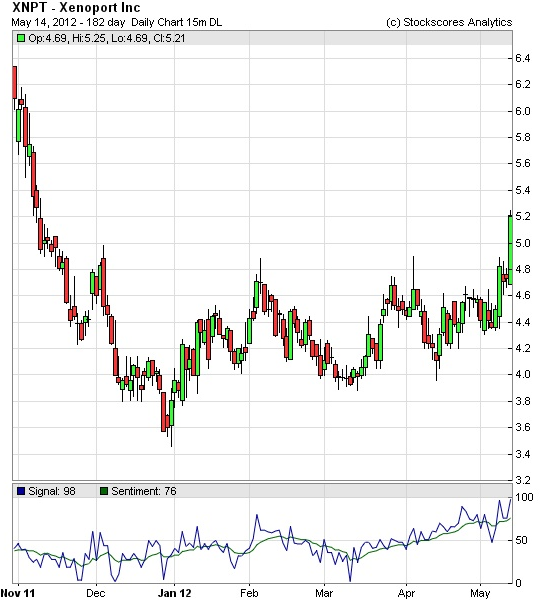
1. XNPT: A good turnaround chart as this stock breaks from an ascending triangle chart pattern after recently breaking a downward trend line. With a stop at $4.25 you have a higher probability that the trade will work but a lower reward for risk ration. Raising the stop to $4.65 improves the reward for risk profile but at the expense of the probability of success. As long as you can handle the lower chance for success, I think the tighter stop is smarter.
References
- Get the Stockscore on any of over 20,000 North American stocks.
- Background on the theories used by Stockscores.
- Strategies that can help you find new opportunities.
- Scan the market using extensive filter criteria.
- Build a portfolio of stocks and view a slide show of their charts.
- See which sectors are leading the market, and their components.
Disclaimer
This is not an investment advisory, and should not be used to make investment decisions. Information in Stockscores Perspectives is often opinionated and should be considered for information purposes only. No stock exchange anywhere has approved or disapproved of the information contained herein. There is no express or implied solicitation to buy or sell securities. The writers and editors of Perspectives may have positions in the stocks discussed above and may trade in the stocks mentioned. Don’t consider buying or selling any stock without conducting your own due diligence.

China is falling apart.
Bond yields are falling.
Copper is sinking.
Oil is sliding.
US stocks, too, slipped all last week.
Even gold…that old stalwart friend…turned its back on us last week, closing the week at $1,585.
Oh, dear, dear reader…everything is giving way. What can we hold fast to?
Can we count on the lumpen, dear reader?
As you know, when it comes to investing or politics, the humble masses are our North Star…our guiding light. We can depend on them to be almost always wrong. They fall for jingoes and jackasses every time.
“Stocks for the long run,” was a popular appeal back at the end of the ’90s…just before the stock market produced its worst returns in 60 years.
“The War on Terror” was another popular flimflam; it helped separate the public from $4 trillion or so of its money.
And don’t forget “Change,” from the man who changed nothing.
We had given up on stocks. They were too expensive. Besides, as we put it, the stock market had never completed its historic rendezvous with the bottom. Investors hadn’t given up. P/E ratios were still over 12 or 15. Dividend yields were below 3%.
We wanted a P/E below 8…and then we’d start to consider them. Or, give us a dividend yield over 5%.
Most important, we’ll wait until the public is fed up with stocks…convinced that they are a loser’s game.
Well, that day may not be far ahead. USA Today reports:
NEW YORK — On Main Street these days, investing in the stock market is about as popular as watching a scary movie on a 12-inch black-and-white TV.
Wall Street’s long-running story about how stocks are the best way to build wealth seems tired, dated and less believable to many individual investors. Playing the market isn’t as sexy as it used to be. Since the 2008-09 financial crisis, the buy-now mentality has been replaced by a get-me-out, wait-and-see, bonds-are-safer line of thinking.
Stocks remain out of fashion even though the stock market has risen more than 100% since the bear market ended three years ago. It’s up 25% since October and 9% this year.
Retail investors have yanked more than $260 billion out of mutual funds that invest in US stocks since the end of 2008, says the Investment Company Institute, a fund trade group. In contrast, they have funneled more than $800 billion into funds that invest in less-volatile bonds.
Investors’ chronic mistrust of stocks is reigniting fears that an entire generation is unlikely to stash large chunks of cash in the increasingly unpredictable market as they did in the past.
“Investors have suffered a traumatic shock that has caused severe psychological damage and made them more risk-averse,” says Carmine Grigoli, chief investment strategist at Mizuho Securities USA. Current worries, such as the USA’s swelling deficit, Europe’s unresolved debt crisis and slowing growth in China, have done little to ease their anxiety, he adds.
Investors are choosing ‘safe’ bond funds. Hmmm… Is it time to dump bonds and buy stocks? Or dump them both?
We faced this question a few days ago. We got a check — the payout on a deal we did long ago and since forgotten about.
What do to with it? Cash? Bonds? Gold? Stocks? Real Estate?
We chose cash!
Our guess is that we’ll be on our present path…lagging growth…dragging unemployment…sagging yields…for a while longer. How much longer? Damned if we know…
But Treasury yields are already near or at all-time lows. How much lower can they go? Houses are already down to their most affordable level ever…how much cheaper can they get?
As for stocks, our bet is that they can get a lot cheaper. Mr. Market, should he care to undertake such a mission, could drive the Dow from 12,000 down to 6,000…or even lower. And, if he cared to, he could hold prices at that level for years.
So could he push the 10-year Treasury yield all the way to 1% (now about 1.8%) if he wanted to.
Yes, dear reader, there’s still room on the downside. A lot of it.
One of the nice things about being a long-term investor is that you can wait a long time before you make your move. As Warren Buffett says, you don’t have to swing at every pitch. And there’s no penalty, except missed opportunities, for just waiting for the perfect ball to cross the plate.
That’s what’s so nice about cash. It’s a bat. It’s in your hands.
And we wouldn’t be at all surprised to see Mr. Market toss us a powder puff pitch before too long.
Bill Bonner
for The Daily Reckoning


-
I know Mike is a very solid investor and respect his opinions very much. So if he says pay attention to this or that - I will.
~ Dale G.
-
I've started managing my own investments so view Michael's site as a one-stop shop from which to get information and perspectives.
~ Dave E.
-
Michael offers easy reading, honest, common sense information that anyone can use in a practical manner.
~ der_al.
-
A sane voice in a scrambled investment world.
~ Ed R.
Inside Edge Pro Contributors

Greg Weldon

Josef Schachter

Tyler Bollhorn

Ryan Irvine

Paul Beattie

Martin Straith

Patrick Ceresna

Mark Leibovit

James Thorne

Victor Adair