
Personal Finance

»» Most equity markets traded lower for the second-straight week. European risks dominated investors’ attention.
»» For Greece, an “orderly exit” from the Eurozone is like an oxymoron (page 2).
»» While we’ve been quite cautious about Europe for a long time, some perspective is in order. (page 3)
»» Global Roundup: Updates from the U.S., Canada, Europe, and Asia. (pages 3-4)

Gold and silver, and most commodities, are now sliding, just as I’ve forecast. But these declines won’t last long. They will prompt central banks to start printing money again — and soon. And this should transform the global economic and investing landscape. – Larry Edelson
-
Country after country will abandon their so-called “austerity” programs.
-
If governments cut spending, the debts will pile up even faster!
-
Some of the world’s largest banks will suffer massive losses and huge new bailouts will be needed.
-
“With this global disaster rushing towards us like a runaway freight train, why aren’t global stock markets crashing?”
-
The European Central Bank (ECB) will kick its money printing presses into overdrive and very, very soon. The U.K. and the U.S. will also join the money printing rampage.
-
Before this great financial crisis comes to its final tipping point a few years from now, you’ll probably see up to $20 TRILLION in global money printing.
-
This unprecedented global orgy of money printing is about to light the fuse on an unprecedented period of global hyperinflation.
-
The gold correction I’ve been forecasting will soon end, and gold will ultimately soar to at least $5,000 per ounce!
Nearly two years ago, we downgraded JPMorgan Chase to a Weiss Ratings of D, implying grossly excessive risk taking by the bank.
And virtually every chance since, we repeatedly publishing this warning about JPMorgan in Money and Markets, Safe Money Report, and multiple press releases.
Then, last week, we jumped online with a video that took our warnings to the next level — with this forecast:
“Some of the world’s largest banks will suffer massive losses and huge new bailouts will be needed.”
Sure enough, just 48 hours later, JPMorgan Chase shocked the investment world with the announcement of massive losses.
But it’s only the first of many — from JPMorgan and other banks around the world, raising urgent questions for investors.
What are the consequences? Will the world’s most powerful central banks crank up the printing presses? How much? And when?
For the answers, simply read the transcript of our recent online briefing below — the focus of today’s issue.
Martin Weiss: Thank you for joining me today in this emergency briefing, 8 Shocking New Forecasts for 2012 and Beyond. And thank you for your overwhelming response to my emails asking you to share your own forecasts, fears, and financial desires with me on my blog.
The number one question you’ve asked is a compelling one:
“Is the great financial crisis that has plagued America and the world for four long years finally over? Or is this just the calm before the next phase of the storm?
“In other words, should we go back to Wall Street investing as usual, or is this the time to buy gold, silver and other alternative investments?”
Today, it’s our turn to give you our forecasts, and my guests today are two men whose past predictions — on bull markets and bear markets, booms and busts — have proven to be astonishingly accurate over many years.
Larry Edelson, editor of the Real Wealth Report, is our expert on precious metals and other tangible assets. He is one of the very few in the world who nailed the bottom of the gold market at $255 per ounce in 1999 and helped his Real Wealth subscribers profit from the entire bull market, to as high as $1,921 per ounce, so far!
Mike Larson, editor of Safe Money Report, is our expert on conservative investments, interest rates and real estate. He is one of the very few who predicted the housing bust, the debt crisis and the Great Recession well ahead of time, and who also saw the turn as the housing market hit a bottom.
Together, they make a great team, especially now that their forecasts have come to fruition, especially now that we move into what we believe is a brand new phase with enormous consequences for investors.
Larry, you’re famous as a gold bull, but in recent months, you have been probably one of the only gold bulls in the world who warned of a major correction in gold. What’s up?
Larry Edelson: Well, yes that is correct, and initially many of my subscribers were disappointed that I didn’t give them the green-light “GO” signal to buy gold right away. I told them to wait, and now, they’re very glad they did.
Martin: So exactly when and where do you see gold moving? And what about silver?
Larry: I don’t want to jump ahead. Mike and I have eight new forecasts that we are going to issue today, and I think you have to understand the first seven before I can give you the eighth, which is on silver and gold. But, I can assure you, my gold forecast will not disappoint you.
Forecast #1
Country after country will abandon
their so-called “austerity” programs.
Politicians all over the world are going to jump back to their old habits. They’re going to borrow and spend, borrow and spend.
Look at what’s already happening in the U.S. You saw all the hullabaloo last year in Washington about the budget. You saw all the big fighting in congress and all of the politicking, and what did they do to cut the deficit?
Martin: Diddlysquat!
Larry: And guess what! The red ink is already gushing again. We have a fiscal deficit this year of $1.3 trillion and counting.
Also look at what’s happening right now in Europe. Last year, after months of agonizing debate, the Europeans finally cobbled together an agreement to cut deficits.
They called it their new “fiscal pact.” But in just the last couple of weeks, the entire agreement has started to collapse.
Sarkozi in France, a major linchpin of the fiscal pact, has fallen from grace, and the social democrats are taking over France.
The government of the Netherlands, another major supporter of the budget pact, has collapsed.
The elections in Greece could be another game changer.
We have seen new protests and riots on the streets in cities all across Europe, and they are just beginning to kick up the firestorm, just beginning to spread.
So suddenly and without warning, the pressure is building for more spending, bigger deficits, and a bigger pile-up of … guess what! Debt!
Martin: Larry, stop there for a moment, because in some countries, they are already committed to cutting deficits. So how does that pan out?
Mike Larson: Martin, let me take that question, if you don’t mind. We already know the answer, and it’s our forecast #2.
Forecast #2
If governments cut spending,
the debts will pile up even faster!
Never forget, government spending is a major booster for these European economies. So in any country that pursues deficit reduction despite all the political backlash, here’s what happens:
-
The more they cut, the more their economies shrink!
-
And the more their economies shrink, the less they collect in tax revenues, which, in turn creates …
-
Even bigger deficits and forces them to cut even more. It is a fatal vicious cycle.
We first saw this cycle play out in Greece over a year ago, and now we’re seeing it hit other countries as well.
We have Italy, Belgium, the Netherlands and the Czech Republic already in recession.
Plus, Spain and the U.K. officially sank back into recession just in the last couple weeks.
You have taxes and other government revenues plunging and their deficits growing by leaps and bounds, which means …
Debt levels soar!
Martin: And this is why we see such a violent political backlash.
Mike: That’s an understatement!
For over three years we have said that Greece was the canary in the coal mine, and that’s exactly what has happened.
The Athens government radically slashed salaries and pensions. It cut entitlements. It raised taxes. And it did all of that to supposedly cut its deficit.
But guess what! Instead of shrinking, its deficit ballooned from 139% of GDP to 159% of GDP.
And its total sovereign debt load is now 17 billion euros higher than it was in 2009.
Martin: But it’s not just Greece.
Mike: No. Ireland’s debt is up by 76 billion euros.
Italy’s debt has surged by 175 billion euros.
Spain’s debt is now larger to the tune of 275 billion euros, and …
France’s debt has jumped by 353 billion euros.
Martin: What about the U.K.?
Mike: They cut teachers’ salaries. They wiped out subsidies for student tuition costs. And yet despite all that, the national debt has still increased by the equivalent of 519 billion euros.
Martin: So what’s the bottom line?
Mike: We are seeing some countries already abandoning austerity …
We see some countries on the verge of abandoning austerity …
And we see some that may try to stick it out through thick and thin.
But no matter what they do, government debts are going to continue to soar globally!
Martin: And those are just the economic pressures for money printing.
Mike: Right. But there are MORE pressures, as you can see with my next forecast …
Forecast #3
Some of the world’s largest banks
will suffer massive losses and huge
new bailouts will be needed.
Martin: More losses from what? From real estate?
Mike: Sure, there are more real estate losses in the pipeline, but that’s almost old news to me.
What I’m mostly talking about is an entirely different disaster. And it’s potentially much bigger than the banking disasters we saw in the U.S. three years ago.
Think about it this way: All U.S. banks combined have roughly $14 trillion in assets, which is obviously a big number.
But the banks of the European Union have almost $45 trillion, or three times more. And they’re loaded down with bad government bonds that are sinking because of those budget and debt disasters that I just told you about.
Martin: In the last debt crisis they got killed in real estate. So they ran to the safety of government bonds.
Mike: Safety? Right. But now they’re getting killed in those supposedly “safe” government bonds, and there’s just no other place to run to.
Martin: Our Weiss Ratings division is tracking this bank by bank. And we’re soon going to launch our new global bank ratings, which you work with also.
Can you give us a sneak preview of those ratings right now?
Mike: Sure.
Deutsche Bank, the largest bank in the world, has assets of more than $3 trillion, and it gets a Weiss rating of D; which means weak.
Plus look at some other huge banks with D- and E+ ratings:

But the most shocking news of all is this: These weak and very weak banks have assets totaling $15.7 trillion.
That’s more than the total assets of ALL U.S. banks combined.
Martin: More than all the U.S. banks combined — just in those few weak banks in Europe!
What are the consequences for investors?
Mike: You could have a massive plunge in bank stocks — for starters.
But more to the point, it means massive new demands for bank bailouts and still more money printing.
Martin: Many of our readers are asking this question …
“With this global disaster rushing towards us like a runaway freight train, why aren’t global stock markets crashing?”
Larry, you predicted this stock market rally scenario just as it’s unfolding. So give us your answer to that question.
Larry: It is a side effect of the money printing. It’s because of wave after wave of money printing by the world’s most powerful central banks.
Martin: Explain how we actually track that.
Larry: For every dollar the central banks print and pump into the economy, they add a dollar to their balance sheets. So you can directly measure the money printing simply by looking at the bloated size of their balance sheet assets.
Martin: What would you say is approximately the normal level for that?
Larry: I would say that each central bank’s assets should be relatively small in proportion to each country’s economy — at about 5% or 6% of GDP.
But the U.S. Federal Reserve has nearly tripled the size of its balance sheet from about 6% of GDP to almost 17% of GDP.
And it has engineered that dramatic, unprecedented change of money printing in just three years.
The Bank of England has followed in lock step with the U.S.
The European Central Bank was the most conservative. But recently, it just exploded its balance sheet to close to 30% of GDP.
And the Bank of Japan, just announced a new round of money printing, it’s also run up the size of its balance sheet assets to about 30% of its economy. Would you care to guess the total size of the balance sheets of these four central banks?
It’s more than $10 trillion! That’s $10 trillion of paper money, fiat paper money, that’s been pumped into the global economy, with nearly half of that hitting in just the last three years.
Martin: What I find most shocking about this is not just how utterly massive and unprecedented it is, but also how passive and disinterested most people are.
Look. My family and I have been tracking speculative bubbles and busts for 80 years.
We have personally witnessed about a dozen recessions, two depressions, four or five stock market crashes, a couple of real estate busts, three bank failure epidemics, and two of the most vicious inflationary spirals of all time.
But we have never seen anything like this.
Larry: Martin, if you think this is extreme, then brace yourself. Because these are just the first waves ushering in a massive tsunami of money printing, which leads me to …
Forecast #4
The European Central Bank (ECB)
will kick its money printing presses
into overdrive and very, very soon.
That’s the only way they know how to react to the riots on the streets, how to finance their budgets, how to rescue their banks and save their own necks politically.
And if you think Europe is too far away from your hometown to matter very much — too far away from Main Street USA — think again.
What they do in Europe will have a direct impact on everything you buy, at the gas pump, in the supermarket, and most immediately, in the financial markets.
In just the last four months, the European Central Bank has embarked on two major, unprecedented waves of money printing.
They’ve just printed 802 billion euros, more than one trillion U.S. dollars, to try to convince investors that the sovereign debt crisis is over! But it is abundantly obvious that the debt crisis is not over.
So they have no choice but to launch yet another round … a third round … a fourth round … and a fifth round.
They’re going to keep kicking the can down the road.
Martin: And they know that.
Larry: Yes they know that they’re confiscating wealth, causing inflation. But they’re buying time in the hope that, somehow, everything will work out fine.
Martin: What makes you so sure they’re going to do this right now?
Larry: Because of everything they’re already doing!
You don’t need to be a Ph.D. or a mind reader to understand these guys.
It’s what they’re doing and it’s what they’re going to continue doing.
They’re not blind. They see all the disastrous numbers we just told you about. They know all about the trouble the economy’s in, and that their banking systems are in. They see no other way out: They must print money.
Mike: But they’re not alone.
Larry: Exactly, which leads me to
Forecast #5
The U.K. and the U.S. will
also join the money printing rampage.
Martin: Okay why don’t you start with the U.K.?
Larry: The British economy never really healed from the debt crisis. It’s got deep, gaping financial wounds. And now, here we go again: Britain has just slipped back into a double-dip recession, the first since Margaret Thatcher. What will their response be? More money printing.
Or go back to the U.S. Despite everything the Fed may say, in the real world, the U.S. Federal Reserve will also unleash a veritable tidal wave of newly-created greenbacks.
Just look at how much the Fed has already printed since August of 2008: $1.963 trillion.
It’s amazing. That’s in just 3-1/2 years.
Martin: Most people don’t have a clear vision of what it means for them personally.
Larry: Let me put it into a very clear context for you: Remember the 1970s, when inflation hit double digits?
Well, that happened after the Fed printed only $83 billion, which is about $332 billion in today’s money.
As a result of that money-printing binge, the buying power of the U.S. dollar plunged. Everyone’s cost of living went through the roof. Overall inflation surged to nearly 15%.
The price of eggs jumped 145%. Corn soared 248%. Wheat skyrocketed 340%. And gasoline more than quintupled in price, exploding 434% higher.
Martin: But this time, we don’t see as much consumer price inflation in the economy.
Larry: I do!
Look, it takes about 18 months for this kind of money printing to work through the economy. And the consumer inflation doesn’t explode immediately. It starts in specific markets that become the targets of speculation. Then it spreads and builds up over time, working its way through the entire economy.
The key is that this time, Fed Chairman Ben Bernanke has printed nearly six times more money than his predecessors printed in the 1970s, and that’s even after adjusting for inflation.
And now it’s happening again.
We all know our cost of living is going up. Just since Bernanke began his money printing binge, gasoline prices have jumped 200%. Eggs are up 203%. Wheat is up 236%. Corn is up 288%.
But this is just the beginning because it’s all going to work its way through the economy!
Plus, never forget: Bernanke’s boss in the White House is up for re-election. He’s going to try everything in his power to paper over what’s still the worst long-term unemployment in recorded history in the U.S.
Martin: So let’s add up the all these numbers.
Mike: I’ve been doing just that as you were speaking.
The U.K. has printed the equivalent of $520 billion.
In Europe, they’ve printed an equivalent of $1 trillion so far. And here in the U.S., the Fed has printed nearly $2 trillion.
In addition, Japan has already printed the equivalent of nearly $322 billion.
Plus, other central banks have done the same. It adds up to a grand total of at least four trillion dollars-worth of newly created money.
Larry: And it’s all sloshing around in the global economy, with more money printing to come.
It’s colossal. It’s massive. It’s unprecedented. And it’s going to be a tsunami of unbacked, paper money flooding the entire world.
And now, you’ve got a new recession hitting, starting first in Europe and spreading out from there …
Martin: Which means …
Larry: Which means the money printing we’ve seen so far could pale in comparison to what’s coming.
In fact, top global economists are already starting to demand that governments not only continue, but actually accelerate their money printing.
You’ve got Adam S. Posen, an American economist on the Bank of England’s monetary policy committee, who says,
“I am here to warn policy makers in the United States, Europe, everywhere that we cannot take our foot off the pedal. The outlook is grim — the right thing to do now is engage in more monetary stimulus!”
He says it clearly, we can’t take our foot off the pedal.
You’ve got another, David Miles at the Bank of England, who says:
“The weakness of demand, given the amount of spare capacity in the economy, still made a strategy of having monetary policy even more expansionary the right one.”
There you go again — pedal to the metal! These are two top economists with the Bank of England. You have riots on the streets and global investors in flight — all demanding the same thing.
At all four of the world’s most powerful central banks, the Fed, the European Central Bank, the Bank of England and the Bank of Japan, the momentum is clearly building for more money printing.
All four are now terrified of recession, bank failures, sovereign debt defaults … and their jobs of course. All four will do everything in their power to avoid these disasters.
Here’s my next forecast …
Forecast #6
Before this great financial crisis comes to
its final tipping point a few years from now,
you’ll probably see up to $20 TRILLION
in global money printing.
The worse things get, the more money they’re going to print.
And when you have a massive tsunami of paper money, there’s only one thing that can happen: The value of that money, it’s buying power, plunges. Through the basement!
Forecast #7
This unprecedented global orgy of money printing
is about to light the fuse on an unprecedented
period of global hyperinflation.
Even if they don’t print one more dollar of paper money, you’re going to see some pretty wild inflation coming up!
Just the money they’ve already printed is going to create that massive inflation.
You have to understand the mechanisms at work here and how they view things. So, I want to read to you one of my favorite quotes from economist John Maynard Keynes, who actually was the granddaddy of money printing and advocated it very strongly.
He wrote this particular note about Lenin in Russia:
“Lenin declared that the best way to destroy the capitalist system was to debauch the currency. By a continuing process of inflation, governments confiscate, secretly and unobserved, an important part of the wealth of their citizens.
“Lenin was right. There is no subtler, no surer means of overturning the existing basis of society than to debauch the currency. The process engages all the hidden forces of economic law on the side of destruction, and does it in a manner which not one man in a million is able to diagnose.”
What Keynes and Lenin were saying is that the way to destroy sovereign debt is to devalue the currency and inflate those debts away — rather than outright default.
The problem is that the average citizen doesn’t realize their wealth is being confiscated through inflation — like a ghost that comes into their home at night and steals their money.
Mike: Two Harvard economists have written essentially the same thing — that inflation is a way for governments in debt to suppress and seize the financial wealth of the average person.
Martin: This whole situation feels eerily familiar to me personally. I was raised in Brazil. And when the Brazilian government did what these countries are doing today, inflation surged to 100% in the mid-1980s.
We thought that was bad, but then it hit more than 1,000% per year in the late ‘80s. And it didn’t peak until it hit a record of 5,000% in 1993.
Can you imagine that? At 5,000%, prices were jumping 50 times over the course of 12 months.
Larry: The classic case of hyperinflation was the German Weimar Republic after World War I, when the German government printed trillions of marks, and it took three trillion German marks to buy one U.S. dollar.
A German-born oil consultant now living in New York tells the story about his father who was a lawyer in Germany during that period.
In 1903, his father took out an insurance policy, and every month for 20 years, he paid the premiums faithfully. Then, when the policy came due in 1923, he cashed it in. Guess what he was able to buy with that policy! A single loaf of bread!
At Freiburg University in Germany, a student ordered a cup of coffee at a cafe. The price on the menu was 5,000 German marks. Then he ordered a second cup. The bill came. But by that time, the price had gone up to 14,000 marks.
Mike: He should have ordered both cups at the same time.
Larry: That’s why, with inflation, you get a hoarding effect. The more prices go up, the more people buy.
Mike: But I don’t think the Brazilian and German inflations are directly comparable to what we’re seeing here today. There are deflationary forces that could interrupt the inflationary spiral.
Larry: Of course. That’s why I warned about a major correction in natural resources over the past nine months or so.
But consider this: The inflation that Brazil and Germany experienced were the result of money printing by just ONE central bank at a time!
Now, we’re seeing coordinated money printing by at least four major central banks at the same time. So in those episodes, the inflation was mostly local. This time, it’s certain to be global.
Martin: How does all this impact our viewers in their pockets?
Larry: It means that every dollar, every euro, every pound you earn, save and invest is going to be worth a lot less. That’s already happening. That’s why food and energy prices are already rising so quickly.
But this is only the beginning. There’s at least four trillion dollars’ of new paper money sloshing around the global economy, just beginning to impact select markets and investments.
And there’s trillions more that are on the way. This money is clearly going to drive the price of gold, silver, oil, and almost all natural resources higher like never before in our lifetime. It’s also going to create profit opportunities for savvy investors and like never before in our lifetime.
Martin: Specifically, how much higher will gold and silver go?
Larry: That’s my last forecast.
Forecast #8
The gold correction I’ve been
forecasting will soon end, and gold will
ultimately soar to at least $5,000 per ounce!
Martin: What about silver?
Larry: On January 21, 1980, the peak price of silver was about $49, or approximately $150 in today’s dollars. So just to match its previous peak, silver would have to rise to that level, $150 per ounce.
The $5,000 gold and $150 silver assume no further money printing, no further decline in the dollar, and no major global catastrophe, financial or otherwise. Add those factors into the mix, and all bets are off.
And don’t forget one of the most important commodities in the world — oil.
Just the decline in the dollar alone could drive it to $200 per barrel! And if we see global supply disruptions, which I’m sure we will, it could spike even higher.
So those are my baseline predictions for gold, silver and oil — my minimal expectations. And they imply the potential for gains of at least double or triple your money.
Martin: Is that with or without leverage?
Larry: Without any leverage whatsoever. Let me stress:
The days of this natural resource correction are numbered, and we’re now closing in on a huge buying opportunity in tangible assets and natural resources.
Martin: Thank you, Larry, Mike. Thank you for your time and insights today. This has been an exceptionally illuminating session.

May’s volatile stock market action has generated point and figure “sell” signals in all major U.S. indexes with the exception of the Nasdaq.

…..read more HERE

“You can’t understand what lays ahead if you don’t understand the past”
~ Satellite, Rise Against ~
Members of my service as well as long time readers know that I do a lot of analysis based on the past. I am constantly looking at long-term historical price charts and data. As a trader, I am always looking for an edge.
Obviously the keys to long-term success involve proper position sizing, risk management mechanisms, and ultimately leveraging probability. Professional traders are masters of these tenets. These characteristics are what separate successful traders from average traders over the long haul.
Sometimes through my rigorous analysis I come across price charts and oscillators that help put together a picture that helps shape my view of the marketplace. The past few months have been some of the most difficult market conditions that I have seen in some time.
The “wall of worries” permeates the financial landscape as risk at present seems unprecedented. The list of macroeconomic concerns ranges from the European sovereign debt crisis to escalation of military action in the Middle East.
I could probably write an entire article about the various risks that plague global financial markets at present, but I try to focus on the positive in any situation. Right now remaining optimistic is a daily battle amid the constant barrage of depressed economic data. Instead of focusing on all of the various risks, I focus on finding opportunities where probabilities are favorable based primarily on historical price data, cycle analysis, and tape reading.
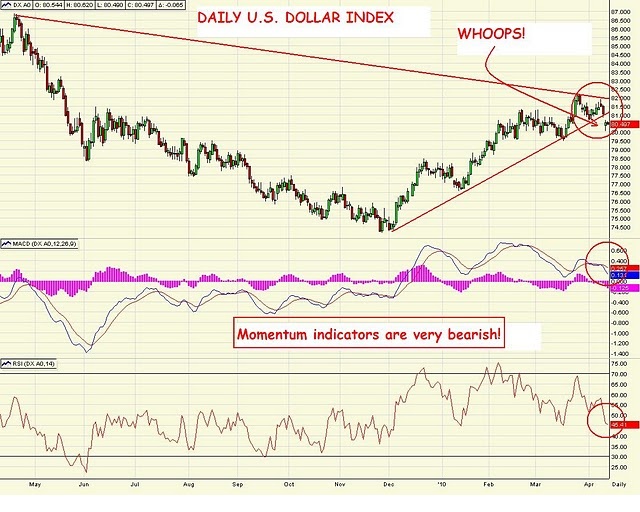
Back on April 9th I proffered an article that discussed my expectation that the U.S. Dollar Index would rally while risk assets such as equities and oil prices would collapse. Additionally I commented on my expectations for weakness in gold, silver, and the entire mining complex. I was wrong about the timing of the U.S. Dollar’s advance, but the ultimate price action analysis was correct.
The following quote came from that article, “As shown above, I believe that short term targets to the downside are likely somewhere in the 1,475 – 1,525 price range. I think gold will find a major bottom near these levels and a strong bounce will play out.” (Click here to view the entire article)
When I originally wrote that article referring to a decline in gold prices gold futures were trading around 1,630 an ounce. Price rallied sharply higher after my article went public, but fast forward to today and my concerns appear to be well founded. I am a long-term gold bull and I ultimately believe that new highs will occur in the future. However, gold and gold miner’s may have further to fall before they find major support.
As stated above, my original expectations for the Dollar Index did not happen in the time frame I was anticipating. However, the belief that a rally was forthcoming proved to be accurate as can be seen from the price chart of the U.S. Dollar Index shown below.
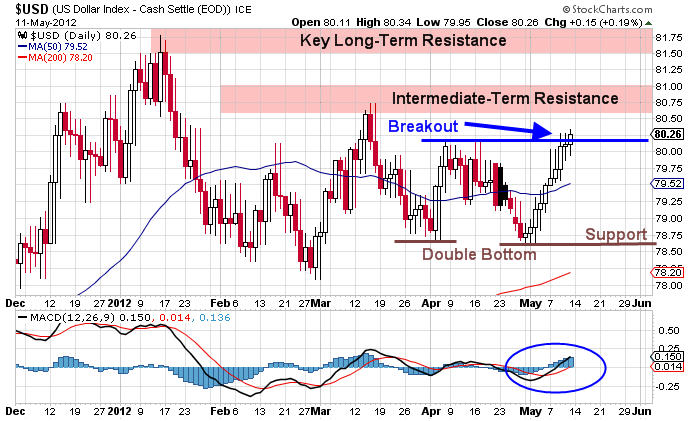
As can be seen above, the price action is confirming serious strength. The weekly close on Friday saw the Dollar close above a key short-term resistance level. Additionally I would point out the double bottom that has been carved out on the chart above which is also bullish. Should resistance near 80.76 give way to higher prices a test of the recent highs is quite possible.
The technical picture suggests higher prices in the near term for the greenback. From a fundamental viewpoint, recent economic data also suggests that higher prices may await as one the largest weekly debt issuance of 2012 among sovereigns within the Eurozone will transpire next week. If any of the debt auctions go poorly it will reflect negatively on the Euro currency and help push the Dollar higher.
Most of the debt issuance is outside of the 3 year maturity window so the LTRO justification to encumber risk does not apply. Next week we will find out just how serious investors are about accepting default risk on European debt instruments. I would be shocked if the ECB sits idly by, but the sheer amount of capital required to safeguard debt issuance next week is extreme, even for a major central bank.
The Euro currency continues to fall and has broken key resistance around the 1.30 price level on the EUR/USD currency pair. Price is not collapsing as of yet, but we are seeing a slow and steady slog lower for the Euro. This price action serves to boost the Dollar which ultimately places downward pressure on risk assets such as equities and oil. Additionally, it reduces the valuation of gold. The daily chart of gold futures is shown below.
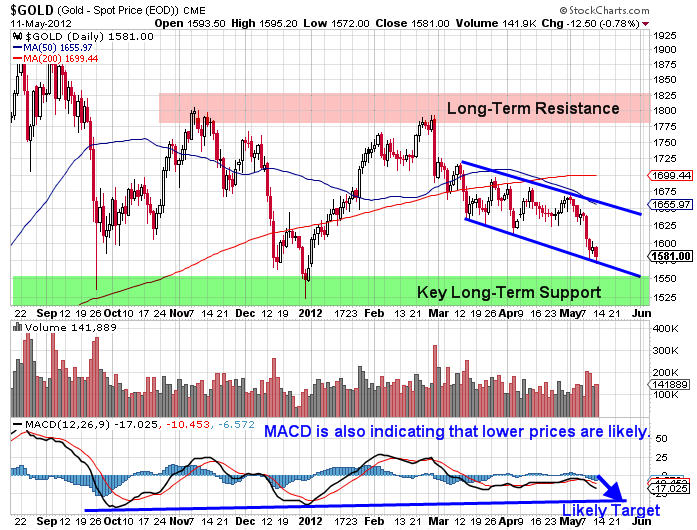
The recent price action in gold has been quite ugly and price is resting at key support stemming from an intermediate-term descending channel shown above. Should the lower bound break to the downside a sharp move lower could play out.
It is important to remember that gold is coming off a monster multi-year bull run and it only serves to make sense that a nasty pullback that shakes out the bulls would be forthcoming. I continue to believe that strong support and buyers will come back into gold around the 1,450 – 1,550 price range as significant long-term support levels should hold up prices. The key support zone is clearly illustrated in the chart above.
I continue to wait for price to reach that key support level and based on the current proximity those support levels are magnetizing price toward them. When long-term support / resistance levels are near price a test is a common occurrence. The most important question to ask is whether the support zone shown above will hold, or will even lower prices ultimately play out?
Gold and silver both are starting to become oversold on the daily time frame. While the gold bugs have been feeling pain the past few weeks, the gold miners have been taken out back to the woodshed for a good whipping. The miners have been absolutely crushed in 2012 .
My long term analysis revealed something quite extraordinary on the longer term weekly chart of the HUI gold mining index which I believe is critical for readers to watch and monitor. We are nearing valuation levels based on the true strength index that have not been seen since the market crash that took place back in 2008. The weekly chart of the gold bugs index is shown below.
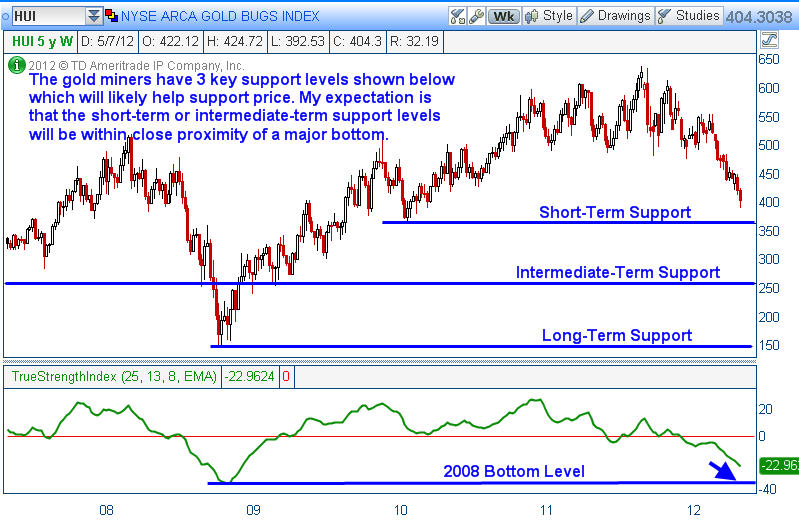
As can be seen above, the Gold Bugs Index (HUI) has been under considerable selling pressure since early September of 2011. However, note how low the True Strength Index is based on 5 years of price data. We are nearing the same level that we saw back in 2008 which marked a major bottom that ultimately resulted in a monster move to the upside for the gold miners.
I am of the opinion that this chart demonstrates quite clearly that a great buying opportunity for gold, silver, and the miners is likely going to present itself in the near future. I will be watching this price relationship over the next few weeks waiting for a strong entry point for a longer-term purchase. After this pullback concludes, the potential returns that could occur in gold, silver, and the miners could be breathtaking.
With 3 clear support levels, a defined risk approach could be used in order to scale in or to reduce market risk should prices continue to move below each support level. While the time is not right just yet, more than likely a solid long-term risk / reward trade may very well present itself in the precious metals and mining space. I am likely a bit early, but the ultimate end game as it relates to fiat currency is documented throughout history. The final result has a finality that few truly comprehend.
If you enjoyed this article and analysis, you can get our detailed trading analysis videos every Sunday, Monday, Wednesday and Thursday here risk free: http://tradersvideoplaybook.com/risk-free-30-day-trial/
Happy Trading and Investing!
JW Jones & Chris Vermeulen
CHRIS’ NEWSLETTER IS UNLIKE ANY
OTHER ALERT SERVICE
Don’t confuse it with other publications that merely post hypothetical suggested trades, leaving trade management and exits to the subscriber’s discretion.
TheGoldAndOilGuy is the only alert service that allows you to look over the shoulder of a real trader, and profit by copying the ultra-safe, super-accurate trades he is actually trading.
Chris’ approach is so simple … yet so powerful … that anyone can use it to turn their trading account into a consistent, passive income-producing revenue stream. Even if you work a regular full time job Monday – Friday 9-5 you can still take advantage of most the trades because of Chris’ unique trading strategies.
The trades Chris finds enable him and his clients to get the kind of profits most traders only dream about.
And now, this amazing system is available to you, too. Yes, you can change your financial life, starting today, by subscribing to TheGoldAndOilGuy.
This material should not be considered investment advice. J.W. Jones is not a registered investment advisor. Under no circumstances should any content from this article or the OptionsTradingSignals.com website be used or interpreted as a recommendation to buy or sell any type of security or commodity contract. This material is not a solicitation for a trading approach to financial markets. Any investment decisions must in all cases be made by the reader or by his or her registered investment advisor. This information is for educational purposes only.
Tags: Gold Forecast, Gold Trading, Trade Gold
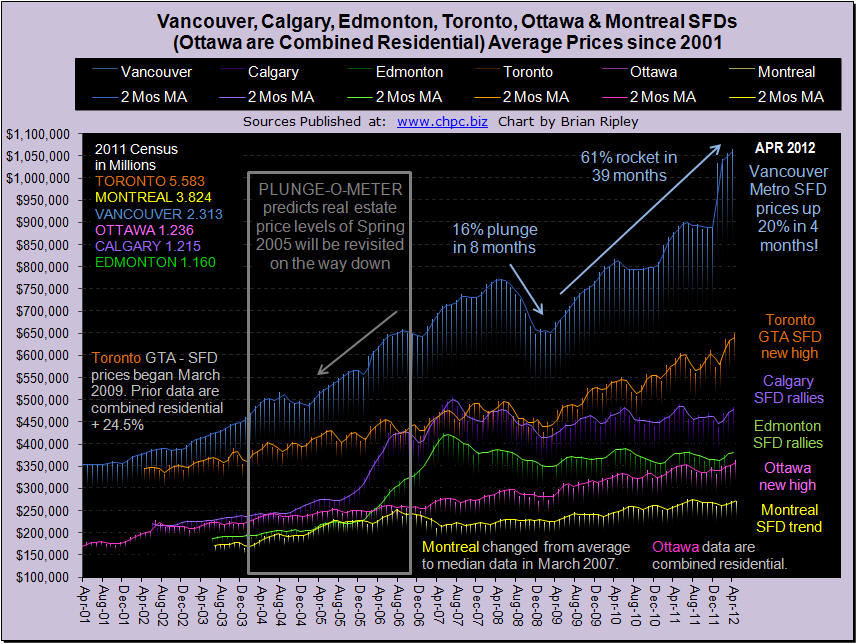
The chart above shows the detached housing prices for Vancouver, Calgary, Edmonton, Toronto, Ottawa* and Montréal (*Ottawa are combined residential). In April 2012 urban flippers continued reeling in accommodating buyers who jumped at asking prices on detached dwellings pushing them to new record highs in Vancouver, Toronto and Ottawa on energetic sales in the east but divergent negative sales in Vancouver (Scorecard). Calgary and Edmonton held and added to their gains from last month but their peak prices happened years ago in the Spring and Summer of 2007 (Plunge-O-Meter). The 10yr less the 2yr spread continues to narrow (35th month since May 2009). The last time this happened, the 10yr less the 2yr spread narrowed from Spring 2004 to Summer 2007 (similar duration as now) which set up the 2007-2009 crash. It’s an interesting comparison, buckle up.
All Data & Charts from Canadian Housing Price Charts

-
I know Mike is a very solid investor and respect his opinions very much. So if he says pay attention to this or that - I will.
~ Dale G.
-
I've started managing my own investments so view Michael's site as a one-stop shop from which to get information and perspectives.
~ Dave E.
-
Michael offers easy reading, honest, common sense information that anyone can use in a practical manner.
~ der_al.
-
A sane voice in a scrambled investment world.
~ Ed R.
Inside Edge Pro Contributors

Greg Weldon

Josef Schachter

Tyler Bollhorn

Ryan Irvine

Paul Beattie

Martin Straith

Patrick Ceresna

Mark Leibovit

James Thorne

Victor Adair