
Stocks & Equities
With earnings season now virtually over, it is time to ask why, despite a majority of the companies beating expectations, is the S&P inline with where it was when earnings season started. There are two main reasons why the market has not been impressed: the percentage of “beaters” is nothing spectacular on a historical basis as was shown previously, especially in the aftermath of aggressive cuts to Q1 top and bottom line forecasts heading into earnings reports; more importantly, even with Q1 earning coming out as they did, the bulk of the legwork still remains in the “hockeystick” boost to the bottom line that is completely Q4 2012 loaded, as bottom up consensus revisions to the rest of 2012 are negative despite Q1 beats. As Goldman summarizes: “1Q 2012 will establish a new earnings peak of $98 on a trailing-four-quarter basis. With 88% of S&P 500 market cap reported, 1Q EPS is tracking at $24.10, 1% above consensus estimates at the start of reporting season and reflecting 7% year/year growth.” So far, so good. And yet, “Despite the positive surprises, full-year 2012 EPS estimates are unchanged relative to the start of earnings season, and currently stand at $105 vs. our top-down forecast of $100. Over half of consensus 2012 earnings growth is attributed to 4Q. Margins at 8.8% have hovered near peak levels for a year, but consensus expects a sudden jump in 4Q to a new peak of 9.1%. We forecast a further decline to 8.7%.”
As a reminder Q4 is when all the unanswered questions are expected to clash violently: to NEW QE or not to NEW QE, the “5% of GDP” fiscal cliff, US elections and the 18th National Congress of China, the debt ceiling, and not to mention Europe which will be there all along. And let’s not forget Apple: “Apple is likely to be the top contributor to S&P 500 EPS this quarter. Exxon (XOM) had been the top S&P 500 EPS contributor since 2003, but Apple surpassed it last quarter.” If something happens to the coolness factor of AAPL, watch out below. Hopefully margins will somehow find a way to boost themselves to all time records among all this uncertainty.
Going back to Goldman, here are the firm’s nine takeaways from Earnings Season:
A total of 421 firms in the S&P 500 have now released 1Q 2012 results representing 88% of the equity cap. Below we highlight 9 takeaways:
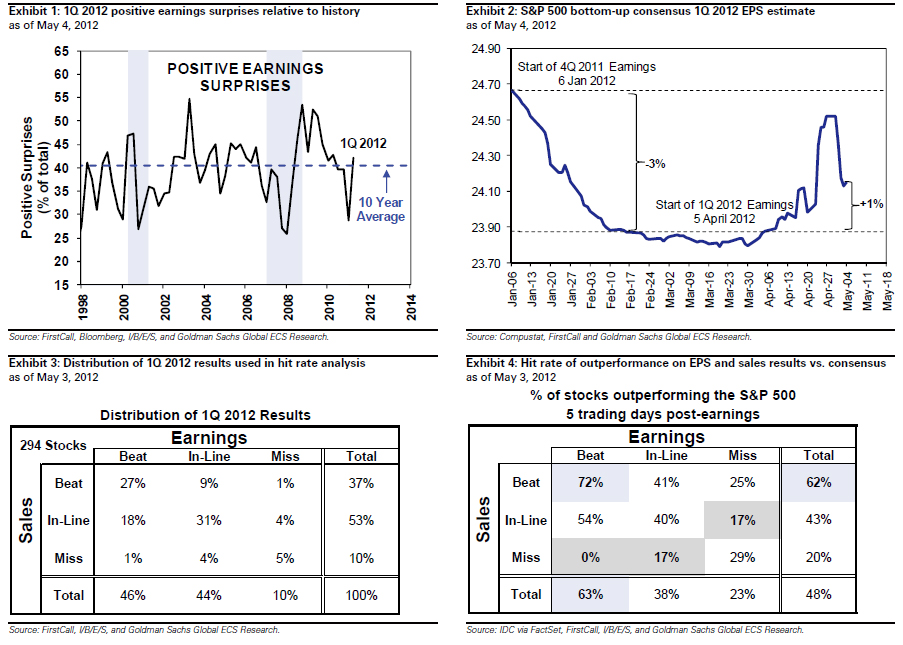
1. More surprises than average. The percentage of firms beating consensus EPS expectations by more than one standard deviation (our definition of a positive surprise) exceeds the historical average. The number of firms missing by more than one standard deviation is in-line with the average. Of the 421 firms that have announced results this quarter, 42% of firms beat expectations and 13% have missed. The ten year historical average of beat and misses equals 40% and 13%, respectively (see Exhibit 1).
2. Earnings above expectations. 1Q EPS is tracking 1% above the consensus estimate at the start of reporting season, $24.10 vs. $23.88 (see Exhibit 2). The median surprise over the past ten years has been 1.8%. The 1Q estimate fell by 3% between the start of the 4Q 2011 reporting season in mid-January and the start of the 1Q 2012 season in early April, which aided the level of surprise. Accounting differences between adjusted and operating results for PRU and PFE reduced aggregate earnings level.
To Read More CLICK HERE

“We’re all set up to go to the upside…and it just remains to be seen how far and how fast JPMorgan et al will allow prices to rise.”
¤ YESTERDAY IN GOLD AND SILVER
The Kitco website went down for scheduled maintenance for about two and a half hours in the wee hours of Friday morning…and did not come back on line until after I’d hit the ‘send’ button on Friday’s column.
During that time, the low price print for gold was in for the day…and maybe even for this move down.
Once that low was in, which came shortly before 10:00 a.m. in London, gold began to rally. It really took off once the jobs numbers were released at 8:30…and the price got hit the moment that happened.
But the gold price continued to rally until an amazing out-of-the-blue rally in the dollar index showed up around the London p.m. gold fix…and that put a temporary kibosh on the gold rally. Once the dollar rally burned itself out, the gold price began to rally anew, but never made it back to it’s earlier high…and once Comex trading ended at 1:30 p.m. in New York, the gold price got sold off a few dollars in the close of electronic trading.
The low for the day in morning trading in London came in around the $1,625 spot mark…and the New York high [$1,648.50 spot] came about 9:50 a.m. Eastern.
The gold price closed up $6.30 on the day. Net volume was pretty healthy at around 132,000 contracts…so it’s a good bet that JPMorgan et al had to use some heavy lumber on the gold price yesterday morning in New York to prevent it from getting away on them.
Silver’s price path was mostly same, except the low of the day came about 11:15 a.m. in London…quite a bit later than the low in gold. After that the silver price followed the gold price very closely.
The silver price closed at $30.34 spot…up 27 cents from Thursday’s close. Net volume was pretty heavy at 39,000 contracts.
To Read More CLICK HERE

»» Most equity markets pulled back meaningfully with the exception of Asian indices. The sell-off accelerated following Friday’s lackluster U.S. employment data.
»» Investors should keep an eye on Germany. It has succumbed to Eurozone headwinds. (page 2)
»» The U.S. jobs report shouldn’t be a big surprise—it resembles many others in this recovery cycle. The problem is America is climbing out of a much deeper canyon than before. (page 3)
»» Global Roundup: Updates from the U.S., Canada, Europe, and Asia. (pages 3-4)

One of the questions that we receive on a regular basis is whether one should invest in junior or senior mining stocks. The answer is that diversification is the way to go, but that’s not the full reply as weights in the diversified portfolio can still favor either juniors or senior stocks.
The reply to this question depends on when the question is asked – there are times when juniors outperform and there are times when they underperform the senior mining stocks. Before providing you with a chart of the junior-senior ratio, let’s take a closer look at the situation in the general stock market, ale the latter is highly correlated with juniors in the long term (charts courtesy by http://stockcharts.com.)
$SPX (S&P 500 Large Cap Index) INDX
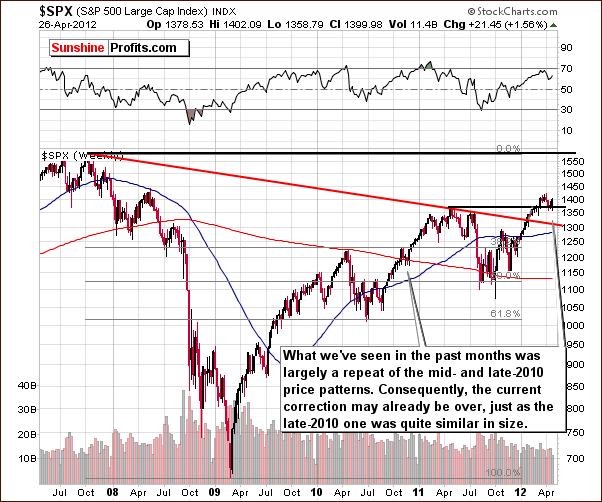
In the long-term S&P 500 Index chart, we have much the same outlook as we saw last week. The recent correction appears quite similar to the one of 2010 and the consolidation seen in RSI levels is also similar. Back then, prices rose nearly 15% in about three months following the small correction. Self-similar patterns (like this one) are quite reliable, so at this point, stocks appear ready to move higher.
To Read More CLICK HERE
Will new energy discoveries and new technology sink oil prices? Will lower oil prices rescue the world from the Great Correction?
Maybe, say Porter Stansberry and a good number of the analysts and experts here.
We’re attending an investment conference — for professionals only. It’s a beautiful place for one. The island is a barrier island, mostly sand…surrounded by ocean or marshland. There is a golf course…tennis courts…bocce courts… Maybe even a kangaroo court. Or an appeals court. And a royal court. Not to mention a food court.
The lodge looks like it was built in the ’20s…it has that glamorous look that seems to call out for a white sweater and white flannel pants… You feel you should dress like Cary Grant and hope to meet Claudette Colbert on the lawn.
The rooms are luxurious…large and quiet, while the lobby is lush with rich fabrics and comfortable chairs. The staff is poised, gracious and almost genteel. They would be good people to look after you if you were going broke or insane. Not that we’re planning on either. But it’s always a good idea to be prepared. Whether you lost your mind or your money, the nice people running the place would probably wait a few days before kicking you out.
There seems to be almost no one here. The lobby is empty most of the day. We wonder how it stays in business.
This is also where George W. Bush convened a meeting of the G7 heads of state. In the room next to ours, the walls are hung with photos of Tony Blair, Silvio Berlusconi, George W. Bush…and others.
They’re all gone from office now. Except one, Vladimir Putin, a man who looks like he might never leave.
But the news down here is upbeat. Thanks to fracking and horizontal drilling. They say these techniques are making billions of barrels of oil available. Believe it or not, the US is set to be the world’s top producer by 2020, according to a Goldman Sachs study.
An oilman from Texas showed us a map. It included a large chunk of Southwest Texas, colored to show where drillers had bought oil rights and where they were operating.
Heck, there is hardly an empty county in the whole state! The expert took the map apart, analyzing who was working where…and how much oil they were likely to get.
The results were staggering.
“Oil will fall below $40 a barrel,” predicted Porter Stansberry, our host.
Whether that will happen or not, we don’t know. But it got the group talking excitedly.
“Cheap oil will set off an industrial renaissance in America,” one suggested.
“Sell the oil and gas companies,” recommended another.
To Read More CLICK HERE


-
I know Mike is a very solid investor and respect his opinions very much. So if he says pay attention to this or that - I will.
~ Dale G.
-
I've started managing my own investments so view Michael's site as a one-stop shop from which to get information and perspectives.
~ Dave E.
-
Michael offers easy reading, honest, common sense information that anyone can use in a practical manner.
~ der_al.
-
A sane voice in a scrambled investment world.
~ Ed R.
Inside Edge Pro Contributors

Greg Weldon

Josef Schachter

Tyler Bollhorn

Ryan Irvine

Paul Beattie

Martin Straith

Patrick Ceresna

Mark Leibovit

James Thorne

Victor Adair