
Stocks & Equities
Dear Readers,
We are just back from the Recovery Reality Check Summit, which was very informative as well as thought-provoking. We took some time while there to chat with a few of our speakers after their presentations and will be sharing them here over the next few weeks.
Our first conversation is with Rick Rule, the legendary resource speculator. He gives us a powerful primer on being a contrarian speculator, which may help bolster some discipline in the current market climate. We hope you enjoy this presentation.
Sincerely,
Louis James, Senior Metals Investment Strategist
Casey Research
[Rick was one of 31 esteemed financial experts featured at the Casey Research Recovery Reality Check Summit, where attendees heard three days’ worth of illuminating takes on the economy, spirited debate over where it’s headed, and a wealth of actionable investment advice. Even if you couldn’t make it, you can still hear every recorded session with our soon-to-be released Summit Audio Collection.]
(Interviewed by Louis James, Editor, Casey International Speculator)
Louis James: Ladies and gentlemen, welcome. Thank you very much for tuning in. We are at the Casey Research Summit – the reality check on the recovery of the economy. One of our luminary speakers who is always at our events, Rick Rule, is with us here now. We’d like you to give us the quick tour of your talk today and we’ll go from there.
Rick Rule: Sure. My role here wasn’t to do economics; that’s not what I am. I am a speculator, and so I talked about where we are in the context of where people are with their own portfolios – in particular portfolios that are junior-resource centric – which is what I think most of your audience was interested in.
Louis: Right.
Rick: And my point was that there were some good forces in the market: lots of cash on the sidelines; some good work being done; and basically a good market for resources as a consequence both of population growth and demographic growth at the bottom of the economic pyramid, and in terms of historical supply constraints. And there were some bad factors in the market: excessive debt in the system; way too much government interference; very large social takes on a global basis, beginning to impact extractive industries. And there were some truly ugly factors – the ugly factors in particular being poor corporate as opposed to share market performance, and the unfortunate truth that probably 80% of the junior resource stocks on a global basis are valueless. So the sector itself is in perma-decline. Although the performance – as you know from being affiliated with Casey – of the top 10% of the sector can be extraordinary. It often serves merely to focus attention on the worst companies in the sector. And then I went on to say: “This is the set of circumstances that exists, now what can we do with this?”
The fact that the market has fallen, by some estimates, by half suggests by other estimates that the market is approximately half as risky as it used to be. Price has taken care of some of the risk that existed in the market before.
The second factor that we need to take into account on a going-forward basis is the fact that the industry itself didn’t finance as aggressively last year as they did the year before, but although they didn’t raise new capital, they didn’t stop spending. I call this financial roulette. The issuers are engaged in this rather circular exercise, which is very risky: They’re spending money to attempt to get results, to generate excitement, to raise their share price, to raise money. So they’re spending money to raise money, which is a very, very risky strategy.
Most of the issuers will need to come back to market this year, and they’re coming into a market that’s in total disarray. The buyers that existed for the last 10 years – the small hedge funds and the open-ended hedge funds – are facing massive redemptions as we speak, so rather than being a source of new capital, they’re a source of the selling that you see weighing down the market. We are going to have to, as investors, invest with a view to a different buyer on a going-forward basis, and the companies who are issuing equity are going to have to find a different class of buyer for the new financing. So we’re in a time of real change and real turmoil – and hence a time of real opportunity.
My suspicion is that with so many issuers having to access the market and so few market participants that have the capability of differentiating between good and bad issuers, that just as the bad issuers were swept up with the good issuers in 2010, the good issuers are being swept out with the bad issuers in 2012. It’s my supposition that for investors who are willing to work hard, take advice, and segregate viciously in terms of allocation of capital, that this will be the best private-placement investment period that we have enjoyed since 2002.
To Read More or Watch the Video CLICK HERE


“There is only one side of the market and it is not the bull side or the bear side, but the right side.”
– Jesse Livermore
I guess it is no different this time. There are always more questions than answers. I guess the first question is: Are we finally seeing a change to the “all one market” liquidity-driven correlations in global markets?
For about seven years running, maybe more, it seemed there was only one market (and that market did the funding). Of course this period was qualified by the terms “risk on” or “risk off” … and still is. In effect, the ebb and flow of growth expectations, reinforced by market liquidity, drove risk assets. Risk assets are now considered a broad bundle including: stocks, commodities, and currencies (except for the US dollar, which was the major funding currency for this all-one-market move) which moved sharply higher in lock-step correlation.
This tightly correlated bundle of assets seems no longer to be acting as one big market, as you can see clearly in the chart below:
Dow Jones Industrial Average vs. Euro Stoxx 50 Index vs. CRB (commodities) index vs. EUR/USD Weekly:

Why has this changed? Why the divergence? Theories seem to abound; here are a few we think about … and then some reasons why we are skeptical:
I. Money is flowing out of Asia on decelerating Chinese growth and out of Europe on structural risk and must hide in the US market.
A. If money is flowing that freely into the US, why has the US dollar been such a dog? Shouldn’t it benefit from that flow? It hasn’t, at least not much.
B. If money is flowing from Europe on structural risk, why is the Euro supported?
1. And if long-term structural portfolio positions were that afraid of the euro, why is gold lagging, i.e. why isn’t it getting some of that haven flow?
C. If stock buyers site US economic growth momentum as their primary rationale, why are commodities prices not ticking higher accordingly?
D. If US economic growth is the driver, why are US bonds in the ozone still?
E. If the US stock move higher is based in large part to the rising probability the Fed gives us QE3, which makes sense, why isn’t the dollar in a tail spin, and why aren’t other risk assets following stocks?
To Read More CLICK HERE

Investment fund manager and author of the ‘Gloom, Boom & Doom Report’ recommends physical over mining stocks and says another move to downside of gold is possible, but worldwide printing of money assures long-term support.
Swiss-born and educated Marc Faber’s distinct voice is a common sound on CNBC and Bloomberg TV when it comes to big-picture forecasting in investments. The contrarian views of his “Gloom, Boom & Doom Report” often garner headlines, but Faber does go along with the crowd when it comes to pointing out the dangers of rising government debt and unabated monetary intervention. HAI Managing Editor Drew Voros caught up with Faber at his Hong Kong residence and spoke to him about gold, the Treasury market, which countries should be out of the eurozone and what an ideal portfolio allocation looks like.
Hard Assets Investor: At Inside Commodities last December in New York City, you presented a line chart that compared gold prices to U.S. federal debt and showed the parallel trajectory lines of both. With debt increasing every day, your charts say gold will keep increasing, right?
Marc Faber: People say the price of gold is in a bubble stage and it is up substantially from the lows in 1999, which was, at the time, around $252 per ounce. But at the same time, we had an explosion of debt, not just government debt, but private sector debt, and an explosion of unfunded liabilities such as in the pension fund industry, and not just with Medicare, Social Security and Medicaid.
So now, 12 years after the gold’s low, we are essentially in a situation where maybe the price of gold should be much higher because the economic and financial conditions are worse than they were 12 years ago. I go to lots of conferences and I usually ask the audience, “How many of you own gold?” Normally, hardly anyone owns it. I’ve been to conferences with thousands of people attending, and nobody owned any physical gold.
I doubt we are in a bubble stage. When you went to an investment conference in 1989, everybody owned Japanese stocks. And in 2000, everybody owned tech stocks. That is the bubble, when the majority of market participants own an asset. I think there are more people that own Apple stock than gold.
HAI: What’s the biggest influence on gold right now? Is it all this sovereign debt?
Faber: We had the big move. The gold price overshot when it went to $1,921 on Sept. 6 last year. And then we oversold on Dec. 29, when gold went down very quickly to $1,522. I suppose around this level, gold’s price is moving sideways. I wouldn’t mortgage my house expecting prices to go up. They could still go down more and we would still be in a bull market even if gold prices dropped to $1,200/oz, although that’s not in my forecast.
I’m telling every investor, in the long run, that central banks all over the world are going to print money because they know nothing else. The purchasing power of currencies will continue to go down. In other words, the price of gold and silver will move up in the long run.
HAI: Why are central banks becoming net buyers of gold?
To Read More CLICK HERE


Every quarter as part of its refunding announcement, the Office of Debt Management together with the all important Treasury Borrowing Advisory Committee, which as noted previously is basically Wall Street’s conduit telling the Treasury what to do, releases its Fiscal Quarterly Report which is for all intents and purposes the most important presentation of any 3 month period, containing not only 70 slides worth of critical charts about the fiscal status of the country, America’s debt issuance, its funding needs, the structure of the Treasury portfolio, but more importantly what future debt supply and demand needs look like, as well as various sundry topics which will shape the debate between Wall Street and Treasury execs for the next 3 months: some of the fascinating topics touched upon are fixed income ETFs, algo trading in Treasurys, and finally the implications of High Frequency trading – a topic which has finally made it to the highest levels of executive discussion. It is presented in its entirety below (in a non-click bait fashion as we respect readers’ intelligence), although we find the following statement absolutely priceless: “Anticipation of central bank behavior has become a significant driver of market sentiment.” This is coming from the banks and Treasury. Q.E.D.
Some highlights specifically from the TBAC component of the presentation.
First, the TBAC discusses key changes to the Fixed Income markets over the past few years:
- Reduced liquidity of spread product
- Likely a consequence of investor risk aversion and regulatory reform. Treasuries remain liquid
- Prevalence of “risk on / risk off” mentality
- Extreme valuations, correlations rising, excess returns becoming more volatile
- Role of government
- Extraordinary monetary policy (ZIRP, balance sheet growth, communication/transparency)
- Regulatory reform
- Changes in market participant behavior
- Cyclical (risk tolerance) and secular (demographics / LDI strategies), customized solutions
- Growing role of electronic trading
- Driven by increased efficiency and regulatory reform
Supporting visual data:

And what matters for bond traders everywhere: Implications of Reduced Corporate Bond Liquidity, which are mostly the lobby group’s efforts to neutralize the Volcker Rule:
- A reduction in liquidity / wider bid-offer spreads has both an upfront cost to existing investors (who have to mark their existing holdings at wider levels) as well as an ongoing cost for issuers and investors
- Per a recent study, a strict implementation of the Volcker Rule for the corporate bond market may cost $90-315bn upfront plus $12-43bn/yr for issuers and $1-4bn/yr for investors in future transactions
- Analysis by Barclays** indicates that the liquidity premium has risen from ~20bps in Jan ’07 to ~40bps in Mar ’12
- Policy makers should carefully consider the impact on market liquidity when introducing new financial regulations, such as the Volcker Rule
- SIFMA, the Credit Roundtable (a group of large fixed income money managers), and other market participants have submitted comments on this topic
- Given the size of the bond markets, it would be difficult, if not impossible, for the banking sector to reintermediate the capital markets (replacing bonds with loans) in response to a prolonged market dislocation
To Read More CLICK HERE
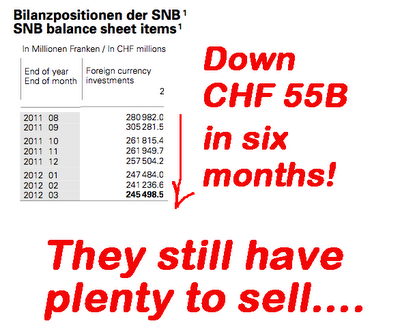
The 1st Q reserve numbers for the Swiss National Bank tell an interesting story. For a second quarter in a row, the foreign reserves have declined.
There is only one way that this could have happened; the SNB offloaded a portion of the EURCHF position it took on back in September of 2011 when it was forced to intervene.
A significant portion of the CHF 60B ($67B) “reverse intervention” was the result of the unwinding of large speculative short EURCHF positions by market players. (This demonstrates how big the speculative capital flows were.)
Some additional EURCHF sales by the SNB were, no doubt, accomplished when the market was betting that the SNB would raise the Peg from 1.20 to 1.30 or higher.
Officials at the SNB did everything they could to encourage speculation that the Peg might be raised. I find it amusing that while those officials were talking the EURCHF higher, they were actually selling on the side. Basically they lied. For an interesting perspective on this: Link
Just a few weeks ago a big shot at Goldman was selling the idea that the SNB would raise the Peg to 1.35. Maybe some of the SNB’s“chatter” rubbed off on O’Neill.
To Read More CLICK HERE

-
I know Mike is a very solid investor and respect his opinions very much. So if he says pay attention to this or that - I will.
~ Dale G.
-
I've started managing my own investments so view Michael's site as a one-stop shop from which to get information and perspectives.
~ Dave E.
-
Michael offers easy reading, honest, common sense information that anyone can use in a practical manner.
~ der_al.
-
A sane voice in a scrambled investment world.
~ Ed R.
Inside Edge Pro Contributors

Greg Weldon

Josef Schachter

Tyler Bollhorn

Ryan Irvine

Paul Beattie

Martin Straith

Patrick Ceresna

Mark Leibovit

James Thorne

Victor Adair