
Personal Finance
Our friends Kevin Konar and Brian Moore from RBC in West vancouver, BC are making the latest exclusive RBC Capital Markets report on gold and precious metal investing available to Michael Campbell’s audience.
The report includes price range projections, short term and long term outlooks, technical indicators and portfolio recommendations. MoneyTalks listeners and subscribers can receive the report free – just email a request driectly to Brian.
CLICK HERE to send an email request for the password.

Gaithersburg, Maryland – “About eight years ago, I was going down the elevator of a hotel in Las Vegas with a friend of mine,” Arnaud Karsenti told me. “The elevator skipped the 13th floor. And my friend said to me, ‘How come there is no 13th floor? What a bunch of wasted space!’”
The lack of a 13th floor comes from the same fear that prevents people from walking under ladders or causes them to shiver when a black cat crosses their path. But Arnaud decided to make a business out of it. The idea is to find value where others fear to go.
Arnaud is the managing principal and co-founder of 13th Floor Investments. The firm manages the Florida Real Estate Value Fund, which, as the name implies, focuses on real estate value investing in Florida. Recently, while in South Beach, I tried to catch up with Arnaud, but our mutually jangled schedules couldn’t mesh. We talked later by phone a couple of times.
I want to share what Arnaud and 13th Floor are up to, because you’ll get a fascinating ground-floor view of what’s happening in real estate in the post-bust world. There is also much investing wisdom in what he shared. Finally, the Florida Real Estate Value Fund itself is a fine alternative investment idea. (Later in this letter, we’ll look at another opportunistic way to play distress in real estate.)
Arnaud and I started talking about how there can be a big gap between the big picture and the view on the ground.
“There’s been a lot of conflict in the data,” Arnaud told me. “Housing is a great area where you can take out the paper every day and read about pricing going down or unemployment pressures, yet the local data in Dade and Broward counties [in Florida] indicate a reverse trend. One challenge for us is to decide what we believe and try to cut through some of the noise of the big macro stuff to really understand what’s going on.”
To do this, Arnaud and his team rely on the good old spadework of due diligence. His business partner, Robert Suris, is a local developer and contractor with a keen sense of property value. Together, they meet with builders and bank presidents and dig into local markets.
This helps avoid the two big problems with the big-picture statistics: They are backward looking and tend to paint with too broad a brush. Still, Arnaud says there are unmistakable big-picture trends unfolding in real time that are worth paying attention to. He highlighted some important ones:
To Read More CLICK HERE


Intermediate natural gas weighted stocks in Canada are valued higher—sometimes a LOT higher—than oil stocks, despite oil being worth 35 times more than gas.
And that could mean significant price weakness for already battered natural gas stocks, says Haywood Securities analyst Alan Knowles.
“People think (the stocks of) gas companies have corrected, but they’ve only partially corrected,” he told me in a phone interview. “The correction hasn’t kept pace with how far it should have gone,” given how low natural gas prices have moved.
At first glance, Knowles’ says the gas companies are NOT valued more highly than the oils—but that’s comparing the two groups at the industry standard of 6:1; where 6 barrels of natural gas are considered equal to one barrel of oil. See his chart below that shows this. The green dots are the leading intermediate oil producers—Crescent Point, Legacy Oil and Gas, Baytex and Petrobakken, and the red triangles are the gas weighted companies.
The gas stocks are clearly cheaper on this chart, which measures them in terms of the value of their production — $50,000 per flowing barrel up to $250,000; again all based on the industry standard 6:1 ratio.
To Read More CLICK HERE


IS THE CORRECTION OVER?
Precision timing for all time frames through a multi-dimensional approach to technical
analysis: Cycles – Breadth – P&F and Fibonacci price projections
and occasional Elliott Wave analysis
“By the Law of Periodical Repetition, everything which has happened once must happen again, and again, and again — and not capriciously, but at regular periods, and each thing in its own period, not another’s, and each obeying its own law… The same Nature which delights in periodical repetition in the sky is the Nature which orders the affairs of the earth. Let us not underrate the value of that hint.” ~ Mark Twain
Current Position of the Market
SPX: Very Long-term trend – The very-long-term cycles are down and, if they make their lows when expected (after this bull market is over) there will be another steep and prolonged decline into late 2014. It is probable, however, that the steep correction of 2007-2009 will have curtailed the full downward pressure potential of the 120-yr cycle.
SPX: Intermediate trend – The intermediate uptrend is still intact and the short-term correction could be over.
Analysis of the short-term trend is done on a daily basis with the help of hourly charts. It is an important adjunct to the analysis of daily and weekly charts which discusses the course of longer market trends.
Daily market analysis of the short term trend is reserved for subscribers. If you would like to sign up for a FREE 4-week trial period of daily comments, please let me know at ajg@cybertrails.com.
Market Overview
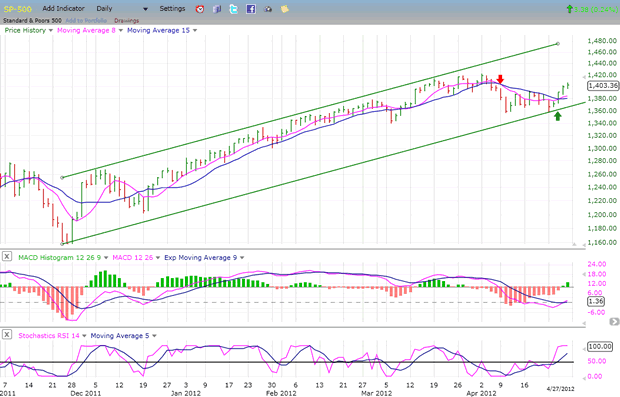
After last week’s SPX performance it’s possible that the market correction is over. The cycle low which was ideally due for next week may have come in about a week early, and could have been responsible for the spike down to 1359 and the subsequent rally. This would mean that the 1357 low of 4/10 has held and that the SPX could see higher prices before it is challenged again.
With this market action, my former scenario may have to be modified. The rally which started at 1359 last Monday met its initial Point & Figure projection of 1405 on Friday. It’s a good bet that we could get a correction now that this target has been reached. The type of correction will decide whether the cycle has truly bottomed early, or if it is still ahead of us. The reason why this is not certain is because there are other current cyclical factors which could explain the market’s behavior.
EW analysts are divided on the current structure. The view that 1359 was the end of wave 4 and that wave 5 is now underway is meeting with skepticism by those who believe that the corrective action which started at 1422 is not over. How the SPX corrects from 1405 should go a long way toward clarifying the structure.
Should this be the beginning of wave 5 from 1359, we should have just completed wave 1 of 5 at 1405 on Friday. After a corrective wave 2, the next wave should take us to about 1424/1427, and there is the potential for an ultimate move to about 1450. A P&F projection to that level is confirmed by several Fibonacci calculations — providing the SPX can rise above 1422. If the SPX cannot get above that level, it would force us to consider that we may only be dealing with an extension of the correction.
To Read More CLICK HERE
I love earnings season. Don’t you? Sure, it can feel like trying to stand in front of an open fire hydrant, but so many opportunities can arise for both short-term traders as well as long-term investors due to the volatility among individual stocks. Time is scarce – institutional investors react swiftly, often buying or selling before they have time to fully digest the news.
Earnings season is particularly busy for me, as I try to keep up with the 100 stocks on my watchlist as well as pay attention to important ones that aren’t. This past week, for instance, 30 of the 100 reported, many hosting conference calls at the same time. One morning, I caught four straight live calls, but I tend to end up reading the transcripts for many of them. For those not aware, Seeking Alpha provides free transcripts, which are available on many companies.
When a company reports, there are many possible reactions. The report can can be viewed as “Good”, “Neutral” or “Bad”, but it’s not that easy. To me, it’s almost always about the future rather than the recent past. Ultimately, my key question that I want to answer is this: How does the news impact the future earnings? Presumably, if the future is brighter, the stock goes up. If it is dimmer, it goes down. If only it were that easy!
So, when I am judging the quarter, I am looking ahead, but I certainly recognize that many others focus on the short-term. For example, one of the stocks I will address below, Mattel (MAT), missed earnings by 50%. OH MY GOD! The reality is that this was their smallest quarter in terms of earnings typically, and the “huge miss” was rather inconsequential relative to the full year.
The real opportunities that stand out to me are the following combos:
* Good news, mild reaction
* Bad news, terrible reaction
While I am not addressing it today, often a company will report what I view as very favorable news, but the market, for whatever reason, doesn’t fully appreciate it. These situations can be tricky, requiring a judgment about why the stock isn’t moving. The flip-side, though, seems to happen more frequently: A company “misses” and the stock is pounded silly.
To Read More CLICK HERE


-
I know Mike is a very solid investor and respect his opinions very much. So if he says pay attention to this or that - I will.
~ Dale G.
-
I've started managing my own investments so view Michael's site as a one-stop shop from which to get information and perspectives.
~ Dave E.
-
Michael offers easy reading, honest, common sense information that anyone can use in a practical manner.
~ der_al.
-
A sane voice in a scrambled investment world.
~ Ed R.
Inside Edge Pro Contributors

Greg Weldon

Josef Schachter

Tyler Bollhorn

Ryan Irvine

Paul Beattie

Martin Straith

Patrick Ceresna

Mark Leibovit

James Thorne

Victor Adair