
Personal Finance
Student Loan Battle
There was a big fight in D.C. this past week over student loans.
The issue is a scheduled increase in interest on new student loans from 3.4% to 6.4% set for July 1. Clearly this is a dumb plan. I don’t see any political opposition to the idea that the summer of 2012 is a horrible time to double the cost of student loans. It will shock no one that the ‘solutions’ being put forward by the politicos are the same ones they propose for every other problem.
The House Republicans have put forward a Bill to extend the 3.4% rate for a year. The cost (increased deficit) of the twelve month extension is $6B. The Republicans want to offset the $6B with (surprise) $12B in reduced spending for the Affordable Care-Act. The Republicans love to trade marbles for reduced Obamacare. They want a 2-1 reduction in medical spending versus education costs. Maybe the “Reds” have the chips to push this outcome. They might settle for a 1-1 deal, but the White House will hate this outcome.
The Senate Democrats want to raise taxes on those making over $250K to offset the cost of the one-year deferral. Their argument is similar to the Buffett tax plan they tried a few weeks ago. Lacking support, it was so clear it wouldn’t pass that it was never voted on. I would give the Senate legislation on student loans a zero chance in the House. It is D.O.A.
There will be the same ideological pissing match and the same result. We will get a one-year extension “paid” for with “promised” reductions in expenses starting in 2017. Another kick of the can, and another big problem in 2013.
To Read More CLICK HERE


By: Nouf
The decline that we have seen over the past few weeks has been very corrective and does not support a strong break lower; the result was a strong reversal higher from our targets as expected. If you noticed the AUDUSD pair failed to take out its previous lows so held key support, as well as oil holding the $102 area. As long as you see other risk markets support US stocks I don’t see any evidence to support a bearish stance atm.
Oil and AUDUSD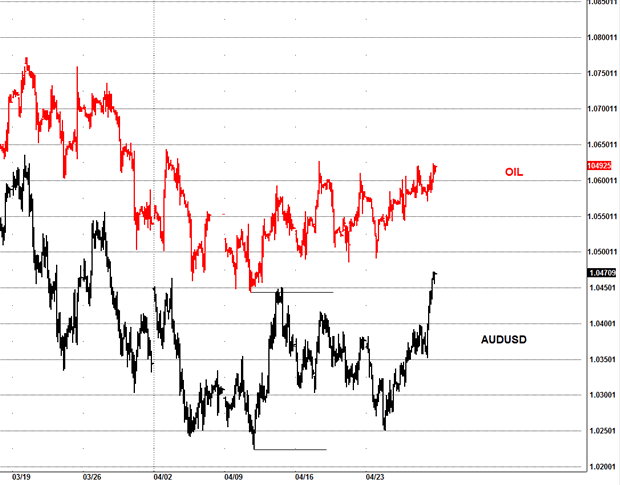
Simply put the bears never stood a chance, the trend remains up since the Oct 2011 lows and we need to respect that, the low is likely in although there is an alternative ideas in the markets to test those lows again we saw in the week, but that will only come on a breakdown of previous support areas.
NDX
Following on from last week’s report, we indeed got the new low I was expecting and covered our shorts at the lows, the NDX hit my target and reversed, thus confirming the decline likely completed and the bulls take the markets higher.
The target was 2636 as posted from last week’s report, it got triggered and the bulls really did make a stand, one would think they got my “special” areas in advance.
To Read More CLICK HERE

By John Mauldin
There are times, my friends Michael Lewitt and Dr. Lacy Hunt agreed today at lunch, when the study of economics is best informed by a sound knowledge of history. Indeed, Michael’s son wants to follow his father into the finance world, and Michael is starting him off in history. I have spent hours listening to Lacy stroll through economic history, detailing the path of economic thought from Fisher to Kindleberger to Minsky. The last few days have been one of those times when I realized how much I don’t know and how much more there is to learn. Not only Lacy and Michael are here in Florida, but a long list of bright minds to learn from. James Rickards, who has recently written the tour de force book Currency Wars, Harry Dent, Doug Casey, Porter Stansberry, Greg Weldon, and John Williams of Shadow Stats, with whom I look forward to meeting (do I have questions for him!). And so many more.
And it is because I simply have to stop, listen and learn (and visit with friends) that this week I will kind of take the weekend off and instead send you one of the more remarkable essays I have read in a long time. It is a speech by Jim Grant to the New York Federal Reserve. The always erudite Grant takes us back in time to the very beginnings of the Federal Reserve, to show us how far we have strayed from the original intent. I really think you should read this. I have perused it several times and intend to read it yet again – and then some more.
Grant argued for a return to the gold standard in the very halls of fiat money! It seems the New York Fed is asking some of its critics to come and speak. I have read some of the speeches, but this is the best so far for several reasons, not the least of which is that it contains some very funny lines. If you find yourself invited to the lion’s den, Grant seems to think it is best to make fun of their teeth! You really do have to admire his courage. I think I would be a little concerned that I might be on the menu!
I will make a few comments at the end of his speech and then note some upcoming speaking events in Atlanta and Philadelphia. But let’s jump straight away into today’s main event.
A Piece Of My Mind
By Jim Grant
My friends and neighbors, I thank you for this opportunity. You know, we are friends and neighbors. Grant’s makes its offices on Wall Street, overlooking Broadway, a 10-minute stroll from your imposing headquarters. For a spectacular vantage point on the next ticker-tape parade up Broadway, please drop by. We’ll have the windows washed.
You say you would like to hear my complaints, and, on the one hand, I do have a few, while on the other, I can’t help but feel slightly hypocritical in dressing you down. What passes for sound doctrine in 21st-century central banking—so-called financial repression, interest-rate manipulation, stock-price levitation and money printing under the frosted-glass term “quantitative easing”—presents us at Grant’s with a nearly endless supply of good copy. Our symbiotic relationship with the Fed resembles that of Fox News with the Obama administration, or—in an earlier era—that of the Chicago Tribune with the Purple Gang. Grant’s needs the Fed even if the Fed doesn’t need Grant’s.
To Read More CLICK HERE


There’s an old saying that goes something like this: “In the valley of the blind, the ‘one-eyed man’ is king.”
If you seriously consider what I’m about to show you, this old saying could well ring true for your investment portfolio at the end of this year. Perhaps even before. Let me explain…
At roughly $2.41 per million Btu, U.S. natural gas prices are in the dumpster. The truth is, they’ve been declining for years. But the recent shale gas boom accelerated their fall. Now they’re the lowest they’ve been in over a decade.
If it gets any cheaper, the companies that supply it will be paying you to take it. You see, they have a huge problem.
They have to keep producing in order to generate revenue, even in the face of declining prices. The problem here in the United States is that supply exceeds demand by a wide margin. And it’s getting wider all the time.
Why? Stores of natural gas at record levels… A mild winter… New wells coming online every month…
No wonder it’s eviscerating shares of explorers and producers. Take a look at the six-month chart for Chesapeake Energy Corporation (NYSE: CHK), for instance.
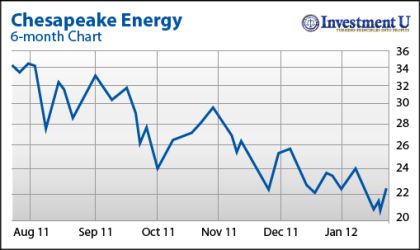
It looks like the first big drop on a roller-coaster. Shares are off 38% since last July.
To Read More CLICK HERE
By: Eric Sprott & David Baker
This may not come as a surprise, but we’re still not seeing it. We’re not seeing a US recovery.
Here we are, well into 2012, and the fact remains that the US housing situation is still a bust. There is simply no housing recovery happening in the United States. US New Home Sales fell for the fourth time in a row month-overmonth in March, representing a seasonally-adjusted annual rate of 328,000, down from 353,000 in February.1 Do you know what the annual rate of New Home Sales was back in 2006? About 1.21 million.2 No recovery there.
Same goes for US Existing Home Sales, which fell unexpectedly by 2.6% in March to an annual rate of 4.48 million units.3 Again – would you care to know where they were in the same month back in 2006, before the financial system fell apart? Approximately 6.92 million units.4 No recovery there either.
Then there’s unemployment. Judging by all the recent earnings-release cheerleading, March’s jobs numbers seem to have been forgotten, but they were plainly weak. The US Labor Department showed US hiring slowing to a mere 120,000 new jobs in March, below expectations of 200,000+.5 That’s not a recovery. That’s simply weak data.
Same goes for the most recent jobless claims numbers, which have been running above 380,000 for the last two weeks, above the 375,000 threshold that supposedly signals future unemployment increases.6 Again – this is not positive data, this is weak data. How high will it have to go before the economists admit that it’s weak? 400,000? 425,000? We’re asking – we’d like to know.
Then there are US tax receipts, which continue to point in the same direction. If the US is recovering so strongly, then why are employment tax receipts only up 2%? ($484 billion fiscal year-to-date as of March 2012 vs. $475 billion over the same period to March 2011).7 A 2% increase is explainable by inflation alone, which was last reported running at 2.7% according to the Bureau of Labour Stastics.8 Shouldn’t the tax receipts be much higher than that? Wasn’t unemployment down so far this year? As the Associated Press plainly states, “The unemployment rate has fallen to 8.2% in March [2012] from 9.1% in August [2011]. Part of the drop was because people gave up looking for work. People who are out of work but not looking for jobs aren’t counted among the unemployed.”9 Oh! Sorry,… now the numbers make more sense. There hasn’t been any net new employment at all. Question: if everyone “gives up” looking for work next week, will the US unemployment rate go to zero? We’re asking – we’d like to know.
Other economic indicators exhibit the same downward momentum that the pundits are loath to acknowledge. For example, the Economic Cycle Research Institute’s (ECRI) Weekly Leading Indicator index, which had been rising from its 2011 lows earlier this year, has resumed its downtrend in April.10 More recently, US Durable Goods Orders were revealed to have dropped 4.2% in March, representing the largest decline since January 2009.11 To top it all off, China’s most recent Purchasing Managers Index (PMI) indicated that China’s manufacturing activity has now been in contraction for six months in a row.12
To Read More CLICK HERE
FIGURE 1: SPANISH BANKS – DEPOSIT AND EUROSYSTEM FUNDING (% OF TOTAL ASSETS), 1999 – FEB 2012


-
I know Mike is a very solid investor and respect his opinions very much. So if he says pay attention to this or that - I will.
~ Dale G.
-
I've started managing my own investments so view Michael's site as a one-stop shop from which to get information and perspectives.
~ Dave E.
-
Michael offers easy reading, honest, common sense information that anyone can use in a practical manner.
~ der_al.
-
A sane voice in a scrambled investment world.
~ Ed R.
Inside Edge Pro Contributors

Greg Weldon

Josef Schachter

Tyler Bollhorn

Ryan Irvine

Paul Beattie

Martin Straith

Patrick Ceresna

Mark Leibovit

James Thorne

Victor Adair