
Stocks & Equities
All eyes are on the Federal Reserve this week as they convene their latest Open Market Committee meeting on Tuesday and Wednesday to discuss monetary policy. A primary focus of investors is whether the Fed will hint about any future policy action.
Such news is important, as the stock market has proven keenly sensitive to the influences of monetary stimulus since the outbreak of the financial crisis several years ago. But while another round of policy support may help stabilize the stock market at current levels, Fed stimulus alone may no longer be enough to drive stocks to new highs. Moreover, it may now be insufficient to offset the forces of a major downside shock.

A reflection on the movements of the stock market since October 2011 is informative in this regard. The U.S. stock market as measured by the S&P 500 Index (SPY) initially exploded higher at the launch of Operation Twist. Having touched a fresh cycle low at 1075, the stock market suddenly reversed and didn’t look back for the entire month. From the second day to the second to last day of October, the stock market advanced roughly +17%. But what is surprising is that since the end of October, the net impact of Operation Twist by itself has actually been fading lower from its peak.
The first sign of breakability associated with Operation Twist came on Halloween, as the market became spooked by the collapse of MF Global. By Thanksgiving, the U.S. stock market had bled nearly -10% and was only +5% above the early October lows. The market response to the MF Global bankruptcy was notable, for stocks prior that point had shown the resilience to continue rising during periods of Fed stimulus regardless of the risk. Such was not the case in November 2011.
Stocks thrashed back and forth into December until the week before Christmas. It was at this point on December 21 that the European Central Bank executed the first of its two planned Long-Term Refinancing Operations (LTRO) to support the at risk banking system across the continent.
It was upon the launch of LTRO that the stock market propelled itself into another euphoric melt up phase. This continued until the second planned LTRO on February 29. Along the way, the stock market advanced +14% in a virtually uninterrupted rally that included stocks rising on nearly 70% of trading days over this time period. This is well above the historical average of 52% and is exceptionally rare to occur over any sustained period of market history.
To Read More CLICK HERE

It appears that when it comes to mocking consensus groupthink emanating from lazy career ‘financiers’ who seek protection from their lack of imagination and original thought, ‘creation’ of negative alpha and general underperformance (not to mention reliance on rating agencies, only to jump at the first opportunity to demonize the clueless raters), in the sheer herds of other D-grade asset “managers” (for much more read Jeremy Grantham explaining this and much more here), David Rosenberg enjoys even more linguistic flexibility than even us. Case in point, his just released trashing of the latest Barron’s permabull groupthink effort titled “Outlook: Mostly Sunny.” And just as it so often happens, no sooner did those words hit the cover of that particular rag, that it started raining, generously providing material for the latest “Roasting with Rosie.”
From Gluskin Sheff:
Consensus Creates A Contrary Call
When the experts and forecasts agree, something else is going to happen.”
Bob Farrell’s investment rule #9.
Did the folks at Barron’s intentionally lob a ball right into my wheelhouse? The front cover says it all — Outlook: Mostly Sunny. Check it out. Any perma-bull out there right now should be trembling by the front cover effect. This is no different than the fabled Death of Equities in the 1979 Businessweek, the Economist front cover calling for oil prices to basically head towards zero circa 1998, and the front cover of Barron’s a decade ago saying That’s All, Folks when it came to interest rates supposedly bottoming out. Come to think of it, Barron’s ran with Dow 15,000 on its front cover back on February 13, 2012, and last we saw, at the nearby peak in early April, the blue-chip index closed 1,700 points below that threshold (and has been roughly flat since the date of that article).
What Barron’s is referring to here is the latest Big Money poll that it conducts semi-annually. The actual title of the article (on page 25) is Reason to Cheer. Reason to cheer? About what? Margins being squeezed? Profit growth practically evaporating? Earnings downgrades still significantly outpacing upgrades? The recovery so excruciatingly slow that senior members of the Fed are contemplating QE3? Insolvency of Spanish banks? Hard landing risks in China? The 2013 fiscal cliff? The fact that over 60% of the data in the past two months have surprised to the downside?
The results of the Big Money Poll were startling:
55% of the portfolio managers are either bullish or very bullish. Only 14% are bearish or very bearish.
Financials and technology are the favourites, with 31% citing both as being the top performers in the next six to 12 months.
Favourite stock … Apple (surprised?).
Utilities are seen as the worst performer — by 30% of those polled.
With respect to Treasuries, 81% are bears, just 2% are bulls. How can yields rise in such a lopsided environment? I mean, who is there left to sell? This is a classic bullish contrary signpost.
Bonds of all types are detested — 33% bearish on corporates while 14% are bullish; 35% are bearish on munis while only 12% are bullish.
But … 41% are bulls on real estate; only 10% bears are left.
For gold, 39% bears and 30% are bulls. That is great— the one asset class that has been in a secular bear market for 12 years is adored (equities), and the two that have actually made you money over this time span (the bond- bullion barbell) is to be avoided. Go figure!
To Read More CLICK HERE


By James Hamilton
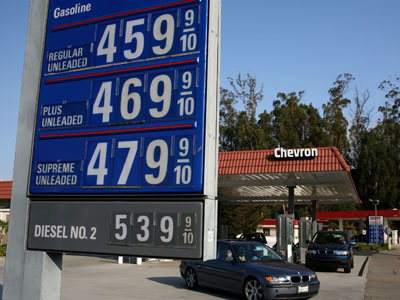
Joseph P. Kennedy II, former Congressional Representative from Massachusetts, and founder, chairman, and president of Citizens Energy Corporation, has a proposal to make energy affordable for all. All we have to do, Kennedy claims, is “bar pure oil speculators entirely from commodity exchanges in the United States.”
Writing in the New York Times last week, Joseph Kennedy (D-MA) explained why he believes that speculators are responsible for the high price that we currently have to pay for oil:
Today, speculators dominate the trading of oil futures. According to Congressional testimony by the commodities specialist Michael W. Masters in 2009, the oil futures markets routinely trade more than one billion barrels of oil per day. Given that the entire world produces only around 85 million actual “wet” barrels a day, this means that more than 90 percent of trading involves speculators’ exchanging “paper” barrels with one another.
It’s true that most buyers of futures contracts don’t actually want to take physical delivery of oil. If I buy the contract at some date, I usually plan on selling the contract back to somebody else at a later date, so that I leave the market with a cash profit or loss but no physical oil. But remember that for every buyer of a futures contract, there is a seller. The person who sold the initial contract to me also likely wants to buy out of the contract at some later date. I buy and he sells at the initial contract date, he buys and I sell at a later date. One of us leaves the market with a cash profit, the other with a cash loss, and neither of us ever obtains any physical oil.
Let’s take a look, for example, at NYMEX trading in the May crude oil futures contract. A single contract, if held to maturity, would require the seller to deliver 1,000 barrels of oil in Cushing, OK some time in the month of May. Last Friday, 227,000 contracts were traded corresponding to 227 million barrels of oil, which is indeed a large multiple of daily production. But it is worth noting that at the end of Friday, total open interest– the number of contracts people actually held as of the end of the day– was only 128,000 contracts, much smaller than the total number of trades during the day, and not much changed from the total open interest as of the end of Thursday. Many of the traders who bought a contract on Friday turned around and sold that same contract later in the day. If the purchase in the morning is argued to have driven the price up, one would think that the sale in the afternoon would bring the price back down. It is unclear by what mechanism Representative Kennedy maintains that the combined effect of a purchase and subsequent sale produces any net effect on the price. But the only way he gets big numbers like this is to count the purchase and subsequent sale of the same contract by the same person as two different trades.
It’s also worth noting that on that same day, there were 146,000 May natural gas contracts traded, which if held to maturity would call for delivery of natural gas at Henry Hub in Louisiana. A single contract represents about 10 million cubic feet, so Kennedy’s calculations would invite us to compare the 1,146 billion cubic feet of “paper” natural gas traded on Friday with the total of 78 billion cubic feet of natural gas that the U.S. physically produced on an average each day in 2011. Once again, the vast majority of Friday’s natural gas futures trades were matched by an offsetting trade during the same day so as to have little effect on end-of-day open interest.
By what mysterious process can all this within-day buying and selling of “paper” energy be the factor that is responsible for both a price of oil in excess of $100/barrel and a price of natural gas at record lows below $2 per thousand cubic feet? I suspect the reason that Kennedy does not explain the details to us is because he does not have a clue himself.
To Continue Reading CLICK HERE

He roller coaster
He got early warning
He got muddy water
He one Mojo filter
He say one and one and one is three
Got to be good looking
Cause he’s so hard to see
Come together right now
Over me
Come together, yeah
Come together, yeah
Come together, yeah
Come together, yeah
Come together, yeah
Come together, yeah
Come together, yeah
Come together, yeah
Come together, yeah
Come together, yeah
-The Beatles
It seems the European Central Bankers didn’t read the latest issue of Institutional Investor. Had they perused the pages, they may have stumbled on an acceptable strategy from former Goldman Sachs managing partner slash US Treasury Secretary slash Citigroup chairman, Robert Rubin. In the words of writer Ben Baris, speaking on the subject of restoring the US economy Rubin said, “A potent combination of political will and the legislative agenda must come into alignment and rejuvenate Washington in order to achieve any goals.”
Funny, later in the article Rubin criticized the Europeans for how they were handling their crisis (implying their stop-and-go tactics should be avoided in the US.)
I would have liked to have been sitting with Sir Robert around an infinity edge pool at some Caribbean getaway this weekend when the European Central Bank tore away their metaphorical WWRRD bracelets in protest of added bureaucratic pressure from “above.”
The G-20 met this weekend to approve additional funding of the IMF that could backstop, particularly with respect to Europe, any nation that might come under pressure during a critical period of economic reforms. Member countries were heard to be singing a cappella to The Beatles hit song, Come Together, which explained comments after the meeting that suggested most finance ministers were on board with this move to bolster IMF resources.
That is except for two relevant parties: the US (who did not want to ask Congress for any more money) and the European Central Bank.
The IMF expressly asked the ECB to cut interest rates back further and ready the liquidity spots in hopes of further relieving economic pressure. And the US’s reluctance to probe Congress didn’t stop Treasury Secretary Geithner from laying responsibility on the back of the ECB. Even though the IMF’s stated goal of raising an additional $400+ billion was achieved this weekend, there is plenty of negativity surrounding the ECB’s discretion.
ECB executive board member Joerg Asmussen
“We think we have done our task in the last months by quite a number of standard and non-standard measures we have taken,”
ECB Vice President Vitor Constancio
“The stance of our monetary policy is fully appropriate … It’s appropriate to the situation and the prospects that we (face) right now.”
ECB’s Jens Weidmann
“You cannot solve structural problems in the economy with instruments of the monetary policy.”
“Higher interest rates are also an incentive to restore lost confidence. The common monetary policy must not be used to compensate for shortfalls in reforms.”
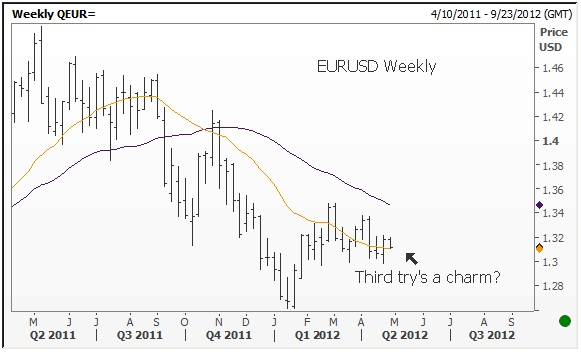
The euro is under pressure this morning. [A major slump in German PMI manufacturing – 46.3 vs. expectations of 49.0 – is not helping, especially since recent sentiment numbers out of Germany have been cause for optimism.]
To Read More CLICK HERE


-
I know Mike is a very solid investor and respect his opinions very much. So if he says pay attention to this or that - I will.
~ Dale G.
-
I've started managing my own investments so view Michael's site as a one-stop shop from which to get information and perspectives.
~ Dave E.
-
Michael offers easy reading, honest, common sense information that anyone can use in a practical manner.
~ der_al.
-
A sane voice in a scrambled investment world.
~ Ed R.
Inside Edge Pro Contributors

Greg Weldon

Josef Schachter

Tyler Bollhorn

Ryan Irvine

Paul Beattie

Martin Straith

Patrick Ceresna

Mark Leibovit

James Thorne

Victor Adair