
Timing & trends
Submitted by
Eurozone: The “Lull” in the Eurozone debt crisis created by the LTRO loans is over as Spanish interest rates rise and European stocks (especially in periphery countries) fall.
The Eurozone debt crisis is a slow motion train wreck…the “authorities” have been merely postponing the inevitable…which is that “way more money has been borrowed than will ever be repaid.”
Austerity produces weaker economies that will not generate the revenue needed to cover debts and deficits and the social costs that come with weaker economies.
More lending, made on the premise that it will start a virtuous circle of strengthening economies and reduced deficits, doesn’t work and only makes the un-payable mountain of debt bigger.
The only way out for the over-indebted periphery countries is to “write off” huge debts…to default…to withdraw from the common currency…to declare bankruptcy…but this is what the entrenched Euro elite is so determined to avoid…so they postpone the inevitable…perhaps hoping for a miracle…perhaps believing that a full blown financial crisis will pave the way for political union…but the Germans may have second thoughts on that after their experiences with the expense of the East-West German political union….
Euro elections: the first French elections are this Sunday…with the run-off elections on May 6. Sarkozy is likely to lose to Hollande… the socialist who wants to “soak” the rich, lower, yes lower, the retirement age, re-negotiate treaties and basically do the socialist “tax and spend” program. He wants to change the mandate of the ECB from controlling inflation to promoting growth…expect the Germans to not be amused…a breakdown of political cooperation could lead to greater troubles in Eurozone. The Germans are facing a Hobson’s choice: blow up Europe…or pay an un-Godly price to keep it together….
To Read More CLICK HERE


Axel Merk, Merk Funds
If running out of your own money wasn’t bad enough, policy makers are increasingly spending other peoples’ money to bail their country out. At the upcoming G-20 meeting, finance ministers from around the world will contemplate an increase to the resources of the International Monetary Fund (IMF). At stake for politicians is whether they can continue to do what they know best – to play politics. In contrast, at stake for investors may be whether currencies will retain their function as a store of value.
One of the major concerns is Spain’s regional government debt. Spain consists of 17 autonomous regions, whose total debt almost doubled in the past three years, due to economic recession and a housing market collapse. In many ways, Spain reflects a microcosm of how the Eurozone as a whole is structured:Let’s highlight Spain, as the country may be the key to understanding how dynamics may play out. Last November, Spaniards voted for change by electing conservative Prime Minister Rajoy, handing him an absolute majority in parliament, displacing the previous, socialist government. The election may cause former British Prime Minister Thatcher to change her view, that socialism is doomed to fail, as ultimately you run out of other people’s money. It doesn’t take a socialist to run out of money. In the case of Spain, if you run out of your own people’s money, there may always be other peoples’ money.
Spanish regions have the power to issue public debt. The central government has little ability to interfere with regional government spending and is prohibited by Spanish law to bailout regional governments.
While regions enjoy high autonomy on spending, the central government retains effective control over regional government revenue.
Spain has its own peripheral problems: the most indebted region, Catalonia, recorded 20.7% debt-to-regional-GDP ratio and 3.6% deficit-to-GDP ratio in 2011. Its 10-year bond yield recently breached 10%, far beyond the yield on 10-year Spanish government bonds, which yield around 6%. In 2011, the total debt of 17 regional governments rose to €140 billion, accounting for 13.1% of Spain’s GDP. This number is up from 6.7% by 2008.
Spanish law forbids the central government from rescuing regional governments (in much the same way that the Maastricht Treaty prohibits bailouts of EU countries). In practice, the central government appears to have implicitly helped Valencia, Spain’s 2nd most indebted region, with a €123 million loan repayment to Deutsche Bank.
More broadly known are Spain’s banking woes. Unlike much of Europe, a housing boom propelled much of Spain’s recent growth, causing Spain’s regional banks, in particular, to become overly exposed to the mortgage sector. Spain’s banks are very dependent on liquidity provided by the European Central Bank (ECB). The recent 3 year long-term refinancing operation (LTRO) by the ECB at first took pressure of the Spanish banking system, but has since been seen more critically, as Spain’s banks may be using the liquidity to buy Spanish government debt, thus increasing inter-dependency and potentially making nationalization of Spanish banks (read: the Spanish government taking on the obligations of its banks) more, rather than less likely.
To Read More CLICK HERE

By: Andre Gratian
SPX STILL IN CORRECTION MODE
Precision timing for all time frames through a multi-dimensional approach to technical analysis: Cycles – Breadth – P&F and Fibonacci price projections and occasional Elliott Wave analysis
“By the Law of Periodical Repetition, everything which has happened once must happen again, and again, and again — and not capriciously, but at regular periods, and each thing in its own period, not another’s, and each obeying its own law… The same Nature which delights in periodical repetition in the sky is the Nature which orders the affairs of the earth. Let us not underrate the value of that hint.” ~ Mark Twain
Current Position of the Market
SPX: Very Long-term trend – The very-long-term cycles are down and, if they make their lows when expected (after this bull market is over) there will be another steep and prolonged decline into late 2014. It is probable, however, that the steep correction of 2007-2009 will have curtailed the full downward pressure potential of the 120-yr cycle.
SPX: Intermediate trend – The intermediate uptrend is still intact, but a short-term top is already in place.
Analysis of the short-term trend is done on a daily basis with the help of hourly charts. It is an important adjunct to the analysis of daily and weekly charts which discusses the course of longer market trends.
Daily market analysis of the short term trend is reserved for subscribers. If you would like to sign up for a FREE 4-week trial period of daily comments, please let me know at ajg@cybertrails.com”>
Market Overview
The SPX remains in an unconfirmed short-term decline. It will be confirmed when it trades lower than the recent 1357 low. Until it does, there is a possibility that the index is making a consolidation pattern in preparation for continuing its bullish uptrend.
I rate the odds of that possibility as very low. On the Point & Figure chart, the trading pattern which resulted in a high of 1422 is clearly a distribution phase which stands unresolved in spite of the drop to 1157. In order to fully unleash the potential that was built up during these 4 weeks of distribution, the SPX would have to drop to 1342 at a bare minimum, most likely to about 1300, and perhaps to as low as 1345. The stock market moves forward in a continual process of accumulation-uptrend, distribution-downtrend. Each period of accumulation and distribution stores energy which is released in the following move. This happens in all time frames and is one of the basic structural mechanisms by which the stock market progresses.
When the SPX dropped below 1393, it broke below a support level that has now become a strong resistance area, and which it has tried unsuccessfully to overcome for the past two weeks. During this time, the index has constructed what appears to be another phase of distribution which closely resembles the one formed at the higher level, and it looks nearly complete. If that’s the case, the decline which started from 1422 is about to resume. The next few days of trading should be decisive.
There is an important cycle bottoming at the end of the month which should play an important role in the near-term market action as it applies more and more downward pressure with each passing day. Since the beginning of the bull market in 2009, like clock-work it has brought about a significant decline in the stock market when making its low. It would be more logical to expect a recurrence of that pattern than to ignore it. Its last bottom came in early October of last year in conjunction with the 3-yr cycle, and it is again due at the end of April.
If the current market activity is being interpreted correctly as a corrective pattern which is almost complete, the resumption of the decline should occur during the coming week.
Chart analysis
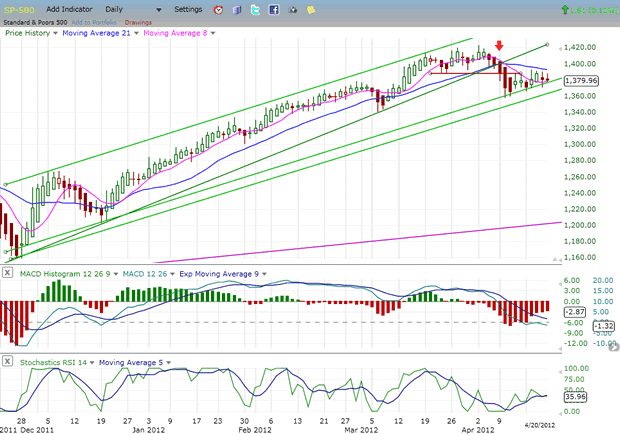
We’ll start with the Daily Chart of the SPX. Let’s first look at the structure. From the 1159 low in November of last year, the index progressed to 1422 in what appears to be 5 waves before breaking its trend line in early April. This caused a decline to 1357 and to the bottom of the rising channel in which it is still confined. Until it comes out of that channel on the downside, the SPX is still in an uptrend.
Instead of rebounding smartly, as it did the last time that it touched its trend line before breaking it, the price activity for the past two weeks has consisted of crawling along the bottom channel line. This is not a strong pattern! This crawling action, more often than not, results in a break of the trend line which is acting as support, and in a continuation of the downtrend.
To Read More CLICK HERE

By Sumit Roy
The volatile WTI-Brent spread fell to multimonth lows, but surging production in the U.S. makes further narrowing challenging.
The Department of Energy reported this morning that in the week ending April 13, U.S. crude oil inventories increased by 3.9 million barrels, gasoline inventories decreased by 3.7 million barrels, distillate inventories decreased by 2.9 million barrels and total petroleum inventories decreased by 2.2 million barrels.
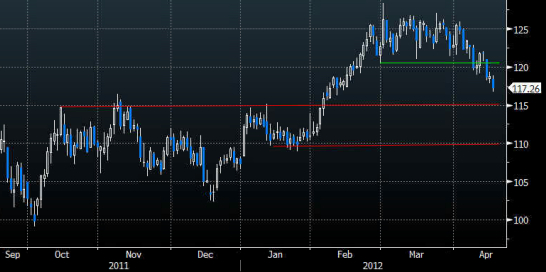
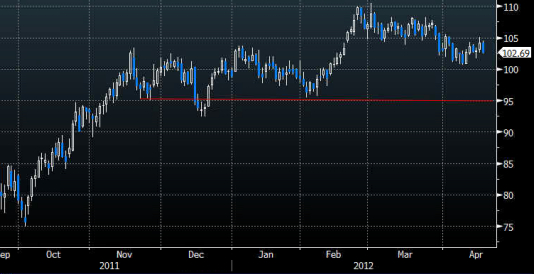
As expected, Brent prices continued to drift lower over the past week after breaking below the key $121 support level amid economic concerns and receding Iranian tensions. But in an interesting twist, WTI prices actually rose in the period.
BRENT
WTI
The highly volatile spread between the two benchmarks narrowed to $14 from $17.50 last week and more than $20 at the beginning of the month. That puts it at the smallest level since Feb. 1.
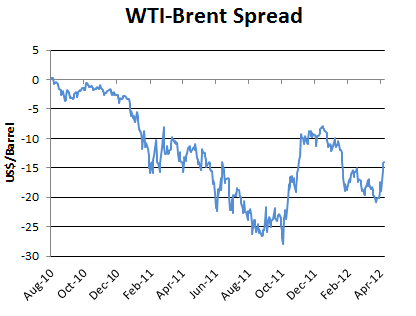
The catalyst for this latest move in the spread was news that the operators of the Seaway Pipeline plan to reverse its flows earlier than expected — at the end of May, rather than June 1. As we’ve written about in the past, the Seaway Pipeline was designed to send crude oil from the Gulf Coast to Cushing, Okla. But surging production in Canada and the U.S. Midwest has created a glut of crude in the region, depressing prices for local benchmarks such as WTI. To reduce the gap between crude such as WTI and global benchmarks such as Brent, transportation capacity out of the Midwest needs to be increased. The reversal of the Seaway Pipeline — after which crude will flow from Cushing to the Gulf Coast — satisfies that need. About 150 Kbbl/d of the pipeline’s capacity is set to be reversed late next month, while another 250 Kbbl/d may be reversed by early 2013. Yet while the reversal of Seaway is a step in the right direction, the market anticipates it alone will not alleviate the Cushing glut completely. Still-wide spreads between WTI and Brent across the futures curve is evidence of that. Rapidly increasing output in the Midwest and Canada necessitates steady increases in transportation capacity. Declining demand across the United States makes the supply and demand balance even more lopsided.
To Read More CLICK HERE
By David Galland
Dear Reader,
If history has taught one certain lesson, it is that the less fettered an economy, the better humankind is able to do what it does best: run from trouble and run toward opportunity. In this way mistakes are quickly resolved and progress assured.
Conversely, the deeper the muck of regulation, mandates, taxes, subsidies and other bureaucratic meddling, the slower we humans are in following our natural instincts until the point that progress is slowed or even stopped.
It is said that history doesn’t repeat itself, but it often rhymes. In the current circumstances, it appears that enough time has passed that current generations have completely forgotten the critical connection between the ability of humans to freely pursue their aspirations and economic progress.
You can see this ignorance in the popular demand for even more, not less, meddling in the affairs of humankind. Should this trend continue – and for reasons I will touch on momentarily, I firmly believe it will – then the aspirations of the productive minority will soon be dampened by ever higher taxes and other attempts to “level the playing field” and the global economy, already in tatters, will fall off the edge.
There is no more timely nor acute example of this growing trend than what is currently going on in France. I refer, of course, to the first round of the presidential election process, scheduled for this weekend.
In France, if no candidate attracts no better than 50% of the vote, then the two leading candidates go to a decisive runoff vote, this time around to be held on May 6.
The current president, Nicolas Sarkozy, a conservative in name only, was running at a fairly steady gait toward re-election (thanks to the head start awarded all incumbents), when leading socialist candidate Francois Hollande came out with a proposal to tax anyone with an annual income of over one million euros at a rate of 75%. He also promised to add a tax on all financial transactions and increase taxes on France’s biggest companies to 35% – securing bragging rights as levying the world’s third-highest corporate taxes, the US being #1. This all on top of a 25% VAT, one of the world’s highest. By some calculations, the result of Hollande’s new taxes is that effectively 100% of all incomes over one million euros will now be stripped away by the state.
For good measure, Hollande also promised to reverse the recent modest increase in retirement age from 60 to 62 pushed through by Sarkozy. While I am sure it is mere coincidence, I found it noteworthy that Mssr. Hollande’s campaign slogan is “Change – Now!”
Remarkably, at least for those with some small understanding of economics, as a result of leaning into the microphone with these proposals Hollande has galloped ahead of all other potential contenders and is now projected to finish nose by nose with Sarkozy this weekend.
After which the also-rans will be removed from the race, freeing their supporters to share their affections elsewhere. Given that the leading contender for third place with an estimated 14% of the vote is one Jean-Luc Mélenchon – charitably categorized as “far left”, a label that can be applied to most of the other candidates – it is projected that the “conservative” Mssr. Sarkozy will go down in double-digit flames come May 6.
Bringing to mind the prophetic utterance of Louis XV: “Après moi, le deluge.”
The deluge in Louis’ case manifested as the murderous affair commonly known as the French Revolution. In the case of Mssr. Hollande taking up residence in the Palais de l’Élysée, the deluge is likely to manifest in the form of rising interest rates as investors look to protect against an acceleration in the country’s debt to GDP ratio, already projected to hit almost 90% this year, exacerbated by a flight of capital, investors, entrepreneurs and large businesses.
To Read More CLICK HERE

-
I know Mike is a very solid investor and respect his opinions very much. So if he says pay attention to this or that - I will.
~ Dale G.
-
I've started managing my own investments so view Michael's site as a one-stop shop from which to get information and perspectives.
~ Dave E.
-
Michael offers easy reading, honest, common sense information that anyone can use in a practical manner.
~ der_al.
-
A sane voice in a scrambled investment world.
~ Ed R.
Inside Edge Pro Contributors

Greg Weldon

Josef Schachter

Tyler Bollhorn

Ryan Irvine

Paul Beattie

Martin Straith

Patrick Ceresna

Mark Leibovit

James Thorne

Victor Adair