
Energy & Commodities
Amidst soaring oil prices, renewable energy advocates have two eyes of the needle to pass through.
The first is that their kilowatt hour of electricity production is currently higher than energy generated from more traditional fossil fuel sources, such as coal and hydrocarbons.
The second is a technological bottleneck – how to store the energy generated by wind and solar power, which depend on natural processes that are best inconsistent.
The wind doesn’t blow 24/7 and the sun goes down.
Accordingly, storage issues of electricity generated during the peak periods of optimum natural production are the second issue of renewable power generation, how to store and consistently release that energy generated during peak periods back to the grid when the evening comes.
It appears that a team at the Massachusetts Institute of Technology has found a way to address this conundrum. If so, they have a license to print money, and savvy investors should pay close attention to the news below.


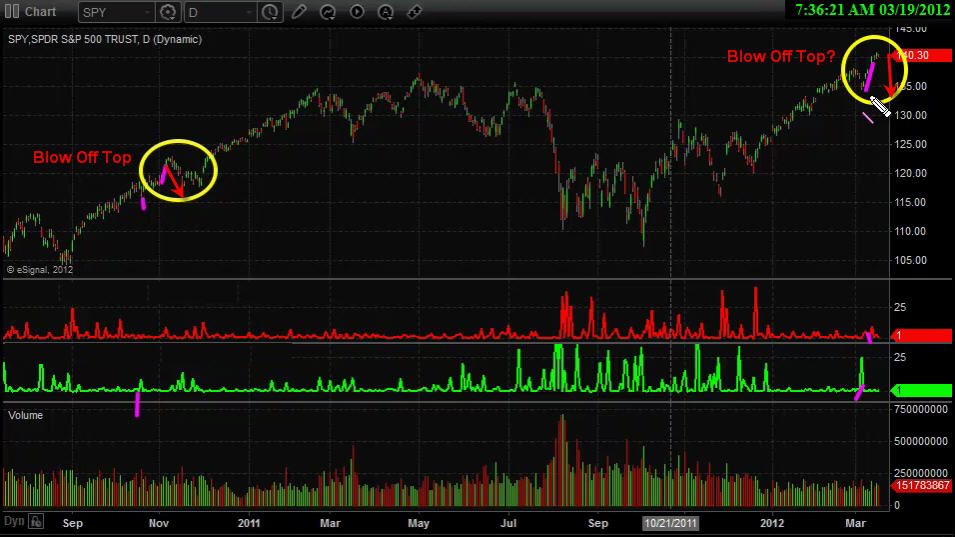
This week may provide some trading opportunities for us if all goes well now that most traders are investors are all giddy about stocks again. Last week we saw money move out of bonds and into stocks and the bullishness vibe in the air reminds of many market peaks just before a 5%+ correction in stocks.
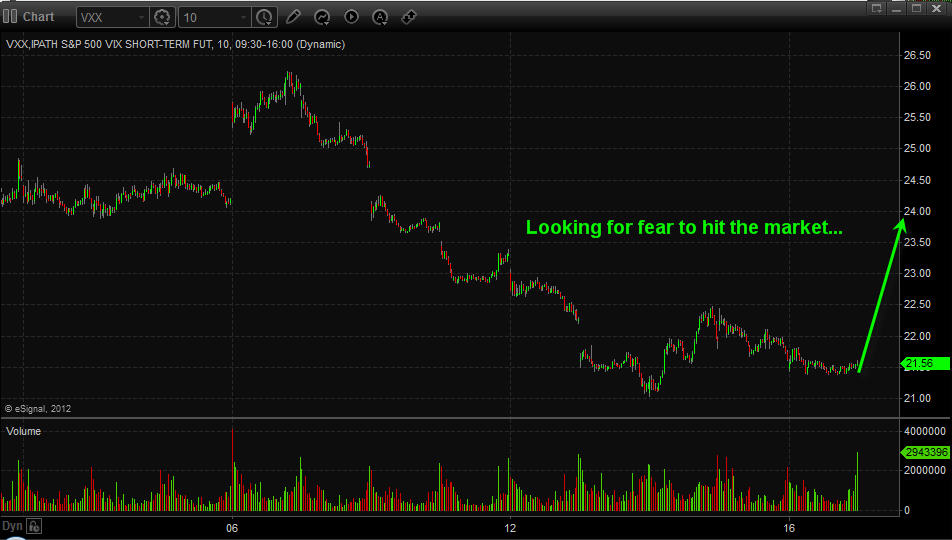
Depending how the SP500 unfolds we may be going long or short equities, long precious metals, long bonds, and our VXX trade may spike in our favor.
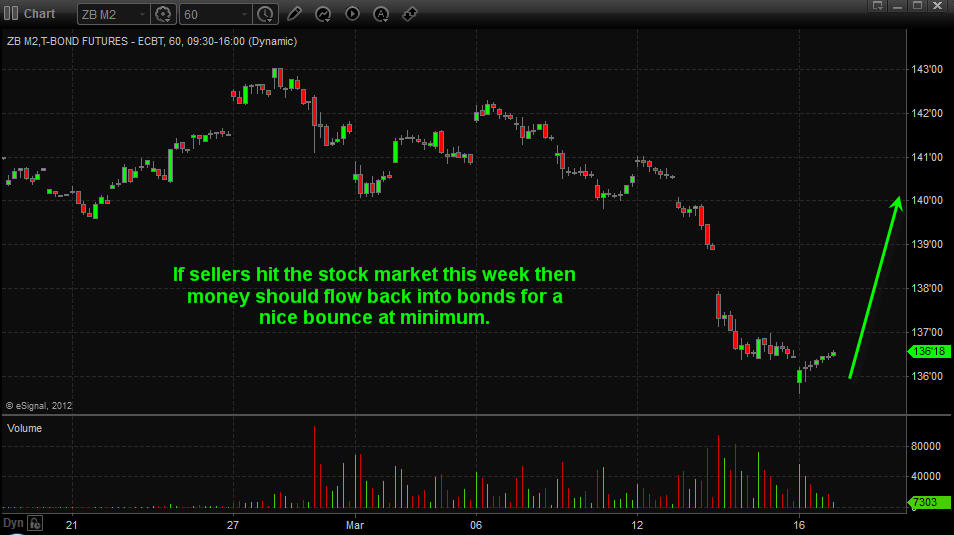
Bonds: After last week’s strong move down in bonds as the HERD moved out of bonds and into stocks it may be providing us an opportunity to catch a dip or bounce in the price of bonds. If the stock market sees strong selling this week money will run back into bonds.
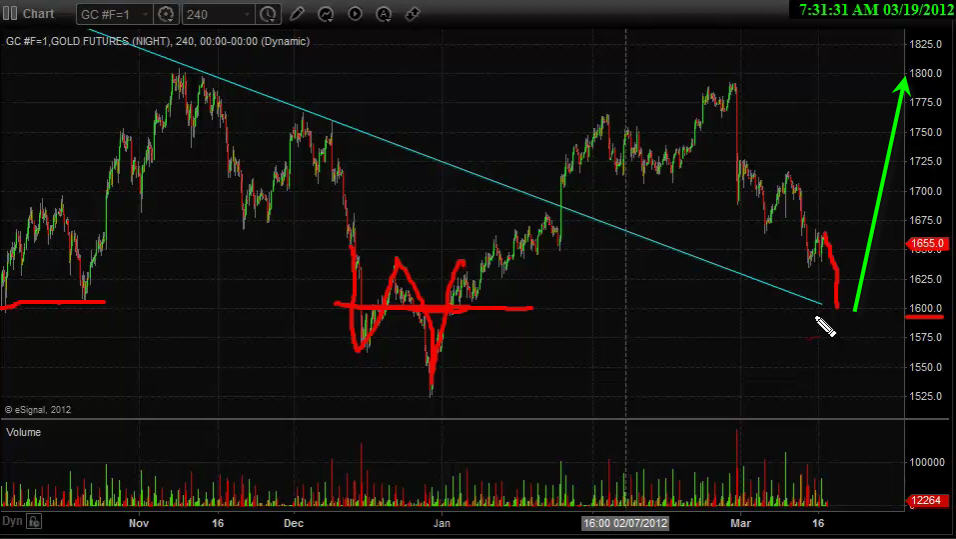
Looking at precious metals it looks as though gold, gold miners and silver may still head lower this week. The charts are still bearish and pointing to another multi percent drop in value. Gold will look bullish around $1600, Gold miners (GDX) around $48, and Silver around $30 but we need to see one more wave of strong distribution selling for that to take place.
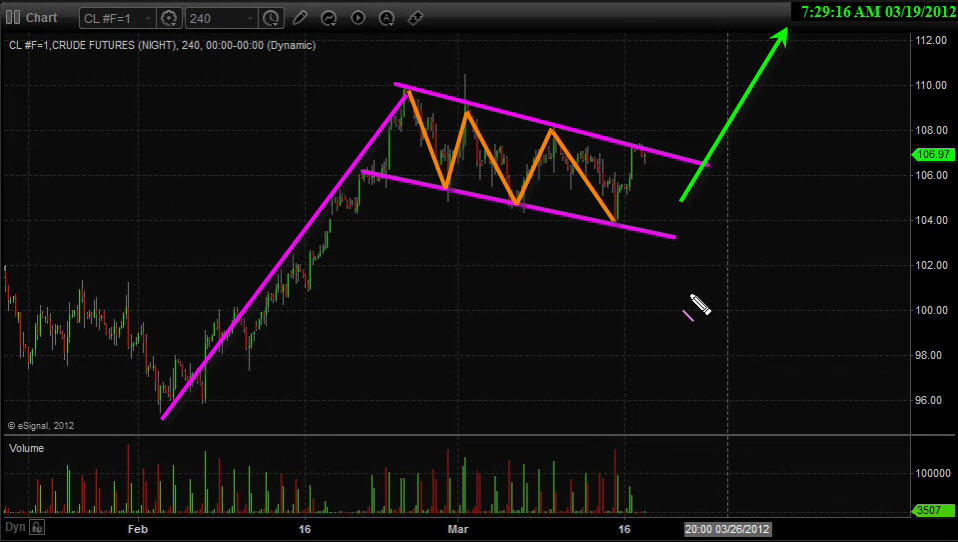
Crude oil has recovered nicely from its 5 wave correction which shook us out of the trade for a profit. I still like the chart for higher prices but with it trading at resistance and a high possibility of sellers stepping back in at this level I am not getting involved here.
The SP500 made a new high last night but has run into sellers early this morning taking prices straight back down. The chart in pre-market looks as though we will see lower stock prices later today and with any luck the fear index (VIX) will continue to rise in our favor.
Watch Live Video Analysis: http://www.thetechnicaltraders.com/ETF-trading-videos/
Chris Vermeulen
http://www.GoldAndOilGuy.com

The USD index has been trending upwards within the dark-green trend-channel since 2008, whereas major buy-signals were generated at the apex of the red triangles as thereafter the so-called „thrusts“ started.
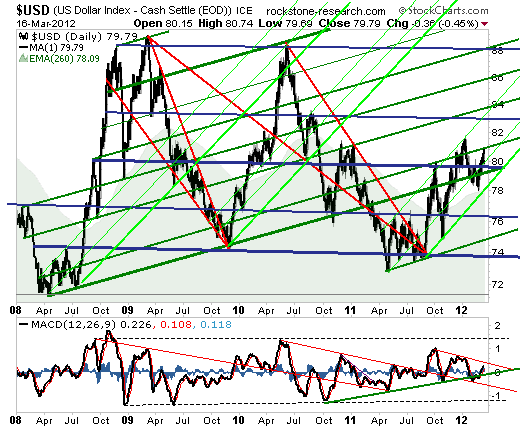
However, the goal of a thrust is to rise above the high of the triangle and transform this resistance into a new support – in order for a new upward-trend to commence thereafter.

This week’s downside breakout in the T-Bond futures market and the associated rise in the T-Bond yield has prompted us to re-visit the relationship between gold and interest rates. In the process of doing so we’ll address the question: are rising interest rates bullish or bearish for gold?
We’ll begin by noting what happened to nominal interest rates during the long-term gold bull markets of the past 100 years. Interest rates generally trended downward during the gold bull market of the 1930s, upward during the gold bull market of the 1960s and 1970s, and downward during the first 10 years of the current bull market. Therefore, history’s message is that the trend in the nominal interest rate does NOT determine gold’s long-term price trend.
The major indices reached multi-year highs with the Dow breaking solidly through the 13,000-point barrier, the SP 500 edging over 1,400, and the Nasdaq Composite ploughing past 3,000 all in the same week. The market is now up over 30% from its October 2011 bottoms and nearly reaching 4-year highs.
When you look at technicals, the market is pointing to higher prices.
We enjoyed straight days firmly above the old highs of 1370 earlier in the week, which helps confirm the recent breakout. With the recent softening of the bond market, this technical sign may help provide the catalyst for the next leg higher.
The recent sell off in the bond market means we are likely near the end of a 30-year bond rally. Over the last 30 years, rates have been going lower making the bond market a safe and profitable haven for investors – especially with the recent economic volatility.
But rates are now bouncing up from historic lows.
That means bond investors will start losing money for the first time in a LONG TIME. As stocks make new highs, naturally bond funds will see outflows and stock funds will see inflows. This fresh money coming into the stock market could help push the market up to higher highs.
(From a timing perspective, this doesn’t mean the outflows from bonds will diverge into stocks right away. We’ve also had some surprisingly strong gains over the last few weeks which may signal a short term sell off. However, over the next few months, we may see more gains in the market up until May as predicted in the paragraph from above.)
U.S. gross domestic product (GDP) expanded an average 2.4 percent per quarter in the 2 1/2 years since the recession ended in 2009. While that means the world’s largest economy hasn’t had a smaller post-recession recovery rate since at least the 1940s, it also means there is room to climb higher when compared to past events. In the 2003 bull market, GDP rose 2.7 percent on average, before the S&P 500 surged 102 percent. In the 1982 rally, the rate was 5.7 percent with equities more than tripling during that cycle.
Does that mean we’re about to see the markets climb even higher?
When you have a market that has performed so well so fast, it’s really hard to jump in. From a psychological standpoint, there is by far a better chance for the market to head down rather than up. But from a technical standpoint, the market is looking to climb higher.
If we breach the 2007 highs and stay above there, we could be in for another strong bull market rally.
The one biggest concern scaring investors is the volume in trades that has been pushing the market higher. Trading at the New York Stock Exchange declined to the lowest level since 1999 last month, with the average volume over the 50 days ending Jan. 25 slowing to 838.4 million shares. The value of stocks changing hands dropped to $24.9 billion, a 50-day average not seen since at least 2005.
Keep an eye on bond outflows – the more this sell off continues, the greater chance the volumes in the equities market will increase on the buy side.
The Bigger Picture
The problem with our market today is that investors are reacting to daily news events. I have said this many times before. If you’re a day trader and have time to trade the news, this is the market for you.
But for most investors, waking up at the break of dawn and trading in front of a computer screen all day doesn’t work. That’s when you have to look at the big picture. The big picture is the real reason the markets are moving the way they are.
Right now, the markets are moving because of easy money and slightly better economic numbers.
The world continues to print more money – whether it’s a direct infusion of liquidity, operation twist or giving banks money at negative real interest rates.
Bernanke just told us last week that interest rates will remain at current low levels until late 2014 and that operation twist will continue. That means free money for at least another two years. While he suggests that there is no QE for now, he surely did not say there won’t be another one coming. The Fed will continue to play a major role this year.
There is so much printed money being flooded into the world and the stock market likes that type of liquidity. World money supply has soared dramatically over the past two years. Eventually, the piper will need to be paid. In the meantime, this liquidity has built a foundation under the stock market.
The IMF just said Greece will need more money – even though it just got hundreds of billions weeks ago. Brazil has promised to keep interest rates low for at least another year. Every week I stress that free money will continue to pour in around the world. But do you know how bad this situation really is?
The World’s Best and Worst Example
It took the U.S., the world’s largest debtor nation, more than 200 years for its own debt to reach $1 trillion. In the past four years alone, this debt has soared by over $5 trillion.
The U.S. is currently running deficits of over $1 trillion per year, which means this number will only keep growing. The U.S. has no way to pay this debt off – not without making major cuts that will lead to a revolt. When you consider that millions of baby boomers are now reaching retirement age and will be drawing on social security, the debt levels will continue to grow even faster than it has in the past four years.
That’s a scary thought.
If you look at U.S. total debt, the U.S. is now at about 400% debt to GDP ratio. Morgan Stanley says there’s “no historical precedent” for an economy that goes over 250% of its debt to GDP ratio without a crisis or huge inflation.
So when will it be time to pay the piper? When will this all come crumbling down? I don’t know. For now, politicians will continue to do what they’re doing. They’ll continue to patch things up by printing more money to pay for expenses, including paying the interest on their loans. They’ll continue to sell their debt to any nation that can afford to buy it.
Most people think that China is the number one holder of U.S. debt and Japan number two. Those people are wrong. The number one spot belongs to the Fed – by more than half a trillion dollars.
In the long run, all of this money printing and cheap money will devalue the dollar – especially against the purchasing power of gold.
(for now, we may see strength in the dollar relative to other currencies such as the Euro but this is based on its value relative to other currencies and not the purchasing power for assets such as gold and silver)
While gold and silver have recently experienced a selloff, these represent buying opportunities in the big scheme of things. I stick with my prediction that gold will be above $2000 and silver above $40 before the year is over.
The truth will eventually unfold. Take every opportunity to protect your wealth.
In the end, “He who has the gold makes the rules.”
Until next week,


-
I know Mike is a very solid investor and respect his opinions very much. So if he says pay attention to this or that - I will.
~ Dale G.
-
I've started managing my own investments so view Michael's site as a one-stop shop from which to get information and perspectives.
~ Dave E.
-
Michael offers easy reading, honest, common sense information that anyone can use in a practical manner.
~ der_al.
-
A sane voice in a scrambled investment world.
~ Ed R.
Inside Edge Pro Contributors

Greg Weldon

Josef Schachter

Tyler Bollhorn

Ryan Irvine

Paul Beattie

Martin Straith

Patrick Ceresna

Mark Leibovit

James Thorne

Victor Adair