
Energy & Commodities
For investors seeking high potential returns and the thrill of participating in market innovation, the smallcap energy space is where it’s at. Managing Director and Co-Founder Laird Cagan of merchant bank Cagan McAfee Capital Partners has built his career by backing companies that are both filling current demand and creating new markets. In this exclusive interview with The Energy Report, Cagan shares his experiences and discusses several companies at the forefront of the energy revolution.
The Energy Report: Laird, you and your partner are active investors. You are company founders, you sit on the boards and you actually run the businesses in some cases. What kind of advantage does that give you?
Laird Cagan: We are involved with fewer portfolio companies compared to a private equity or larger firm. Because we take a very active role and are starting companies at early stages, our preference is to create a new platform company and a new business opportunity. So the benefit is that we can be very close to the company and try to launch it quickly to take advantage of whatever market opportunity we see. We have a lot of skin in the game, a lot of ownership, and we try to help guide companies in the right direction. But like private equity investors, we generally have professional managers from the industry who were either co-founders or who were brought in to lead the company on a day-to-day basis. One exception is the case of my partner Eric McAfee, who has been running Aemetis Inc. (AMTX:OTCPK) since 2005, when we started that company.
TER: What kinds of companies interest you most?
LC: For the last 10 years or so we’ve been focused on building companies in the microcap public space. We have found that this has given us better, faster access to capital for the right opportunities. Public investors don’t want to take the three, six, nine or 12 months that venture capitalists and private equity firms take to investigate opportunities before making an investment decision. Public investors want to see something faster and want an opportunity that they can understand. Typically, that means we stay away from pure-play technologies, but we do look for technologies that are creating new markets. For example, we founded Evolution Petroleum Corporation (EPM:NYSE) in 2002, when oil was $25 per barrel (/bbl). We created that company to do enhanced oil recovery using technologies like lateral drilling, which was not very prevalent back then. We could take mature oil and gas fields and extract additional reserves using new technologies. But we also benefited greatly from having oil prices go from $25–100/bbl. We founded Pacific Ethanol Inc. (PEIX:NAS) to replace gasoline additive MTBE (methyl tertiary butyl ether), which was outlawed in 2004 in California and many other states. Ethanol was the only known oxygenate that would burn gasoline cleanly enough to meet the clean air act. So, it was less of an alternative energy play than a replacement-commodity play with a West Coast focus. Those companies, Evolution Petroleum and Pacific Ethanol, got us into the energy space. With rising energy prices and a multitrillion-dollar marketplace, all sorts of new opportunities began to arise because of technology. Aemetis, originally called AE Biofuels, was focused on next-generation biofuel moving from corn to other feedstocks that would be more plentiful, more predictable and would not be in the food chain.
TER: Was horizontal drilling technology more capital-intensive at the time, with oil at $25/bbl?
LC: Not particularly. There were thousands and thousands of wells around the United States that had been drilled and shut-in or were at a trickle of their former production. Some were getting ready to shut down. People would practically give them away because it costs money from an environmental standpoint to close them. For us, Evolution was an opportunity to create an early-stage platform company to produce oil using enhanced oil recovery. We were fortunate that by 2006 oil prices were at $40–50/bbl.
TER: What’s the technique?
LC: The technique used is called CO2 (carbon dioxide) flooding, where you inject CO2 into the ground and it releases the trapped extra oil, which then bubbles up. The CO2 adds pressure, just as it does in a carbonated beverage. When you drill an oil well for the first time and release the virgin pressure by traditional means, you might get 40% of the oil. This means somewhere between 50% and 60% of the original oil in place is still there. With the CO2 floods, you can typically get between 15% and 20% of the original oil in place, and that’s a meaningful well.
TER: As a pioneer of this technology, where did you incur the most extensive costs?
LC: You have to have a pipeline to get your source CO2, and that’s a challenge. If you’re close to a source, the cost of injecting it can be around $10/bbl. But a project’s viability depends a lot on the fixed cost of getting the CO2 to the site. At the Delhi Field in Northern Louisiana, Evolution Petroleum formed a very effective partnership with the leading CO2 player in the industry, Denbury Resources Inc. (DNR:NYSE). Together we’ve done very well. The Delhi Field was 14,000 acres and is estimated to be capable of releasing an additional 60 million barrels (MMbbl) of oil. And with oil now over $100/bbl, that’s $6B worth of oil, and you can afford to spend a lot to go after that.
TER: Great foresight.
LC: I would say yes, it was foresight and some luck. We didn’t anticipate $100/bbl oil at the time. But, we really do focus on trying to get a play at the beginning of a growth cycle. Of course for any investor, being at the beginning of a rising tide is one of the keys to success and having superior returns.
TER: You’re not as actively involved in Camac Energy Inc. (CAK:NYSE) as you are in some of your portfolio companies, but starting the company has been an interesting saga. Can you tell us about that?
LC: In 2006, after having had some success with both Evolution Petroleum and Pacific Ethanol, I was introduced to Frank Ingriselli, the former head of Texaco International. He developed some important relationships in China and he had a lot of very high-level experience with majors in that region. After Chevron Corporation (CVX:NYSE) bought Texaco in 2001, he wanted to start a new oil and gas company and needed capital to grow, for which I was approached. We ended up funding a $21M offering and creating a new public entity, Pacific Asia Petroleum. Frank went to China to visit as a long-time contact and was granted a concession of 175,000 acres in the prime coal-bed-methane region of China. Without any upfront money, we got a hold of a major resource that launched the company. The Chinese government’s goal was to bring in people that had expertise and ability and who could bring capital for projects, because the country needs energy. Over time we ended up acquiring Camac, which owned a large property in offshore Nigeria that was just beginning production. In a sense it was a reverse merger for Camac because it became the majority shareholder and ended up taking control by its Chairman and CEO Kase Lawal. I dropped off the board around that period of time.
TER: Camac shares have been flat over the past six months, but down about 50% from a year ago. What accounts for the lag in the stock price?
LC: Its first production well started out at 20 thousand barrels per day (Mbbl/d) and it has gone down to about 4 Mbbl/d, but there’s still a huge reserve there, which is estimated to be between 600 MMbbl–2.2 billion (B) bbl of recoverable oil in the entire field. Camac is working on getting a new partner to come in and develop that. I’m bullish on the long-term. It’s going to take time, but it should be very exciting. I’m still a big shareholder and waiting, watching and hoping for the best.
TER: Were there any other companies you wanted to mention briefly?
LC: I recently became chairman of Blue Earth Inc. (BBLU:OTC), which is in the energy efficiency space. This is a very important new category, and it is frankly the lowest-hanging fruit of energy conservation by reducing energy consumption. Commercial real estate uses about 20% of our nation’s energy. Making those buildings more efficient is very important, and provides quick returns. For example, replacing old motors and with energy-efficient motors produces a one- to two-year payback. Blue Earth is geared toward doing that.
TER: Is the company actually manufacturing new technology?
LC: It’s not a technology company, but it’s using the latest improvements in energy efficiency to retrofit commercial real estate. It will also do energy audits for clients’ buildings and recommend an energy-generation project, be it solar, fuel cell, etc. that fits the client’s needs. This is called distributed generation: Instead of going into the grid and selling power back to the utility, the company sells directly to the customer. It therefore has none of the energy losses of going through the grid, nor any of the capex issues. Retrofitting to localize energy at a site is a tremendous innovation that needs to happen in order to reduce national and even global energy consumption. I’m very bullish on the energy efficiency and distributed generation space for the next 50 years. It has the power to replace and transform our energy production. We are not going to get rid of utilities because we need them, but we can chip away at our use of fossil fuels from our insatiable appetite for energy in a way that is cost effective. It also reduces carbon emissions.
TER: Is Blue Earth a consulting company?
LC: No. It’s more of a contractor, or a construction company. In other words, it does the work. In the solar world it’s called Engineering Procurement Construction or EPC. After the energy audit, the company does the engineering, including procurement of parts and construction. As we move on and migrate this business model, the company will also provide the financing and effectively become the developer. There are some good tax incentives involved in alternative energy, both in solar and fuel cells. Depreciation is also available, and that adds to the return.
TER: Solar systems would be on the roof or on land, but how far away would a generating fuel cell typically be from the building?
LC: Adjacent to the building. There’s no sound, and there are no moving parts. You need a footprint about the size of a tractor trailer. There are a few significant fuel cell manufacturers in the U.S., and they are growing nicely. Fuel cells are significantly more cost effective than solar if you can use energy 24 hours a day such as in a data center and can have net paybacks in 5–10 years at most, whereas it might take solar 10–20-years to payback.
TER: What are the fuel cell companies?
LC: One of the companies to look at is Bloom Energy (private). It has the larger units, and Google Inc. (GOOG:NASDAQ) put Bloom units into its building in Silicon Valley with a lot of publicity a year or so ago. Bloom is different from the other three manufacturers, as there is no waste heat, which is interesting. So, if you have large, consistent needs, Bloom is good. The data centers that Google runs are 24-hour operations. So, it would not be quite as suitable for a company that shuts down at night because you can’t amortize 24 hours, and perhaps solar would be better for a company that needs mostly peak daytime energy. That’s why an energy audit is so important, so clients can understand what’s most appropriate for their business.
Other companies include FuelCell Energy Inc. (FCEL:NASDAQ) and ClearEdge Power (private), the latter of which makes a variety of units, including small residential-size fuel cells. ClearEdge is blitzing homes. It’s the SolarCity (private) equivalent. SolarCity is trying to put solar on your roof, and ClearEdge is trying to put a fuel cell next to your house, and it makes systems all the way down to 5 kilowatts, which is appropriate for a midsize house.
TER: It has been a pleasure meeting you, Laird.
LC: Thank you.
Laird Cagan is managing director and co-founder of Cagan McAfee Capital Partners LLC, a merchant bank in Cupertino, CA. Cagan McAfee has founded, funded and taken public 10 companies in a variety of industries including energy, computing, healthcare and environmental. The company has helped raise over $500M for these companies, which achieved a combined market capitalization of over $2B. Mr. Cagan was the founder/chairman of Evolution Petroleum Corporation (AMEX: EPM), a company established to develop mature oil and gas fields with advanced technologies, and he is a former director of American Ethanol (AEB) and Pacific Asia Petroleum (PFAP).
Want to read more exclusive Energy Report interviews like this? Sign up for our free e-newsletter, and you’ll learn when new articles have been published. To see a list of recent interviews with industry analysts and commentators, visit our Exclusive Interviews page.
DISCLOSURE:
1) George Mack of The Energy Report conducted this interview. He personally and/or his family own shares of the following companies mentioned in this interview: None.
2) The following companies mentioned in the interview are sponsors of The Energy Report: None. Streetwise Reports does not accept stock in exchange for services.
3) Laird Cagan: I personally and/or my family own shares of the following companies mentioned in this interview: Evolution Petroleum Corporation, Camac Energy, Aemetis Inc. and Blue Earth Inc. I personally and/or my family are paid by the following companies mentioned in this interview: Evolution Petroleum Corporation, Aemetis Inc. and Blue Earth Inc. I was not paid by Streetwise for this interview.

The “mother” of all gold bull market lives and it “ain’t over until I say its over”.
I received this email from a 40-yr. Wall Street trader right after the “flash crash” in gold last week:
Hey Peter
Funny thing happened the other day, Nadler went bullish on gold.
I said, “I’M DEAD”
LANCE JORDAN
While I suspect I’m not the only one in the world who wishes Crocodile Dundee wasn’t just kidding, it was funny that the “Tokyo Rose” of gold had once again thrown out a hedge to cover his decade-long horrifically wrong forecasting record like he does every once and awhile when gold gets far away from his usual dribble, only to see the flash crash occur. Sure enough, he is back to his only usually reliable anti-gold self so take comfort in the fact that the greatest contrarian gold signal of all-time is back where he belongs.
I’ve played this video for quite some time now to remind the very small army of us who have enjoyed virtually the entire ride up in gold that we’re at war with most of the financial industry and the media that follows it. They hate gold and what it stands for and come out of their foxholes every so often during these nasty, but rather short-lived corrections. They did so late last year when gold was more than $100 below where it is now, only to see it rally $200+ in just two months.
Nothing has changed (not even their spiel) fundamentally and I plan on using the cash I’ve built up of late to go back into several positions and new ones.
For me, I shall remember this belief each time the airwaves are filled in the near-term with yet another wave of anti-gold rhetoric:
GOLD IS GOING TO AN INFLATED-ADJUSTED ALL-TIME HIGH BEFORE IT’S ALL SAID AND DONE!

Mark Leibovit – STOCKS – ACTION ALERT – SELL (Looking to Buy In A Month or Two)
What’s interesting is that the year to date has been the best start in stock indices since 1998 according to Dow Jones Newswires. As of the close today this is the 45th consecutive day without a triple digit decline. A canary in the coal mine? Today is ‘Turnaround Tuesday’, so with markets down a bit yesterday perhaps we can stage a rally today. But wait! Tomorrow is ‘Weird Wollie Wednesday’ and often either tomorrow or Thursday, according to the lore, there should be a shakeout ahead of a week from Friday’s Options Expiration. Is all of this just noise? Well, maybe not. We’re approaching that time of year when the markets often experience some form of indigestion. Yesterday, though the volume was NOT excessive, nevertheless we did volume increase to the downside. Benjamin Netanyahu spoke last night (covered sole on Fox News) before the American Israel Public Affairs Committee (AIPAC) and warned that time is running out for Iran. Folks, brace yourself. Sometime before now and the end of May, we’re likely to see a full scale confrontation unfold as the Mayans watch from the heavens. Would this be a good time to be in the marketplace? Markets don’t like uncertainty. I think the answer is no. The 50 and 200 day moving averages in the S&P 500 current sit at roughly 1323 and 1270. These are the next two potential downside targets if the S&P 500 cannot post a new high between now and the first of April. Apple, Inc. took a bit of a nosedive today. If Apple can’t rally (and it was about the only big stock doing so), the writing may be on the wall. Think about it. I can’t imagine one mutual fund, one institution, one endowment or one growth portfolio not owning Apple. Everyone now owns it, but where are the buyers should these folks decide to sell? I have avoided Apple because it is technically way, way too, extended and would only arouse my interest if it sold off back into the low to mid 400s – maybe lower. I’ve changed my mind. Time to flip to a SELL signal. Let’s see where the market is come the beginning of April or even perhaps the end of May. If the market rallies a bit higher first and you decide not to sell here, I would use that strength to lighten up. Now is a time to step aside and watch from the sidelines. I still believe there could be another big rally, but let’s revisit this market in a month or two. I am going to cash! – Mark Leibovit – for a VRTrader TRIAL SIGNUP go HERE
Four Cycle Turns Warn of a Stock Market Top in March 2012
There is a lot of cycle evidence that suggests a top is coming in March 2012. How significant a top is hard to say, but the odds are the coming decline will be at least in the 10 percent area. If this coming top is the top of Grand Supercycle degree wave {III}, then stocks will begin a decline that could retrace 50 percent or more of the market over the next several years, with large chunks of decline occurring incrementally, followed by normal 40 to 60 percent retracements as stocks work toward significantly lower levels. This weekend we will present this cycle evidence, which we believe is compelling.
First of all, the last phi mate turn date was in December, which led to a two month rally of significance. It was a major phi mate turn. March 7th is the next phi mate date, and the only phi mate turn date since that December turn. It also is a major phi mate turn, meaning its phi mate, its partner date, was also a major turn.
….read & view more charts HERE
Last month, Money Morning showed you how to use a technique called selling “cash-secured puts” to generate a steady flow of cash from a stock – even if you no longer own the shares.
It is a highly effective income strategy that can also be used to buy stocks at bargain prices.
But selling cash-secured puts does have a couple of drawbacks:
•First, it’s fairly expensive since you have to post a large cash margin deposit to ensure that you’ll be able to follow through on the transaction if the shares are “exercised.” Thus the name, “cash-secured” puts.
•Second, if the market – or the specific stock on which you sell the puts – falls sharply in price, you could have to buy the shares at a price well above their current value, taking a substantial paper loss.
Fortunately, there is a way to offset both these disadvantages while continuing to generate a steady income stream.
It’s called a “credit put spread” and it strictly limits both the initial cost and the potential risk of a major price decline.
I’ll show exactly how it works in just a second, but first I have to set the stage…
The Advantage of Credit Put Spreads
Assume you had owned 300 shares of diesel-engine manufacturer Cummins Inc. (NYSE: CMI) and had been selling covered calls against the stock to supplement the $1.60 annual dividend and boost the yield of 1.30%.
Let’s also assume that back in mid-January, when the stock was around $110 a share, you sold three February $120 calls because it seemed like a safe bet at the time.
However, when CMI’s price later moved sharply higher, hitting $122.07/share, your shares were called away when the options matured on Feb. 17.
That means you had to sell them at $120 per share to fulfill your call option. That might leave you with the following dilemma.
Thanks to the recent rally, the stocks you follow are too high to buy with the proceeds from your CMI sale. On the other hand, you also hate to forfeit the income you had been getting from the CMI dividend and selling covered calls.
You also decide you wouldn’t mind owning CMI again if the price pulled back below $120.
In this case, your first inclination might be to use the money from the CMI sale as a margin deposit for the cash-secured sale of three April $120 CMI puts, recently priced at about $4.90, or $490 for a full 100-share option contract.
That would have brought in a total of $1,470 (less a small commission), which would be yours to keep if Cummins remains above $120 a share when the puts expire on April 21.
That sounds pretty appealing, but…
The minimum margin requirement for the sale of those three puts – and, be aware, most brokerage firms require more than the minimum – would be a fairly hefty $8,190.
[Note: For an explanation of how margin requirements on options are calculated, you can refer to the Chicago Board Option Exchange (CBOE) Margin Calculator, which shows how the minimum margin is determined for a variety of popular strategies.]
Your potential return on the sale of the three puts would thus be 17.94% on the required margin deposit ($1,470/$8,190 = 17.94%), or 4.08% on the full $36,000 purchase price of the 300 CMI shares you might have to buy.
Either of those returns is attractive given that the trade lasts under two months – but you also have to consider the downside.
Should the market plunge into a spring correction, taking Cummins stock with it, the loss on simply selling the April $120 puts could be substantial.
For example, if CMI fell back to $100 a share, where it was as recently as early January, the puts would be exercised.
You’d have to buy the stock back at a price of $120 a share, giving you an immediate paper loss of $6,000 – or, after deducting the $1,470 you received for selling the puts, $4,530.
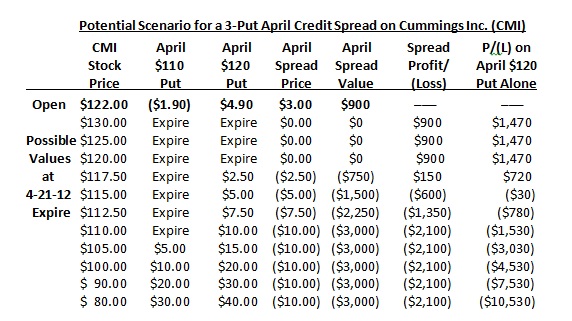
And, if CMI fell all the way back to its 52-week low near $80, the net loss would be $10,530. (See the final column in the accompanying table.)
All of a sudden, that’s not such an attractive prospect.
And that’s where a credit put spread picks up its advantage.
But selling cash-secured puts does have a couple of drawbacks:
•First, it’s fairly expensive since you have to post a large cash margin deposit to ensure that you’ll be able to follow through on the transaction if the shares are “exercised.” Thus the name, “cash-secured” puts.
•Second, if the market – or the specific stock on which you sell the puts – falls sharply in price, you could have to buy the shares at a price well above their current value, taking a substantial paper loss.
Fortunately, there is a way to offset both these disadvantages while continuing to generate a steady income stream.
It’s called a “credit put spread” and it strictly limits both the initial cost and the potential risk of a major price decline.
I’ll show exactly how it works in just a second, but first I have to set the stage…
The Advantage of Credit Put Spreads
Assume you had owned 300 shares of diesel-engine manufacturer Cummins Inc. (NYSE: CMI) and had been selling covered calls against the stock to supplement the $1.60 annual dividend and boost the yield of 1.30%.
Let’s also assume that back in mid-January, when the stock was around $110 a share, you sold three February $120 calls because it seemed like a safe bet at the time.
However, when CMI’s price later moved sharply higher, hitting $122.07/share, your shares were called away when the options matured on Feb. 17.
That means you had to sell them at $120 per share to fulfill your call option. That might leave you with the following dilemma.
Thanks to the recent rally, the stocks you follow are too high to buy with the proceeds from your CMI sale. On the other hand, you also hate to forfeit the income you had been getting from the CMI dividend and selling covered calls.
You also decide you wouldn’t mind owning CMI again if the price pulled back below $120.
In this case, your first inclination might be to use the money from the CMI sale as a margin deposit for the cash-secured sale of three April $120 CMI puts, recently priced at about $4.90, or $490 for a full 100-share option contract.
That would have brought in a total of $1,470 (less a small commission), which would be yours to keep if Cummins remains above $120 a share when the puts expire on April 21.
That sounds pretty appealing, but…
The minimum margin requirement for the sale of those three puts – and, be aware, most brokerage firms require more than the minimum – would be a fairly hefty $8,190.
[Note: For an explanation of how margin requirements on options are calculated, you can refer to the Chicago Board Option Exchange (CBOE) Margin Calculator, which shows how the minimum margin is determined for a variety of popular strategies.]
Your potential return on the sale of the three puts would thus be 17.94% on the required margin deposit ($1,470/$8,190 = 17.94%), or 4.08% on the full $36,000 purchase price of the 300 CMI shares you might have to buy.
Either of those returns is attractive given that the trade lasts under two months – but you also have to consider the downside.
Should the market plunge into a spring correction, taking Cummins stock with it, the loss on simply selling the April $120 puts could be substantial.
For example, if CMI fell back to $100 a share, where it was as recently as early January, the puts would be exercised.
You’d have to buy the stock back at a price of $120 a share, giving you an immediate paper loss of $6,000 – or, after deducting the $1,470 you received for selling the puts, $4,530.
And, if CMI fell all the way back to its 52-week low near $80, the net loss would be $10,530. (See the final column in the accompanying table.)
All of a sudden, that’s not such an attractive prospect.
And that’s where a credit put spread picks up its advantage.
Here’s how it works…
How to Create a Credit Put Spread
Instead of just selling three April CMI $120 puts at $4.90 ($1,470 total), you also BUY three April CMI $110 puts, priced late last week at about $1.90, or $570 total.
Because you have both long and short option positions on the same stock, the trade is referred to as a “spread,” and because you take in more money than you pay out, it’s called a “credit” spread.
And, in this case, the “credit” you receive on establishing the position is $900 ($1,470 – $570 = $900).
Again, that $900 is yours to keep so long as CMI stays above $120 by the option expiration date in April.
However, because the April $110 puts you bought “cover” the April $120 puts you sold, your net margin requirement is just $2,100 – which is also the maximum amount you can lose on this trade, regardless of how far CMI’s share price might fall. (Again, see the accompanying table for verification.)
That’s because, as soon as the short $120 puts are exercised, forcing you to buy 300 shares of CMI for $36,000, you can simultaneously exercise your long $110 puts, forcing someone else to buy the 300 shares for $33,000.
Thus, your loss on the stock would be $3,000, which is reduced by the $900 credit you received on the spread, making your maximum possible loss on the trade $2,100.
On the positive side, if things work out – i.e. CMI stays above $120 in April – and you get to keep the full $900, the return on the lower $2,100 margin deposit is a whopping 42.85% in less than two months, or roughly 278.5% annualized.
Plus, as is the case with most option income strategies, you can continue doing new credit spreads every two or three months, generating a steady cash flow until you’re ready to repurchase the stock at a more desirable price.
In this case, we say “ready” to repurchase because you’re never forced to buy the stock; you can always repurchase the options you sold short prior to expiration.
This strategy has substantial cost-cutting benefits when trading higher-priced issues like CMI, but it’s also a very effective short-term income strategy with lower-priced shares.
For example, with Wells Fargo & Co. (NYSE: WFC) trading near $31.50 late last week, an April credit spread using the $31 and $28 puts would bring in a net credit of 75 cents a share, or $225 on a three-option spread.
Since the net margin deposit on the trade would be just $675, you’d get a potential return of 33.3% in only seven weeks if WFC remains above $31 a share.
As you can see, credit put spreads are a great way to boost your gains while lowering your risks, especially in stable or rising markets.
So why not give yourself some credit.
Source http://moneymorning.com/2012/03/05/options-101-credit-put-spreads-can-boost-your-gains-and-lower-your-risk/
Money Morning/The Money Map Report
©2012 Monument Street Publishing. All Rights Reserved. Protected by copyright laws of the United States and international treaties. Any reproduction, copying, or redistribution (electronic or otherwise, including on the world wide web), of content from this website, in whole or in part, is strictly prohibited without the express written permission of Monument Street Publishing. 105 West Monument Street, Baltimore MD 21201, Email:customerservice@moneymorning.com” target=”_blank”>customerservice@moneymorning.com

Todd Market Forecast for Monday March 5, 2012
Available Mon- Friday after 6:00 P.M. Eastern, 3:00 Pacific.
DOW – 15 on 600 net declines
NASDAQ COMP – 26 on 350 net declines
SHORT TERM TREND – Bearish (change)
INTERMEDIATE TERM TREND – Bullish
A projected attenuation of Chinese growth and renewed concerns about Greece caused a Dow drop of as much as 90 points in the early going, but about 2 hours into the trading day, the market began to come back.
This has been the pattern for the past few months. It has been a winning trade to buy into intraday weakness. One of these days that trade isn’t going to work anymore.
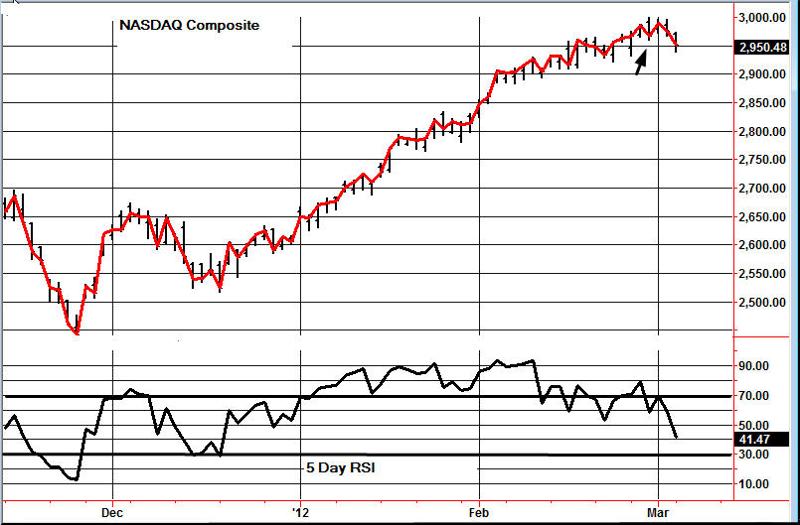
Today the NASDAQ Composite closed below a previous low (arrow) for the first time since mid December. The same is true for the S&P 500. For this reason, we will move to a short term sell. If this index decides to turn and move to another high, then we will have to move back to a buy.
TORONTO EXCHANGE: Toronto got whacked pretty good, down 119 points.
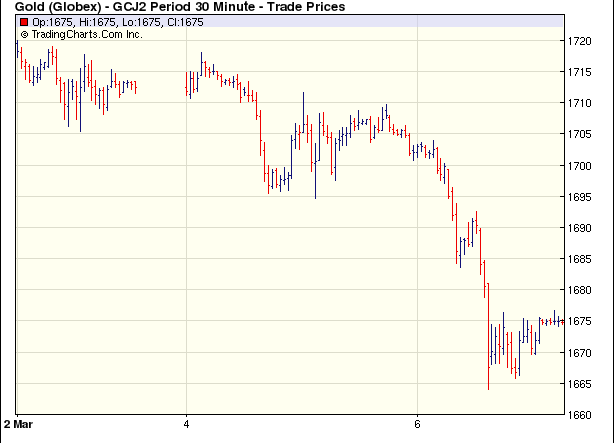
GOLD: Gold was down 15 intraday, but manage to claw its way back. It was still down for the session.
BONDS: Bonds were down marginally.
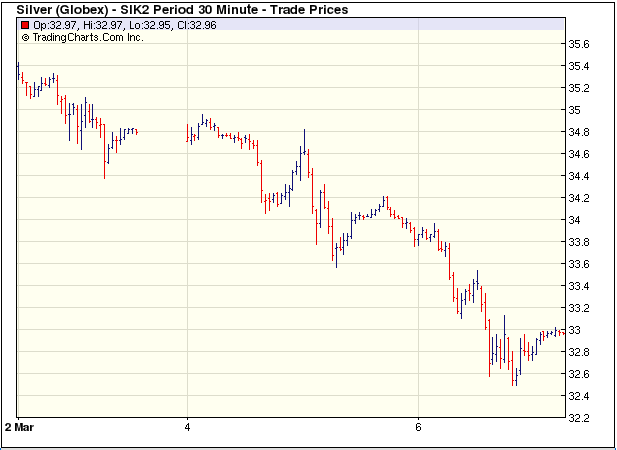
THE REST: The dollar was down just a bit. Not much influence on gold, copper and silver which were lower and crude oil, which was higher.
BOTTOM LINE:
Our intermediate term systems are on a buy signal.
System 2 traders are in cash. Stay there on Tuesday.
System 7 traders sold the SPY at 136.86 for a loss of .07, essentially break even. Stay in cash on Tuesday.
NEWS AND FUNDAMENTALS:
The services ISM number was 57.3, better than the expected 56.0. Factory orders dropped 1.0%, better than the consensus 1.6% drop. There are no important releases scheduled for Tuesday.
————————————————————————————–
We’re on a sell for bonds as of December 21.
We’re on a sell for the dollar and a buy for the euro as of January 18.
We’re on a buy on gold as of Feb. 21.
We’re on a buy on silver as Feb. 21.
We’re on a buy for crude oil as of Feb. 13.
We’re on a buy for copper as of December 20
We’re on a buy for the Toronto Stock Exchange TSX
We are long term bullish for all major world markets, including those of the U.S., Britain, Canada, Germany, France and Japan.
#1 Timer of the Year
Gold timing was rated # 1 for 1997 and # 2 for 2006. Late word! We were rated # 1 for 2011.
We were # 1 in long term stock market timing for the years 1998 and 2004 and # 4 in 2010.
To subscribe to the Todd Market Forecast go HERE

-
I know Mike is a very solid investor and respect his opinions very much. So if he says pay attention to this or that - I will.
~ Dale G.
-
I've started managing my own investments so view Michael's site as a one-stop shop from which to get information and perspectives.
~ Dave E.
-
Michael offers easy reading, honest, common sense information that anyone can use in a practical manner.
~ der_al.
-
A sane voice in a scrambled investment world.
~ Ed R.
Inside Edge Pro Contributors

Greg Weldon

Josef Schachter

Tyler Bollhorn

Ryan Irvine

Paul Beattie

Martin Straith

Patrick Ceresna

Mark Leibovit

James Thorne

Victor Adair