
Gold & Precious Metals
Update February 29, 2012: A key phrase from Mark Leibovit’s VRGold Letter “Action Alert” dispatched today:
“Gold prices were selling off Wednesday after Federal Reserve Chairman Ben Bernanke indicated that an additional round of quantitative easing was becoming increasingly unlikely. We’re experiencing a ‘flash-crash’ type scenario today which in my view presents a bigger picture buying opportunity.” – VRGold Letter
Update 3:18pm Feb 27: Gold (below) has formed a broad head-and-shoulders bottom with the upside breakout coming in at 1800. April gold has been hammering on the 1700 support level for days, and so far 1700 has held. If 1700 won’t give way, then gold should be able to take out 1800. What won’t go down — should go up. At least that’s the theory – written 2/27/2012 in Dow Theory Letters
Meanwhile, gold pops 20 bucks. Pick a hammer and hammer down on a wood board 20 times. The board doesn’t break, which means that’s a mighty tough board. Now hammer down on 1700 dollar gold 20 times. And the 1700 base refuses to give. So you know that 1700 is a tough base for gold. Today April gold closed up over 32 dollars to 1758.50. This puts gold over the halfway point of 1750 and looking at 1800. If gold won’t break below 1700, will it go over 1800? There’s at least a good chance. – written 2/21/2012 in Dow Theory Letters
GOLD – ACTION ALERT – BUY
(written Feb 27/2012)
Spot gold touched 1789.10 Thursday and retraced to 1769.20 on Friday. We should have seen 1764.00. Downside risk is back to the 1730s should we see another ‘smackdown’. Next upside objective 1840. Spot silver continued high Friday trading at 35.84. I would like to see a pullback to 34.60. Still targeting to 37 and then the low 40s. Copper pushed higher touching 3.8823. It’s coming off 3.702. That was the recent low following the February 8 high at 3.9850. I’m looking for 4.48+. Both Palladium and Platinum corrected Friday following new recovery highs Thursday at 729 and 1740, respectively. – Sign up for a 30 Day Trial offer with Mark Leibovit’s VRTrader. More information at the end of this article.
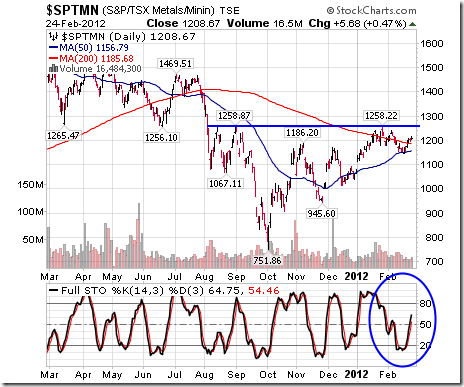
Gold, Silver, Platinum & TSE Gold Index Charts & Technical Analysis below by Don Vialoux:
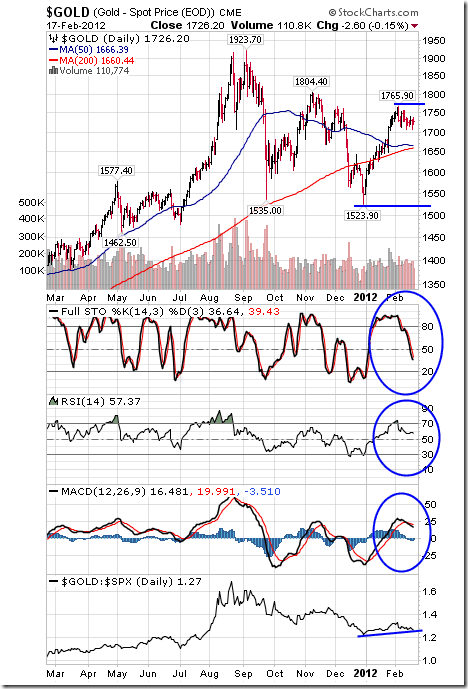
Gold gained $49.50 per ounce (2.87%) last week. Support is at 1,523.90. Resistance at $1,804.40 is being tested. Short term momentum indicators are overbought, but have yet to show signs of peaking. Strength relative to the S&P 500 Index remains slightly positive.
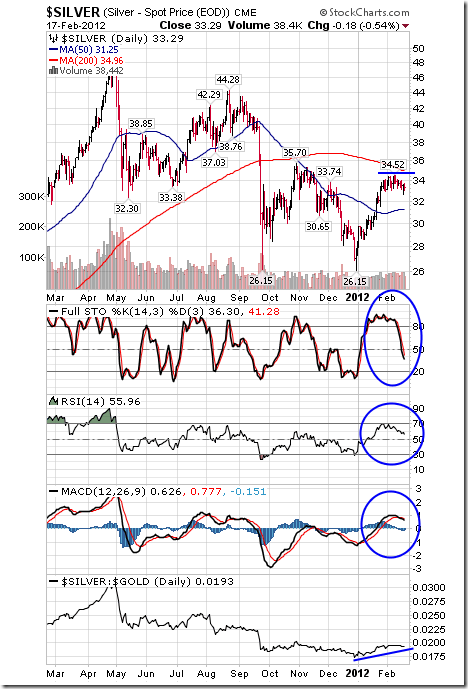
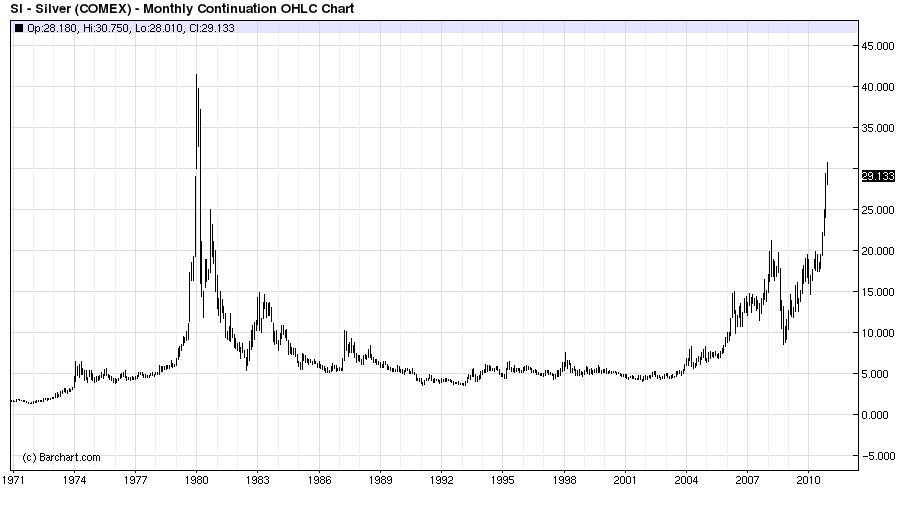
Silver gained $2.14 per ounce (6.43%) last week. Intermediate trend changed from down to up on Friday after resistance at $35.70 was broken. Silver also broke above its 200 day moving average on Friday. Short term momentum indicators are overbought, but continue to trend higher. Strength relative to gold remains slightly positive. ‘Tis the season for silver to move higher!
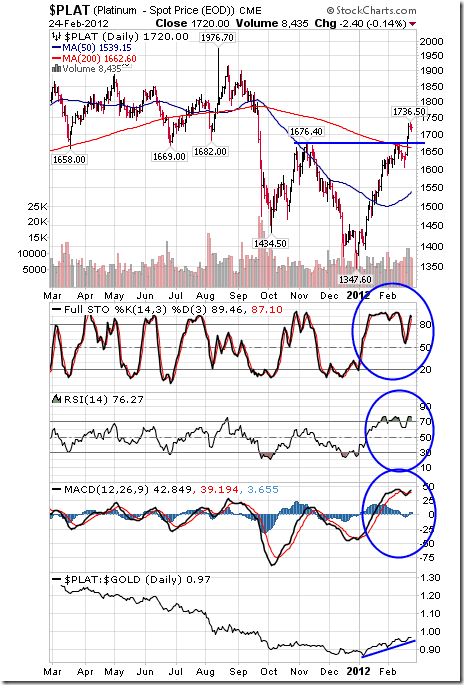
Platinum gained another $87.50 per ounce (5.37%) last week. Intermediate trend changed from down to neutral on a break above resistance at $1,676.40 per ounce. Platinum also broke above its 200 day moving averages last week. Short term momentum indicators are overbought, but continue to trend higher. Strength relative to gold remains positive. ‘Tis the season for platinum to move higher!
The TSX Gold Index gained 16.47 points (4.46%) last week. Support is at 346.24 and resistance is at 395.64. Short term momentum indicators are trending down. Strength relative to gold remains negative.
VRTRADER.COM Trial Signup:
THE RENEWAL OF YOUR SUBSCRIPTION IS AUTOMATIC. YOUR CREDIT CARD WILL CONTINUE TO BE BILLED UNLESS YOU NOTIFY VRtrader.com SEVEN DAYS PRIOR TO SUBSCRIPTION EXPIRATION EITHER VIA EMAIL POSTING THE WORD ‘UNSUBSCRIBE’ IN THE SUBJECT BOX OR TELEPHONE US AT (928) 282-1275 OF CANCELLATION. NO REFUNDS ARE AVAILABLE ON SILVER, PLATINUM OR VR FORECASTER (ANNUAL FORECAST MODEL) SUBSCRIPTIONS.
Welcome and congratulations on choosing VRTrader.com as a source for your stock market commentary, information and analysis for the U.S. Stock Market. Needless to say we are very happy that you are joining us for AT LEAST the next 30 days days and look forward to providing you rewarding and inciteful information that will help you toward your goal of succeeding in the markets.
Here is the Special Trial Offer: Use this month to kick our tires. Pay 50% for the first 30 days (No refund) and sample our Silver or Platinum service and then decide what works best for you. If you aren’t 100% ready to move forward, simply email us to cancel one week before your 30 day 50% off trial subscription ends and it will be canceled and you will not be charged ANY FURTHER, no questions asked. Just send an email to mark.vrtrader@gmail.com” data-mce-href=”mailto:mark.vrtrader@gmail.com“>mark.vrtrader@gmail.com or call 928-282-1275 to cancel. You will receive an emailed confirmation of your cancellation at that time.
The 30 day trial is allowed one time only. By taking this 30 day 50% trial, you agree to be charged the full cost of the monthly Silver or Platinum service (choose one only) at the end of the 30 day trial subscription period, unless you cancel first. The regular Silver monthly rate is $49.40 and the Silver quarterly rate is $133.50. The regular Platinum monthly rate is $129.95 and the Platinum quarterly rate is $350.85. The special trial 50% off trial rates are listed below. Sign up today!
There are no refunds or pro-rata refunds offered at VRTrader.com for any subscription. You are being offered a 50% discount for trying our service for the first 30 days only!

From the Tulip Mania of the 1600s all the way to the recent housing bubble, market manipulators have employed a wide range of tactics to lighten the wallets of unsuspecting investors.
And even though market manipulation is prohibited in the U.S. under a section of the Securities Exchange Act of 1934– it’s as American as apple pie.
Everyone from high-ranking government officials to investment bankers have been caught with their hands in the cookie jar.
The list includes scofflaws like Ivan Boesky, Michael Milken, and Jack Abramoff.
Jim Cramer, the host of CNBC’s “Mad Money,” said he regularly manipulated the market when he ran his hedge fund, calling it “a fun…and lucrative game.”
Not surprisingly, a recent study found that those closest to the information loop -corporate insiders, brokers, underwriters, large shareholders and market makers – are most likely to be the perpetrators.
To give you an idea of how things work, here are three notorious examples of market manipulation.
Stock Market Manipulation Is
as Old as the Hills
1) The Erie War: In 1867, American financier and railroad builder Jay Gould sat on the board of directors of the financially troubled Erie Railroad.
In what is known as the ‘Erie War’ Gould fought to keep Cornelius Vanderbilt from acquiring Erie and consolidating the industry.
To pull it off, Gould issued 100,000 shares of new Erie stock by illegally converting debentures.
He then used the money to bribe New York legislators to make the conversion legal. Outfoxed, Vanderbilt settled, receiving $1 million as a sweetener.
Afterwards, Gould vastly expanded Erie’s debt and launched it on an expansion campaign. Meanwhile, he sold its stock short, and made a killing before Erie went bankrupt in 1875.
2) The Enron Scam: After merging two gas pipeline companies to form Enron Co. in 1985, Ken Lay helped establish the market for selling electricity. Later, he successfully lobbied the U.S. Congress to deregulate the sale of natural gas.
Enron soon began trading these markets to drive up energy prices and significantly increase its revenue. Meanwhile, Lay and CEO Jeff Skilling used accounting loopholes and misappropriated investments to keep billions in debt off the books.
But perhaps their greatest feat was their ability to pressure Arthur Anderson & Co. staffers to cooperate in fooling the board of directors and audit committees.
Investors lost more than $70 billion when the Enron scandal ended in one of the biggest bankruptcies in history, driving its stock down from a high of $90 per share in mid-2000 to less than $1 by the end of November 2001.
Andersen, one of the five largest accounting partnerships in the world, lost most of its customers and shut down.
The scandal eventually led to the enactment of the Sarbanes-Oxley Act to expand the accuracy of financial reporting for public companies and punish those attempting to defraud shareholders.
3) The Internet Swindle: It used to take rooms full of stockbrokers feverishly working massive phone banks to manipulate a company’s shares.
Now anyone can reach millions of potential traders instantly, all while remaining completely anonymous.
In 1999, two UCLA students drove the stock of a bankrupt printing company from 13 cents to more than $15 in twotrading days, dramatically demonstrating how the Internet had transformed the old game of stock market manipulation.
The students had spent two weeks acquiring 97% of the thinly traded stock of NEI Webworld Inc., The New York Times reported. After the market closed on Friday, they sent out hundreds of messages on Internet bulletin boards touting a takeover and the huge profits to come.
On Monday, based on orders made by those who believed the fake postings over the weekend, the stock rocketed up 106,600% to $15.50a share–in a half- hour.
The students sold their shares into the buying frenzy and eventually bagged over $350,000 in profits. NEI shares closed that day at 75 cents.
Is Silver Next?
The latest market manipulation could be ripped from the pages of a Hollywood thriller, according to Peter Krauth, a highly regarded expert in metals who runs the Global Resource Alert investment service.
Only this story is not fiction… and it’s happening now, he says.
Krauth spent the last six months conducting an exhaustive investigation of a backroom deal to keep the price of silverartificially depressed. Now he’s ready to expose what’s been going on behind the scenes in the silver market and why the price is headed to $200 or more.
He reveals all the details – and how investors can profit – in a free report.
You can access it HERE.
One of the ways I look at the market is in terms of a giant teeter-totter…I see the market swinging up and down as psychology changes from bullish to bearish. I try to judge what the prevailing mood is, relative to whatever time frame I’m using, and then either establish a position in line with the trend or look for signs that the trend is about to change. I use hard data such as the COT reports, gut instincts such as how a bull market takes bad news, and chart patterns to gauge whether a trend is likely to continue or reverse. I’m mindful that market trends often go far beyond what I think is reasonable so I’ve developed a risk management technique I call, “Anticipate…but wait for confirmation,” to restrain myself from trying to pick tops and bottoms.
We had the biggest credit blow-out in history in 2007-08 (after 30 years of boom times) and asset markets collapsed in anticipation of a depression. Authorities around the world countered the deflationary forces with massive fiscal and monetary stimulus (again and again and again.)
In teeter-totter terms the market will rally when it thinks that the authorities are prevailing (like now) and will fall (like August/September of last year) when it thinks that the authorities are losing the battle against deflation. So we have risk-on, risk-off, as public confidence in central planning waxes and wanes.
…..read more of Victor’s analysis HERE

It is said that markets discount the stuff we do know and run on the stuff we don’t. Let’s take a look at what we do know, might know, and some best guesses about the future (called forecasts by “serious” analysts), as it relates to the rally in EUR/USD:
1. Euro short rates relative to the US have turned higher again, i.e. the yield differential in favor of euro is improving.
Question: Will this continue?
Best Guess: I don’t think so because euro supply may begin to overwhelm demand (see #2 below). And if US growth is for real, and a the 10 nation Eurozone recession is for real, one would expect US 3-month benchmark rates to drift higher relative to the euro.
2. European Central Bank expected to flood banks with more credit next week; euro seemed to rally sharply on the last round of Long-term Refinancing Operations (LTRO) by the European Central Bank, i.e. three-year term loans to the European banking system.
Question: Will we see the same type of rally in the periphery debt this time around?
Best Guess: Unlikely, in fact it might be a good time for those who bought last time to sell into the next round of ECB Long-term Refinancing Operations. If so, if the EUR/USD rally shows signs of stalling next week, it could be time to start looking the other way.
3. There is a lot of Fed jawboning about the potential for QE3.
Question: Is QE3 baked in the cake?
Best Guess: I don’t think so. Two points here: 1) If the US recovery is for real, it doesn’t make sense that Fed Governors are so boisterous about the potential for QE3; and 2) Even Ben Bernanke (going out on limb here) has to understand that monetary policy stimulus has limits that become counterproductive at some stage and many, including me, think we are into the counterproductive territory. Plus, how will QE3 that sits on US banks’ balance sheets help any more than the pledge to hold Fed Funds rates low into 2014, in and of itself an incredible act by a central bank chief? It is what a rational person, assuming Ben is rationale, may ask himself.
Bottom line: Though the recent move in EUR/USD is powerful, I think it is a relatively near-term event. Here’s why: 1) If the US is really growing, the dollar at some point wins on growth and yield relative to euro. Growth and yield are the intermediate-term drivers for currencies, and 2) if the US goes back into recession, a case we made in our latest Global Investor monthly issue; Europe goes into an even deeper one and China is in trouble too. This means the US dollar, for all its warts, gets a big risk bid.
We watch and see how reality plays out against our best guesses …

Captain of our fairy band,
Helena is here at hand,
And the youth, mistook by me,
Pleading for a lover’s fee.
Shall we their fond pageant see?
Lord, what fools these mortals be!
– A Midsummer Nights Dream Act 3, scene 2

“Markets are reasonably efficient, most of the time, at setting prices. Where they are most likely to fail, though, is in correctly anticipating and pricing big, revolutionary, ‘paradigm’ shifts — whether a rise of disruptive technologies or revolutionary changes in geopolitics. We are living through one now.” – Crispin Odey
Ed Note: Be sure to read through to the conclusion at the bottom of this article:
Metals and Mining Paradigm Shift, Exiting Easy And Cheap
The massive growth of global prosperity over the last five centuries has been driven by easy and cheap access to critical materials:
- Food
- Fibre
- Energy
- Minerals
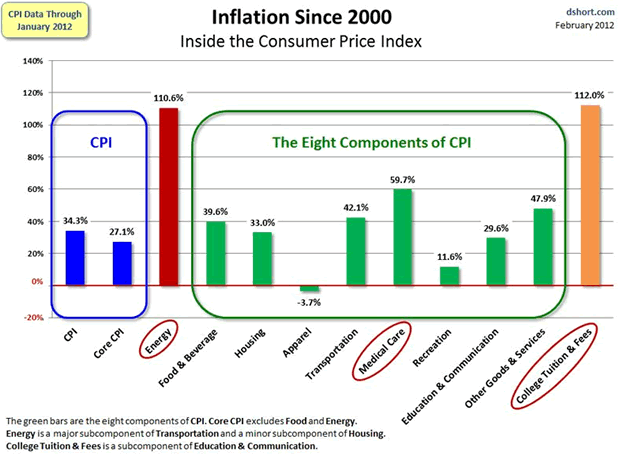
However since October 2001 the CRB BLS Spot Index has reached record levels.
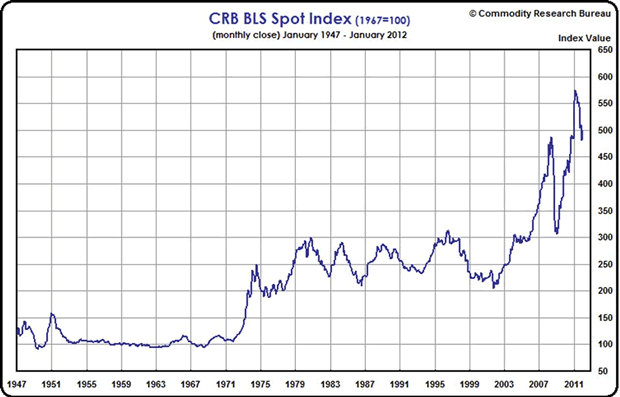
The Spot Market Price Index is a measure of price movements of 22 basic commodities. The spot price is the price at which a commodity is selling for immediate delivery.
Commodity price rises could be caused by:
- Raw materials shortages
- Resource nationalism
- Emerging market demand
- Speculation
- Intense weather pattern changes
- War
- Inflation
- Hoarding
- Low interest rates
Many people might assume that out of all the reasons given these three would be the main drivers:
- War
- Inflation
- Emerging market demand
Inflation & War
Because central banks can increase the supply of money virtually at will, and do so, the value of all existing money decreases. The amount of goods and services remains the same, but now the amount of money chasing them has increased, this increased competition – more money (inflation) for the same amount of goods and services – causes prices to rise.
Governments and Central Banks want slowly rising prices. They pour money into the market to encourage growth so prices increase rather than decrease. Price decreases, or deflation (less money growth), slows economic activity – if people think prices are going to be lower next week they will not buy today, they will wait, this leads to a contraction in economic activity, something all governments fear.
Low interest rates play their part as well. When governments lower interest rates to stimulate borrowing businesses expand and consumers borrow to buy homes, cars and other goods. Demand for goods and services increase and so to do prices of commodities used in manufacturing.
Nations in Europe, and the U.S. will inflate (print more of) their currencies rather than cutting back spending or raising taxes. In a global race to worthless Asian economies will also have to print massive amounts of their currencies so they stay weaker then the US dollar. Asian exports have to be cheap for American consumers and American exports have to be more expensive then locally produced goods.
The buildup to war, and the actual running of a war is expensive. Governments will typically devalue their currencies by printing the money needed – very few people would ever consent to go to war if they were made to pay for it out of their pockets. How many Americans would consent to the trillions of dollars necessary for America’s endless wars and vast military complex if the money required came directly off their paycheques? Government control over the money supply makes the business of war easy to finance because the financial support of its citizens is not needed.
Actual war does not seem to be one of the main causes of the decade long commodities price increase, rather it’s the creation of the money necessary to go to war – government created inflation. In regards to recent wars, we haven’t had a global conflict, and the resultant massive global destruction and rebuilding, since World War II. Wars today are localized affairs and do not bring about the massive use of commodities for rebuilding as a global conflict would.
Throughout history periods of rising money supply growth has coincided with rising commodity prices, and falling money supply growth coincided with periods of falling commodity prices.
A key driver of higher commodity prices, global government sponsored inflation (and quite likely continuing war inflation) are locked in place for years to come.
Developing Country Demand
China’s plus nine percent annual growth, and other developing nations growth (averaging much less), are usually named as the biggest cause of price rises in the commodities markets. China has been growing at plus nine percent annually for well over two decades. Compounded that’s a lot of growth, add in other developing countries growth then realize a considerable period of this growth was spent in the commodity bear market. The growth story is suddenly an overnight sensation, inflations effects start to percolate, wars are started and speculators play.
A mismatch between demand and supply is not a new problem in commodity markets. It can and does take years to find and develop new resources and bring the commodities to market. If war and emerging country demand cause prices to rise – shortage caused price spikes – an increase in production (after a war or ramping up for developing country demand) would satisfy increased demand. But it hasn’t happened yet and it’s been over a decade since commodity prices have gone on their spectacular run.
So far inflation would seem to be the driver for commodity price increases, everything else seems temporary or if permanent, such as developing country demand, fixed with an increase in production.
But
There is a major paradigm shift taking place in the mining industry and it concerns the supply, not the demand side we hear so much about.
Supply
Supply shortages always lead to high enough metal prices for further increases in production, thus supply will eventually exceed demand and prices will drop…right? Well maybe, maybe not. Margins (not price) motivates investment and if the cost of metal production is increasing margins might not be sustainable.
Lets state the obvious:
- For over the last ten years supply has struggled to keep pace with demand
- Metal supply is finite and subject to compounding demand from developing nations
- Metal production is highly cyclical, with intermittent peaks and troughs which are closely linked to economic cycles – declining production has historically been driven by falling demand and prices, not by scarcity
- Rates of production and amounts of reserves continually change in response to movements in markets and technological advances
- Most mineral resources will not be exhausted in the near future
- If energy was cheap and unlimited then recoverable resources would be unlimited
But
- Discovery and development is increasingly becoming more challenging and expensive
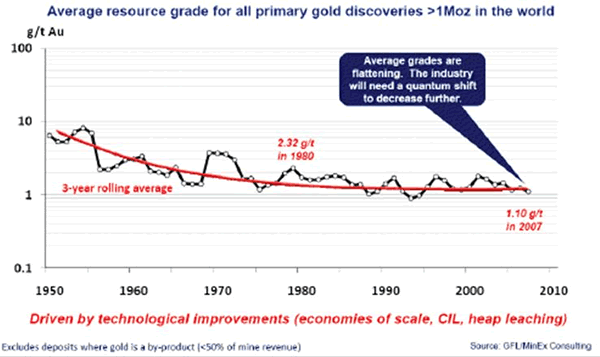
- Average ore grades are in decline for most minerals, yet production has increased dramatically
- Our most important metals are suffering from declining ore quality and rising extraction (ore is a different and inferior chemical or structural composition) costs
- Our prosperity has always been based on the fact that producing resources yielded more resources than it cost. However the cost of *energy is climbing, the amount used is climbing but the returns from energy expended is declining. Eventually the quantity of resources used in the extraction process will be 100% of what is produced
- Most older existing mines, the foundation of our supply, have increasing costs with production rates stagnating or even declining
- The rate of discovery is not keeping pace with the rate of depletion, let alone being higher
*Energy can be thought of as a proxy for labor, materials, energy and externalities – environmental, community impact etc.
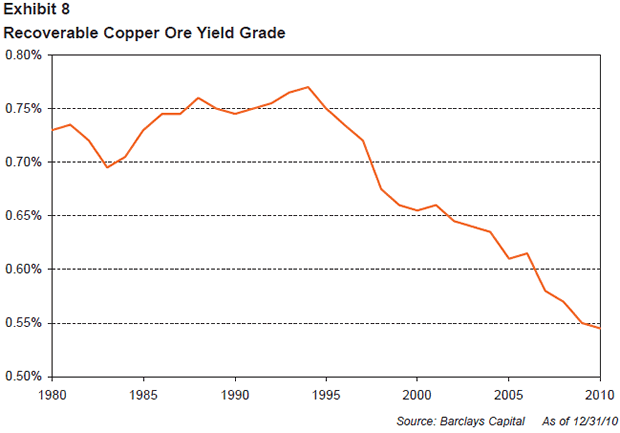
Copper and Gold as Proxies
The metal content of copper ore has been falling since the mid 1990s. A miner now has to dig up an extra 50 percent of ore to get the same amount of copper. As grade drops the amount of rock that must be moved and processed per tonne of produced copper rises dramatically – all the while using more energy that costs several times more than it use to. With the lower grades of ores now being mined energy becomes more and more of a factor when considering economics.
Conclusion
Complicated more expensive extraction of metals from increasingly harder to find, lower grade ore bodies in almost inaccessible and hostile parts of the world is going to affect our lifestyles.
What changes are we going to have to make as nature – the finite supply of materials and energy constraints – dictates lifestyles and aspirations?
“We took the nice, simple, easy stuff first from Australia, we took it from the U.S., we went to South America. Now we have to go to the more remote places.” Glencore CEO, Ivan Glasenberg in the Financial Times describing why his firm operates in the Congo and Zambia
We are experiencing a paradigm shift. If nothing else, right now at this point in history, we all have to realize that the mining industry is exiting “easy & cheap” and is starting the upward slope of chronic lower supply, permanently higher prices and higher risk.
We all have to agree that the planet’s booming population and rising standards of living are going to put unprecedented demands on supply.
This should be on everyone’s radar screen. Is it on yours?
If not, maybe it should be.
By Richard (Rick) Mills
www.aheadoftheherd.com
If you’re interested in learning more about specific lithium juniors and the junior resource market in general please come and visit us at www.aheadoftheherd.com. Membership is free, no credit card or personal information is asked for.
Copyright © 2012 Richard (Rick) Mills – All Rights Reserved
Legal Notice / Disclaimer: This document is not and should not be construed as an offer to sell or the solicitation of an offer to purchase or subscribe for any investment. Richard Mills has based this document on information obtained from sources he believes to be reliable but which has not been independently verified; Richard Mills makes no guarantee, representation or warranty and accepts no responsibility or liability as to its accuracy or completeness. Expressions of opinion are those of Richard Mills only and are subject to change without notice. Richard Mills assumes no warranty, liability or guarantee for the current relevance, correctness or completeness of any information provided within this Report and will not be held liable for the consequence of reliance upon any opinion or statement contained herein or any omission. Furthermore, I, Richard Mills, assume no liability for any direct or indirect loss or damage or, in particular, for lost profit, which you may incur as a result of the use and existence of the information provided within this Report.
© 2005-2012 http://www.MarketOracle.co.uk – The Market Oracle is a FREE Daily Financial Markets Analysis & Forecasting online publication.

-
I know Mike is a very solid investor and respect his opinions very much. So if he says pay attention to this or that - I will.
~ Dale G.
-
I've started managing my own investments so view Michael's site as a one-stop shop from which to get information and perspectives.
~ Dave E.
-
Michael offers easy reading, honest, common sense information that anyone can use in a practical manner.
~ der_al.
-
A sane voice in a scrambled investment world.
~ Ed R.
Inside Edge Pro Contributors

Greg Weldon

Josef Schachter

Tyler Bollhorn

Ryan Irvine

Paul Beattie

Martin Straith

Patrick Ceresna

Mark Leibovit

James Thorne

Victor Adair