
Energy & Commodities
The Bottom Line
Downside risk in equity markets and most sectors exceeds short term upside potential. Short term weakness will provide an opportunity to enter into seasonal plays this spring including Energy, Mines & Metals, Chemicals and Auto sectors. Energy already is showing early signs of seasonal strength.
An Outlook for Crude Oil
Crude oil recently entered into a period of seasonal strength. What are prospects this year?
EquityClock.com notes that West Texas Intermediate (WTI) crude oil prices during the past 20 years have a period of seasonal strength from the middle of February to the end of July. Average gain per period is 7.5 per cent. The seasonal “sweet spot” is from the middle of February to the end of May. Average gain per period was 6.0 per cent.
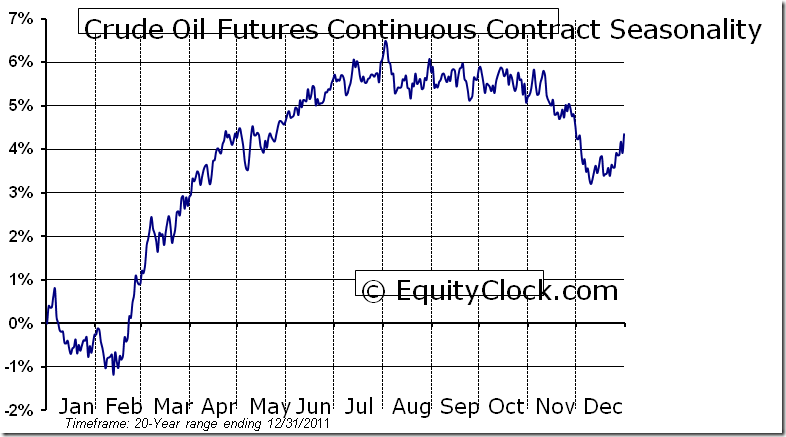
Strength in WTI crude oil prices during the “sweet spot” is related to rising seasonal demand triggered by a recovery in the economy following the slower winter season. Notable gains are recorded by the transportation, construction and auto sectors. Once again, demand by these sectors is expected to rise this spring, particularly in Canada, United States, Japan, China and India.
Crude oil prices during the “sweet spot” this year are expected to be impacted by several special events that have limited supply. The price of Brent crude oil has jumped more than 14 per cent since mid-December despite a gain of only 8 per cent by WTI crude oil. Brent prices have responded to a decision by European buyers to switch from production from Iran to other sources including North Sea oil. Rising Brent prices slowly, but surely, is filtering back to WTI crude oil prices.
Concern about political instability in the Middle East also is an influence. Iran has threatened to close the Straits of Hormuz if attacked. International concerns about Iran’s nuclear program likely will continue to escalate this spring. On Wednesday, Iran denied a rumor that oil shipments to six European nations had been halted due to recent plans taken by European nations to discontinue purchases of crude oil from Iran by July.
On the charts, the technical picture on WTI crude oil prices is positive and improving. Intermediate trend is up. Support is at $95.44 and resistance is at $103.74. Crude oil recently bounced from near its 200 day moving average at $94.59 and broke above its 50 day moving average at $99.32. Short term momentum indicators are recovering from oversold levels. A break above resistance implies intermediate upside potential to $112.75 per barrel.

Investors can participate in seasonal strength in crude oil directly or indirectly. The direct method is to accumulate futures and Exchange Traded Funds that track the price of crude oil. The best known and most actively traded Exchange Traded Fund is United States Oil Fund LP (USO $39.18). In Canada, Horizons offers several currency-hedged Exchange Traded Funds trading in Canadian Dollars that are directly related to crude oil futures. The indirect way to invest in crude oil is in “oily” stocks.
Don Vialoux is the author of free daily reports on equity markets, sectors,
commodities and Exchange Traded Funds. . Daily reports are
available at http://www.timingthemarket.ca/. He is also a research analyst for
Horizons Investment Management Inc. All of the views expressed herein are his
personal views although they may be reflected in positions or transactions
in the various client portfolios managed by Horizons Investment Management.

Some downbeat economic numbers from Europe combined with disappointing earnings from Dell Computer to hold stocks under water on Wednesday.
The stock market has been acting somewhat tired, particularly after the so called “deal” on Greece. There doesn’t seem to be a catalyst to push stocks meaningfully higher on the short term.
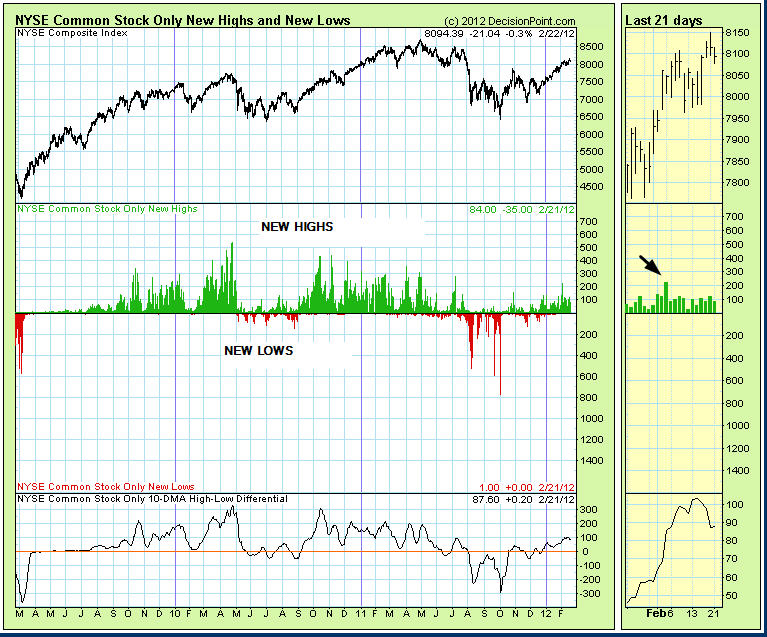
Besides the overbought condition, one indicator that concerns us is the number of new yearly highs. over the past two weeks, as the market has pushed higher, new highs have attenuated (arrow). That is frequently a signal that the market needs a short rest. We can see this in the chart below courtesy of Decisionpoint.com.
Stephen Todd was the #1 2011 Timers Digest Gold Timer of the Year – More #1 Rankings listed below
GOLD: Gold started off rather lackluster, but came on strongly as the day progressed. The yellow metal is looking pretty good here.
BONDS: Bonds rebounded somewhat on Wednesday.
THE REST: The dollar was up a bit and this probably helped push down silver, copper and crude oil, but gold bucked the trend.
BOTTOM LINE:
- Our intermediate term systems are on a buy signal.
- System 2 traders are in cash. Stay there for now.
- System 7 traders are in cash. Stay there for now.
NEWS AND FUNDAMENTALS:
Existing home sales came in at 4.57 million, less than the expected 4.69 million. On Thursday we get initial jobless claims and oil inventories.
————————————————————————————–
- We’re on a sell for bonds as of December 21.
- We’re on a sell for the dollar and a buy for the euro as of January 18.
- We’re on a buy on gold as of Feb. 21.
- We’re on a buy on silver as today Feb. 21.
- We’re on a buy for crude oil as of Feb. 13.
- We’re on a buy for copper as of December 20
We are long term bullish for all major world markets, including those of the U.S., Britain, Canada, Germany, France and Japan.
About the Todd Market Forecast:
RANKED # 1 BY TIMER DIGEST
Timer Digest of Greenwich, CT monitors and ranks over 100 of the nation’s best known stock market advisory services.
Once per year in January, Timer Digest publishes the rankings of all services monitored for multiple time frames.
For the years 2003, 2004 and 2005, The Todd Market Forecast was rated # 1 for the preceding ten years. For the year 2006, we slipped to # 3 and in 2007, we were ranked # 5.
Our bond timing was rated # 1 for the years 1997, 2007 and 2008.
Gold timing was rated # 1 for 1997 and # 2 for 2006. and # 1 for 2011.
We were # 1 in long term stock market timing for the years 1998 and 2004 and # 4 in 2010.
To subscribe go HERE.
We provide daily commentary via e-mail for the stock market, gold,monthly newsletter.
Our approach is mainly technical in nature. We pay attention to chart patterns, volume, overbought – oversold indicators and market sentiment. However, consideration is also given to fundamentals such as interest rates, Fed policy, earnings and the economy.
We have two main approaches. First we seek to provide specific entry and exit points for conservative investors who utilize mutual funds and ETFs. We also give precise instructions for short term traders who utilize ETFs, Options and stock index futures. To subscribe online go HERE
INDICATOR PARAMETERS
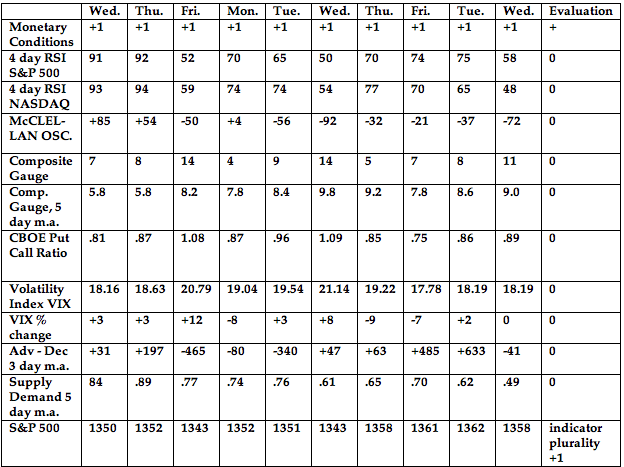
Monetary conditions (+2 means the Fed is actively dropping rates; +1 means a bias toward easing. 0 means neutral, -1 means a bias toward tightening, -2 means actively raising rates). RSI (30 or below is oversold, 80 or above is overbought). McClellan Oscillator ( minus 100 is oversold. Plus 100 is overbought). Composite Gauge (5 or below is negative, 13 or above is positive). Composite Gauge five day m.a. (8.0 or below is overbought. 13.0 or above is oversold). CBOE Put Call Ratio ( Below .80 is a negative. Above 1.00 is a positive). Volatility Index, VIX (low teens bearish, high twenties bullish), VIX % single day change. + 5 or greater bullish. -5 or less, bearish. Advances minus declines three day m.a.( +500 is bearish. – 500 is bullish). Supply Demand 5 day m.a. (.45 or below is a positive. .80 or above is a negative).
No guarantees are made. Traders can and do lose money. The publisher may take positions in recommended securities.

Update: Mark Leibovit’s pre-opening Gold Comment for 02/22/12. GOLD – ACTION ALERT – BUY
Metals took off for the same reason stocks rallied. Platinum saw a new recovery high of 1646 along with Palladium which traded at 717. Silver touched 34.58, just four cents under its February 34.62 peak. Gold fell a tad short too touching 1761.50 versus its February 3 peak at 1764.20. The burden of proof is on the bulls here, but ‘seasonality’ for gold is beginning to run out. I would still like to see silver push back toward my projected 30-31 pullback zone. Afterwards, my target is first 37 on its way to 42-43. Gold targets to the mid 1800s and perhaps back to its record 1922 high, but I was thinking we should first see more of a pullback, perhaps into the 1600s. So far, this market has said it has other plans. Stay tuned.
A Prime Opportunity to Buy Gold Stocks is Imminent
The price action of the past six trading days made it clear that contrary to our previous thinking the XAU did not break out to the upside late last month. A definitive upside breakout and confirmation that the intermediate-term correction ended in late December will require a daily close above 205. (last nights close 198.20)
By its nature, confirmation of an important low will usually be belated and will therefore usually not coincide with a good short-term buying opportunity. In general, buying should be done in response to pronounced weakness, not strength. For example, it made more sense to buy near the start of trading on Thursday 16th February, with the gold stock indices having just fallen for 9 days in a row and looking like they were about to extend the losing streak to 10 days, than to buy at the end of January with the XAU appearing to have just broken out to the upside.
It’s possible that the gold-stock indices bottomed on the morning of 16th February, but at this stage the price action is non-committal. If a short-term bottom had been put in place last Thursday it would have been normal for there to be some follow-through to the upside on Friday, so the fact that Friday was another down-day leaves open the possibility that the indices will make new multi-week lows this week.
If a break to new multi-week lows occurs this week it will create an opportunity for under-exposed speculators to do some buying. It won’t, in our opinion, signal that major additional weakness lies ahead. There is a realistic possibility that the HUI and the XAU will test their late-December lows before the end of this month, but very little chance that they will do worse than that before commencing their next tradable rallies.
The mission of The Speculative Investor (TSI) is to provide our subscribers with information that not only helps them understand and profit from changing financial market trends, but is also interesting and thought-provoking.

The U.S. Dollar is positioned between points 3 and 4 on the monthly chart and around point F on the daily charts. Assuming that support holds close to this month’s lows, the upside target is 93 within the next two years (33 months from the May 2011 low).

The recent four-week correction fit the parameters of 1981 and 1996 well:
- Tested 89-day exponential moving average
- Tested 34-day Bollinger Band
- Generated RSI(14) of 36
- Retraced 49% of the rally from October
First resistance is at 80.50. A failure to close through there could result in another test of support around 78.25. Next target is the upper channel line at 84.
Gold, HUI and the Dollar also continue to track the 2004 model. Therefore, we now recommend that traders view last week’s lows as the critical support in gold and the miners. Independently, timing models point towards a late February to early March high in gold.
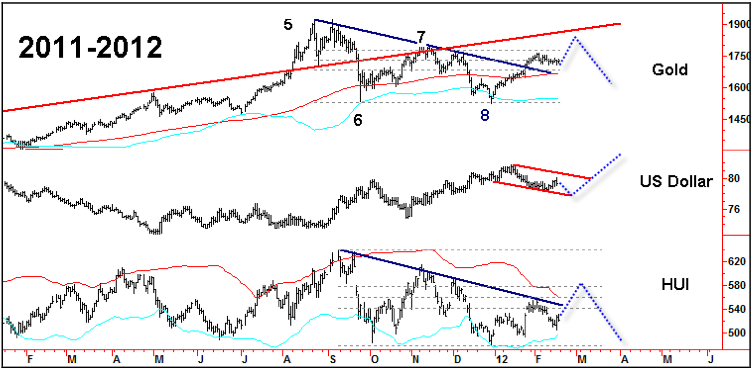
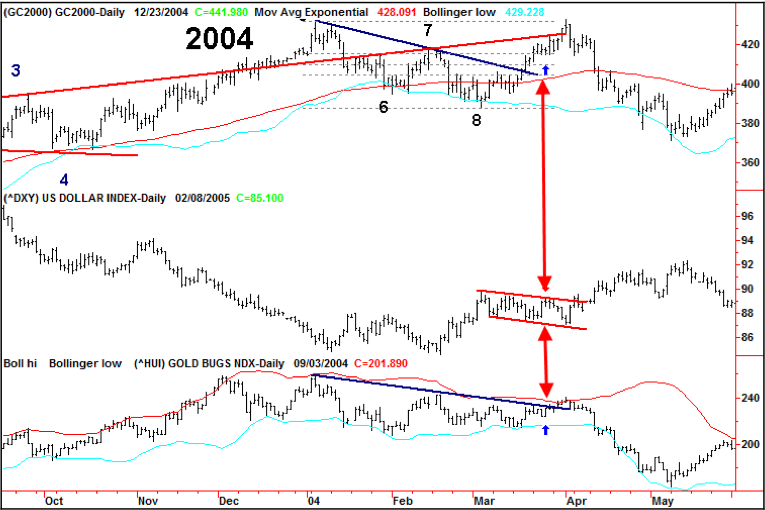
The correlation of Gold’s decade long bull market with the 1976-80 run from $100 to $850 continues to center around the action of the U.S. Dollar. The current price patterns relate to November 8, 1979. A close above 81 in the Dollar and a close below $1640 in gold would be outside the model. However, a close below 78 would be a catalyst for upside action in virtually all asset classes (except T-Bonds).

CHARTWORKS – 2/19/2012
BOB HOYE, INSTITUTIONAL ADVISORS
EMAIL bobhoye@institutionaladvisors.com” data-mce-href=”mailto:bobhoye@institutionaladvisors.com“>bobhoye@institutionaladvisors.com
The opinions in this report are solely those of the author. The information herein was obtained from various sources; however we do not guarantee its accuracy or completeness. This research report is prepared for general circulation and is circulated for general information only. It does not have regard to the specific investment objectives, financial situation and the particular needs regarding the appropriateness of investing in any securities or investment strategies discussed or recommended in this report and should understand that statements regarding future prospects may not be realized.
Investors should note that income from such securities, if any, may fluctuate and that each security’s price or value may rise or fall. Accordingly, investors may receive back less than originally invested. Past performance is not necessarily a guide to future performance. Neither the information nor any opinion expressed constitutes an offer to buy or sell any securities or options or futures contracts. Foreign currency rates of exchange may adversely affect the value, price or income of any security or related investment mentioned in this report. In addition, investors in securities such as ADRs, whose values are influenced by the currency of the underlying security, effectively assume currency risk. Moreover, from time to time, members of the Institutional Advisors team may be long or short positions discussed in our publications.

In order to estimate likely returns and risks in the financial markets, our general approach is to identify a set of historical instances that match current conditions on a broad range of important dimensions. In reviewing market conditions this week, what strikes me most is the pattern that emerges when we look across various horizons, from 2 weeks out to 18 months.
The chart below identifies periods in recent years where we reported market conditions as being at least “overvalued” and “overbought” in these weekly commentaries. Those two conditions alone aren’t enough, by themselves, to put the market in a “hard-negative” situation, but even those two tend to be enough to invite drawdown risk. The overvalued, overbought periods are shaded in blue on the chart below. The red lines indicate the deepest drawdown experienced by the market over the following 18 months (right scale), while the blue line charts the S&P 500 (left scale). Notably, even with weakly negative conditions – overvalued and overbought – the market has typically moved lower at some point in the next 18 months, wiping out all intervening gains. That surrender of intervening gains usually begins with a very hard and unexpected initial loss that takes out the bulk of upside progress within a period of a few days or weeks. This is a general pattern that we also see throughout market history.
….read the entire article (its well worth reading in ful)l:

-
I know Mike is a very solid investor and respect his opinions very much. So if he says pay attention to this or that - I will.
~ Dale G.
-
I've started managing my own investments so view Michael's site as a one-stop shop from which to get information and perspectives.
~ Dave E.
-
Michael offers easy reading, honest, common sense information that anyone can use in a practical manner.
~ der_al.
-
A sane voice in a scrambled investment world.
~ Ed R.
Inside Edge Pro Contributors

Greg Weldon

Josef Schachter

Tyler Bollhorn

Ryan Irvine

Paul Beattie

Martin Straith

Patrick Ceresna

Mark Leibovit

James Thorne

Victor Adair