
Stocks & Equities
Warren Buffett and Berkshire Hathaway’s latest stock holdings were released and there were some interesting additions and deletes, as well as many internal changes of existing positions up or down.
American Express Co. (NYSE: AXP) was over 151.6 million shares, SAME AS last quarter.
Bank of New York Mellon Corp. (NYSE: BK) was 1,793,915 shares, SAME AS last quarter.
CVS Caremark Corporation (NYSE: CVS) is LARGER POSITION at 7.106 million shares after having been a new holding in a recent quarter.
Comdisco Holdings (NASDAQ: CDCO) was roughly 1.5 million shares, SAME AS BEFORE.
Coca Cola Co. (NYSE: KO) was right at 200 million shares, SAME AS BEFORE.
ConocoPhillips (NYSE: COP) is roughly 29.1 million shares, roughly the SAME AS BEFORE but it is still lower than previous quarters.
Costco Wholesale (NASDAQ: COST) 4,333,363 Shares, SAME AS last quarter after having lowered it before.
Da Vita Inc. (NYSE: DVA) is a NEW POSITION of 2.684 million shares worth $203 million.
DirecTV (NASDAQ: DTV) is a LARGER POSITION listed as 20.348 million shares worth $870 million; was a new position of 4.249 million shares one quarter earlier.
Dollar General Corporation (NYSE: DG) is that SAME SIZE as before at 4.497 million shares; was a new position and a grown position before. This one of our Top Stocks for the Next Decade.
Gannett Co. (NYSE: GCI) was 1.74 million, SAME AS BEFORE but decreased in prior quarters.
General Dynamics Corporation (NYSE: GD) is a LARGER POSITION of 3.877 million shares worth $257 million after being a new position before of 3.064 million shares.
General Electric Corp. (NYSE: GE) is 7.777 million shares; SAME AS before.
GlaxoSmithKline (NYSE: GSK) 1.51 million shares, SAME AS last quarter.
Ingersoll-Rand (NYSE: IR) was 636,600; SAME AS last quarter but still way down from prior reports.
Intel Corporation (NASDAQ: INTC) is a LARGER POSITION of 11.495 million shares worth $278 million; this was a new position of 9.333 million shares last quarter.
International Business Machines Corporation (NYSE: IBM) is now 63.905 million shares worth some $11.75 billion now after having been a new position with an average cost of about $170 per share.
Johnson & Johnson (NYSE: JNJ) was a LOWER POSITION of about 29 million shares; lower than 37.4 million last quarter and way under the peak of 62 million shares at one point in prior quarters.
Kraft Foods (NYSE: KFT) was a LOWER POSITION at about 87 million shares, down from 89.7+ million last quarter and this has continued to be lightened up since the Cadbury purchase.
Exxon Mobil Corp. (NYSE: XOM) was ELIMINATED FROM THE PORTFOLIO after having been only 421,800 shares last quarter and lowered earlier.
PAGE TWO…BUFFETT HOLDINGS ‘L to Z’ HERE

There is no question that real estate has been one of the (5) primary sectors within the economy. Real estate speculation has been systemic. In effect, it was the inspiration behind both the South Sea Bubble and Mississippi Bubble of 1720. While I provided a forecast for real estate of the United States in the issue of November 15th, 2009, I have also written about the Athenian Real Estate Crisis and Speculative Bubble during the 4th Century BC in the October 2010 issue.
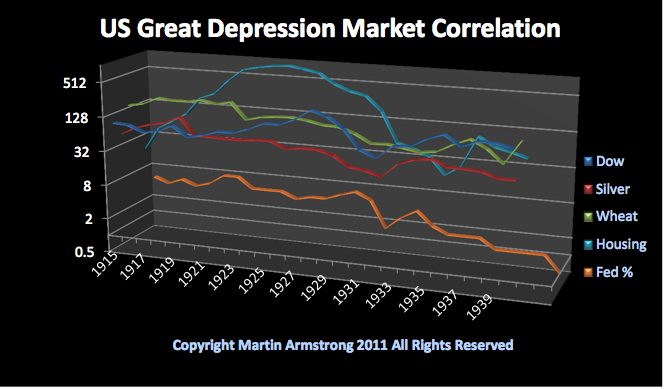
Real Estate Bubbles often preceded serious economic declines. The US Great Depression of the 1930’s Market Correlation shows the layout of the various sectors. The commodities peaked with the Great Bubble of 1919 and generally declined into 1932. The stock market bubble was brewing headed into 1929 shifting from the Railroad stocks that peaked in 1907 to the first Industrial stock boom lead by the automobile industry. Howevever, you will notice the biggest bubble was in Real Estate (TOP LINE). The most famous Real Estate Bubble going straight into 1925 was the Florida Land Bubble. People were building places, selling them to other investors, while there really was nobody actually living in a lot of the places. That was no different than the Real Estate Bubbles of the 1790’s.
Ed Note: This is the first two paragraphs plus Canada of a 33 page report analysing every significant real estate market in the world. Martin does all of the historical analysis going back 1000’s of years, and Petra Gajdosidova does the markets today. Go HERE to gain a per access service to Armstrong Economics specific forecasts for time & price.
CANADA
The Canadian housing boom shared some aspects of the US boom, including low (5%-10%) deposit and for a short period, no money down mortgages. The houshold debt to income ratio has continued climbing steadily for the last decade and is now at US and UK levels. The value of housing related debt in Canada has nearly tripled in the last decade to C$1.3 trillon (Bank of Canada). A large percentage of Canadian mortgages are insured by the Canada MOrtgage and Housing Corporation, i.e. the taxpayer (CMHC) insurance is required for all mortgages with less than 20% downpayment).
While some Canadian cities offer reasonable affordability compared to household incomes, Vancouvers housing is, by any measure, highly overvalued and vulnerable to a sharp correction. Prices have risen 55% from their 2009 trough to a level 29% above their prior peak. The average home price reached nearly C$800,000 (according to CMHC).
Strong Asian demand has provided a boost to already high prices. Thousands of mainland Chinese have moved to Vancouver (following the earlier waves of immigration from Taiwan and HK); thousands more invested in (mid-range to high end) real estate in order to park their cash in a stable Western country and/or to set their children up at Canadian colleges and with eventual Canadian citizenship, all driving prices to what are now clearly unsustainable levels.


With investors globally wondering what central planners are up to next and how it will impact gold, today the Godfather of newsletter writers, Richard Russell, was discussing this very subject: “A few months ago I wrote a piece about avoiding pain in the economy. How do we do it? We do it by turning away from austerity and embracing inflation. And the question — will the inflationary method of avoiding economic pain kill our economy, just as the drug (taking drugs) way of avoiding pain has killed so many talented musicians? I think the results will be the same.”
Richard Russell continues:
“The world has drunk at the punch-bowl of good times and debt ever since World War II. The world has avoided the discipline of pay-as-you-go and austerity for decades. But sooner or later the piper must be paid. Up to now, the piper has been ‘paid’ with vast amounts of fiat paper.
The politicians want to make the people happy. The Fed is beholden to the politicians. The voters want it all, and they don’t like pain. The Fed and the politicians want to make the voting public fat and happy causing as little pain as possible.
Examples: courtesy of Bill Gary’s great publication, ‘Price Perceptions.’
Last week the Fed announced that they were extending the current near-zero interest rates out to the end of 2014.
The European central bank gave in and finally reduced interest rates to 1%.
The Bank of England is meeting next week to decide on another round of QE. (money printing).
This week the Bank of Australia will decide on whether to reduce rates again.
The Swiss National Bank placed a currency floor of 1.2 francs per euro in September to prevent further strengthening of the franc.
Japan has been printing for years in an effort to keep the yen cheap and competitive against other currencies.
Every nation wants a cheap and export-friendly currency. The result is a blizzard of (fiat) paper money blowing across the face of the earth.
Inflation is the central banks’ method of avoiding the pain of austerity. Inflation is the current economic narcotic that is used by modern nations. It’s the old ‘beggar thy neighbor’ system, and it will ultimately result either in all out hyperinflation and a collapse of the fiat currency system or a corrective deflationary crash. Either way, the last currency standing will be gold.”
To subscribe to Richard Russell’s Dow Theory Letters CLICK HERE.


 For the first time since the last week of December of 2011, the S&P 500 Index closed lower on the weekly chart. Recently I have been discussing the overbought nature of stocks based on a variety of indicators. However, the real question that should be asked is whether last week was just a short term event or if we see sustained selling in coming weeks.
The issues occurring in Greece spooked the markets somewhat on Friday as Eurozone fears continue to permeate in the mindset of traders. The U.S. Dollar Index is the real driver regarding risk in the near and intermediate term future. If the Dollar is strong, market participants will likely reduce risk. However a weakening Dollar will be a risk-on type of trading event which could lead to an extended rally in equities, precious metals, and oil.
Friday marked an important day for the U.S. Dollar Index futures as for the first time in several weeks the Dollar held higher prices into a daily close. The U.S. Dollar appears to have carved out a daily swing low on the daily chart from Friday. Furthermore, the potential for a weekly swing low at the end of this week remains quite possible. The chart below illustrates how the 100 period simple moving average has offered short term support for the past few weeks.
….read more and view charts HERE

-
I know Mike is a very solid investor and respect his opinions very much. So if he says pay attention to this or that - I will.
~ Dale G.
-
I've started managing my own investments so view Michael's site as a one-stop shop from which to get information and perspectives.
~ Dave E.
-
Michael offers easy reading, honest, common sense information that anyone can use in a practical manner.
~ der_al.
-
A sane voice in a scrambled investment world.
~ Ed R.
Inside Edge Pro Contributors

Greg Weldon

Josef Schachter

Tyler Bollhorn

Ryan Irvine

Paul Beattie

Martin Straith

Patrick Ceresna

Mark Leibovit

James Thorne

Victor Adair