
Real Estate
The average condo price in Greater Vancouver shot up 5% month over month, bringing an end to the divergent trend. Also sending prices to the highest price point since October 2018. March realized a sales price of $699,015 just below the upper echelon of the current market cycle.
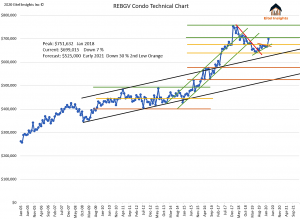
Eitel Insights has suggested selling into this pocket of strength rather than purchasing. Unlike so many other analysts who proclaimed 2019 as the bottom. Sellers who heeded our advice should be overjoyed at achieving the highest sales price over the previous 20 months. While purchasers who took the advice of other analysts might not feel so enthused.
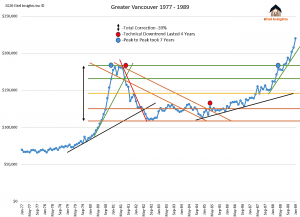
There is a notion that Greater Vancouver would be immune to any significant correction to our Real Estate market. That is a complete fallacy, a little history reminder. April 1981 Greater Vancouver (detached) prices were $181,200. Prices immediately took a nose dive and by August 1982 prices had declined 39% to 110,300. Equally as important the prices remained at correction levels until December 1984 when prices were still hovering at $113,000 -37% from the peak. Of course this occurred during the interest rate hike and that was an extraordinary time. But I would argue we are living in an extraordinary time now as well.
Another live example would be how the equity markets have performed over the recent months. The Dow Jones peak was 29,500 the near term bottom was 18,275 (technically important level) which represented a 38% correction. The TSX has had a similar sell off, at the peak
the TSX was around 18,000 and the near term bottom arrived around 12,000 a 33% correction.
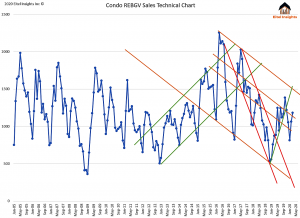
Sales in March were nominal and came in just below 1200 completed sales. One point of interest, the sales numbers recorded by the Real Estate Board are completed sales, meaning the deal has completed at land titles. While the average price that is reported by the board is on accepted offers, which are legally binding contracts but not completed…. Enter the lawyers.
The level of sales Eitel Insights is interested in is 1425. That level of sales has not been eclipsed in the past two years and what we have our eye on during this upcoming quarter. The market will not likely surpass this level in 2020.
The economic landscape is clearly in a negative forecast, with no quick solution obvious. While the National and Provincial Governments attempt to mitigate the Covid-19 impact, inevitably there will be a real life impact for the condo market in Greater Vancouver. Purchasers who have waited this long, might as well continue to wait as the chaos is just about to ensue.
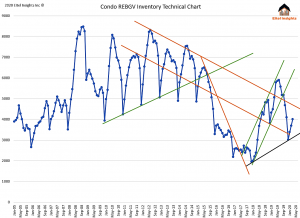
The inventory in March surpassed the 4000 active level. Eitel Insights anticipates the actives to rapidly rise over the upcoming 2 quarters. With job losses transpiring and likely to continue, the only option to accrue money, for most, might be to sell their highest valued asset, the property.
In the past we have mention a cannibalization of the condo market would be coming. That will begin to become more and more prevalent. By cannibalization, we mean the new buildings will trump older buildings. The insurance issues will only perpetuate this situation. Owners of older buildings will have to offer their units at low prices to merely compete with the newer buildings who have warrantees.
The desperation levels amongst sellers will continue to build as a majority of sellers will attempt to achieve the highest dollar amount and ultimately chase the market lower. Our advice bite the bullet. Offers coming in now will look amazing in a years’ time.
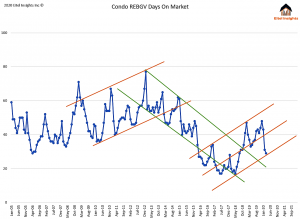
For Eitel Insights clients who have already taken advantage of this pocket of strength just achieved the highest sales price in the past 20 months and sold in the lowest amount of days since September 2018. The active days on market for sold listing in March came in at 29.
Stick with Eitel Insights for Actionable Intelligence through Analytical Interpretation.
Not all markets are created equal while some fall other rise. Become an Eitel Insights client and receive Actionable Intelligence on Real Estate across Canada, visit our website.
Watch Eitel’s latest video here:

The Dollarama (TSX:DOL) stock price outperformed the TSX in March, as the company navigated its way through the coronavirus crisis.
All eyes were on developments related to the coronavirus. Societies are attempting to lessen the human toll of this virus by taking measures that were unimaginable only a few months ago. As the realities of social distancing and isolation became increasingly clear, the economic fallout also become crystal clear.
For Dollarama, the fallout is not as severe as it is for many. Dollarama has essential business status, and, as such, the hit to the company’s financials has been manageable.
This was reflected in Dollarama’s stock price outperformance in March, when it beat the TSX by 94%. At the time of writing, Dollarama’s stock price fell 10% year to date. This also compares very favourably to the TSX Index’s year-to-date performance of a loss of 20%…CLICK for complete article

Infamous for his painful but ultimately profitable “big short” bet against mortgage-backed securities during the 2008 financial crisis, Michael Burry, the doctor-turned-hedge-fund-manager has been on a multi-day Twitter rant claiming that the lockdowns intended to contain the COVID-19 pandemic are worse than the disease itself. Echoing the thoughts of many, Burry opined in a series of tweets over the past two weeks that the government-enforced lockdowns and business shutdowns across America may trigger one of the country’s deepest-ever economic contractions, and further still, are not necessary to contain the epidemic (on March 22nd)… CLICK for complete article
Eradicate the virus — without a vaccine? Manage infection rates to let the population “build immunity through suffering” until a vaccine is available? How can we revive the economy without risking thousands of deaths in fresh outbreaks?
I think we’re now at the turning point in the fight against COVID-19. Everyone’s now acting to stop the spread, and the early hot spots in Europe, North America, and Australia are seeing signs of progress, just as the Asian nations did earlier. There is a long road ahead, and we have to decide which route to take, but Western societies are showing they can handle this too. In this post I’m going to show updated versions of my three favorite graphs, which tell the story and lead to the single biggest public policy-making challenge many nations may face this decade… CLICK for complete article

-
I know Mike is a very solid investor and respect his opinions very much. So if he says pay attention to this or that - I will.
~ Dale G.
-
I've started managing my own investments so view Michael's site as a one-stop shop from which to get information and perspectives.
~ Dave E.
-
Michael offers easy reading, honest, common sense information that anyone can use in a practical manner.
~ der_al.
-
A sane voice in a scrambled investment world.
~ Ed R.
Inside Edge Pro Contributors

Greg Weldon

Josef Schachter

Tyler Bollhorn

Ryan Irvine

Paul Beattie

Martin Straith

Patrick Ceresna

Mark Leibovit

James Thorne

Victor Adair