
Real Estate
Canada is a country of movers, but apparently not everyone wants to move. Statistics Canada (Stat Can) data shows hundreds of thousands of households were forced to move in 2018. Canadian households forced to move were largely due to evictions and foreclosures.
Forced To Move, A.K.A. Evictions And Foreclosures
Today we’re looking at the number of people forced to move, across Canada. Forced could be by a landlord, bank, other financial institution, or the government. In other words, it’s the number of evictions and terminations that occurred in 2018. This is the first data available from Statistics Canada, so we can’t compare it over time. We can compare it to other provinces, and the national rate though. At least we’ll know which provinces are over and under represented.
The territories are included in our charts. Due to the low volume of households though, it’s not really fair to compare them to other provinces. For that reason, we excluded territories from the percent of household counts.
A LOT Of People Are Forced To Move In Ontario
There were a lot of people that were evicted or foreclosed from their home last year. Canada saw 330,800 foreclosures in 2018, or about 2.2% of all households. Ontario had the bulk of forced moves, coming in with 127,600 in 2018, about 38.6% of the total. British Columbia followed with 81,200 forced moves, around 24.5% of the total. Quebec came in third with 61,400 forced moves, representing 18.6% of the total. B.C. has fewer households than Quebec, but a higher number of evictions. CLICK for complete article

Since dropping below the descending channel on Nov. 25, Bitcoin (BTC) has reclaimed $7,000, cleared some hefty resistance at $7,400 and now made its way up to above $7,500 by press time.
Investor sentiment remains muted as traders are unsure whether Bitcoin price has found a bottom yet but the technical setup is clearly improving on the shorter timeframe.
Despite this, the Crypto Fear and Greed Index shows sentiment still in the extreme fear zone. One would expect this figure to improve if the daily candle closes above the resistance at $7,350.
Bullish scenario
If Bitcoin can hold the $7,075 support and avoid dropping below the descending channel trendline at $6,712, investors may feel that the digital asset has bottomed and begin to open long positions in the current range.
From a momentum traders’ point of view, the price has completed the cycle of touching the upper trendline of the descending channel and also the bottom trendline so once further confirmation of a price bottom is provided, swing traders will probably consider entries within the current range.
Traders entering long positions without leverage are likely anticipating an 18% to 25% gain, assuming Bitcoin slowly works its way back up to the main trendline of the descending channel.
Some traders have also noted that if Bitcoin can gain above $7,300, this would complete the inverse head and shoulders pattern and possibly send the price to the middle support of the descending channel which aligns with the $7,800 resistance — a high volume node on the VPVR…CLICK for complete article

Just over a week ago, Bill Gates reclaimed the familiar title of the world’s richest person after seeing his net worth jump to the $110 billion mark.
The recent gains can be attributed to a surge in Microsoft’s stock price, after the tech company surprised the market by winning a $10 billion cloud contract from the Pentagon. This also pushed Gates past fellow Seattle billionaire Jeff Bezos, who currently holds a $108.7 billion fortune.
With these numbers topping a hundred billion dollars, they can be difficult to comprehend. Luckily for us, Twitter user @betty__cam put together a short animation that simplifies things.
$110 Billion, Visualized
The following one minute animation starts with the median household wealth in the United States of $61,937, working its way up to the Bill Gates fortune of $110 billion…CLICK for complete article
The Greater Vancouver Condo sales prices for October came in a $661,204 slightly down from the previous month. More importantly is the technical test that the Condo Market is going through. As Eitel Insights clients and followers know we analyze markets using Technical Analysis. Technically this market is attempting to regain position above the higher of the two yellow lines in the chart below (line indicates $675). The technical price point of $675,000 is hugely important. The market during 2017 spent over 7 months deciding whether prices should go above that psychological value, and at the time the market answered a resounding yes. As we all know the Greater Vancouver Condo Market peaked in Jan 2018 with sales prices fetching over $750,000.
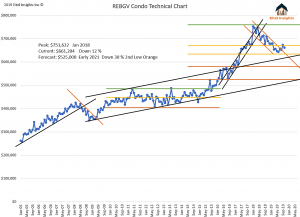
This most recent test to try and stabilize the market will fail just as the attempt to regain position above $675,000 will fail ultimately. As Eitel Insights prescribed in our last monthly update the condo market does lag the Detached Market. As such the Detached Market will be experiencing “need based selling” in 2020. The condo market is in a slightly better position currently, however with prices reaching an average sales price of $525,000 in 2021. The need based selling will eventually rear its ugly head in the condo market as well. That means a further drop of 18% ($135,000) on top of the 12% already realized. We have stated money saved is money earned. When you understand the Condo Market lags the Detached Market it is very difficult to understand how folks could believe the Condo Market has hit its bottom.
Keep in mind the Inventory levels will be through the roof over the next two years as those pre-sold condo’s come to completion and the market will experience an additional factor that will force prices lower as the old supply demand factors show up.
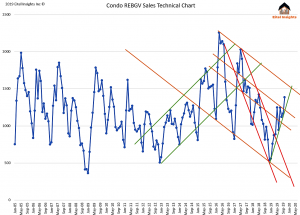
The sales numbers continue to impress and actually has established a very aggressive uptrend as you can see in the chart. This is a natural reaction after seeing such a catastrophic fall off in sales. This is known as a dead cat bounce. The downtrend is still very much in play as the top line has not been tested yet. There is always a demand for primary ownership in the Greater Vancouver Condo Market, however the investors are on vacation and will remain so for years. The purchasers who have been buying, have had their patience tested and were forced to wait until prices came down. When prices decreased to $643,000 in June 2019 that represented a %15 loss, which caused the buyers to take advantage. We would recommend waiting to purchase a condo property until we are closer to the technical bottom in terms of pricing.
Eitel Insights does believe in paying off your own mortgage rather than someone else’s through renting. However with prices going down a further $135,000, there is a more opportune moment to purchase. Always ideal to begin your property ownership seeing prices rise rather than fall. That is the type of actionable intelligence we take pride in.
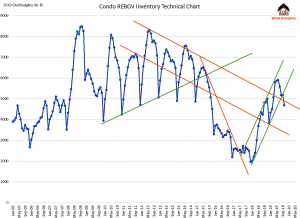
The inventory has broken out of its aggressive growth trend for the first time since its inception in December 2017. As we say this was an aggressive trend and with realization the market is headed lower we sympathize with sellers resisting to sell at these prices, possibly by listening to the optimistic analysts. Unfortunately if the sellers wait for the spring they will be punished with more competition and ever lowering prices. Again our advice to owners of the Greater Vancouver condo market, start planning for years of chaos, or better yet get in touch with Eitel Insights and we can discuss your personal properties forecast.
Why is the Greater Vancouver Townhouse Market Only Down 7%?
The last bastion of hope in the Greater Vancouver Real Estate market is the Townhouse asset class. With prices only down 7% from the peak (September 2018 $917,399). Why is this market seemingly the strong hold? Simply answer is the townhouse market is a catch all. From the downsizing elderly that do not want to live in a 40 storey building with 2 elevators; and the couple needing more space for the growing family and the detached prices are out of reach.
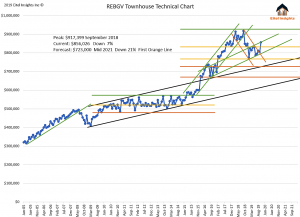
The natural step out of a Condo is into a townhouse especially over the past decade as the price spread between the Condo and Detached prices has increased. Prices have dropped as low as $775,000 representing a 15% decline however with the stress test introduced in 2018 the forced acceptance of a lower purchasing power has forced potential entry level Detached buyers into the Townhouse market. This is best exemplified as the technical top in the Townhouse did not occur until September 2018 long after the Detached market had topped and an additonal 8 months after the Condo market peaked.
Technically the Townhouse market has more uptrends that will show support for the prices going forward and causing this asset class to be the “cleanest shirt in the dirty laundry”. Eitel Insights is forecasting a market cycle of 21% – 26%. In our Chart you can see two orange lines that represent psychological pricing levels that the market will inevitably return to. Currently the market has tested the middle ground and is responding to the conservative uptrend established in August 2016. Going forward this conservative trend will be broken and prices will indeed dip to $723,000 signalling a loss of 21% from the peak. If that price point does not hold the next level tested will be $676,000 (26% loss) and that will definitely be the buoy that bottoms out this market likely in mid 2021.
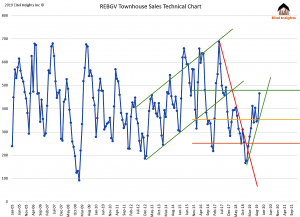
Sales for the Townhouse market were near all-time highs for 3 consecutive years from 2015 – 2017. Interestingly the peak in sales prices occurred when the sales where at the low of the projected market cycle for sales. Again signaling to us that there was forced purchasing in the majority of 2018 due to the stress test. The falling knife trend in sales has been broken and the range will begin to be filled out in the upcoming years. Likely finding peak selling months hovering round 480 sales and low months seeing 250 sales.
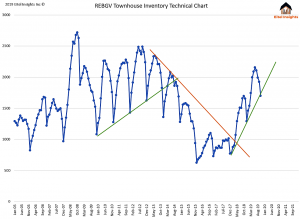
Due to the high sales during 2015 – 2017 it is an obvious correspondence that the Townhouse market experienced a serious lack of inventory during 2015 – 2018. 15 year historic low levels to be exact, in December 2015 the market had its lowest level coming in at 626 active listings. Current numbers are in the middle of the chart and testing the staunch uptrend that has propelled the market inventory to see over 2100 active listings in June 2019. We anticipate seeing levels grow in the spring, summer of 2020 and prices will indeed find a new downtrend to follow until we see a market base. Unlike the Detached market where some areas are nearing their technical bottoms and owners are advised to hold, the Townhouse market will experience a drop of definite 14% from current levels representing over $120,000 of equity. With a realistic chance of seeing the market go down 19%, over $240,000.
For more info please visit www.eitelinsights.com
Watch Eitel Insights latest videos:
Growth investing can be extremely challenging, especially when the stocks in which you are investing have no earnings. Speculative cannabis investors have been taught a harsh lesson over the course of the past year, with many of these stocks being absolutely crushed in the latter half of 2019. How bad has it been? Well, let’s look at some of the performances of some of the better-known stocks over the past year.
Cannabis stocks have been crushed
The better-known stocks in the Canadian cannabis space are Aphria, Aurora Cannabis, and Canopy Growth. It is interesting to note that there is not one single stock among the bunch that has survived the carnage. Not a single stock has the investor clout and financial strength.
Every single stock has basically been cut in half or more over the past year. Aphria has fallen almost 48% from a year ago. Aurora has fallen even more, down 55% year over year. Even Canopy Growth, which was arguably the biggest and best of the bunch, is down 45% at the time of this writing.
Even owning a basket of stocks wouldn’t have helped much over this time frame. Horizons Marijuana Life Sciences ETF has been similarly crushed, down almost 48% over the same period. You have to realize how big an issue this is, since an ETF is usually a good way to mitigate a loss by diversifying….CLICK for complete article

-
I know Mike is a very solid investor and respect his opinions very much. So if he says pay attention to this or that - I will.
~ Dale G.
-
I've started managing my own investments so view Michael's site as a one-stop shop from which to get information and perspectives.
~ Dave E.
-
Michael offers easy reading, honest, common sense information that anyone can use in a practical manner.
~ der_al.
-
A sane voice in a scrambled investment world.
~ Ed R.
Inside Edge Pro Contributors

Greg Weldon

Josef Schachter

Tyler Bollhorn

Ryan Irvine

Paul Beattie

Martin Straith

Patrick Ceresna

Mark Leibovit

James Thorne

Victor Adair