
Currency
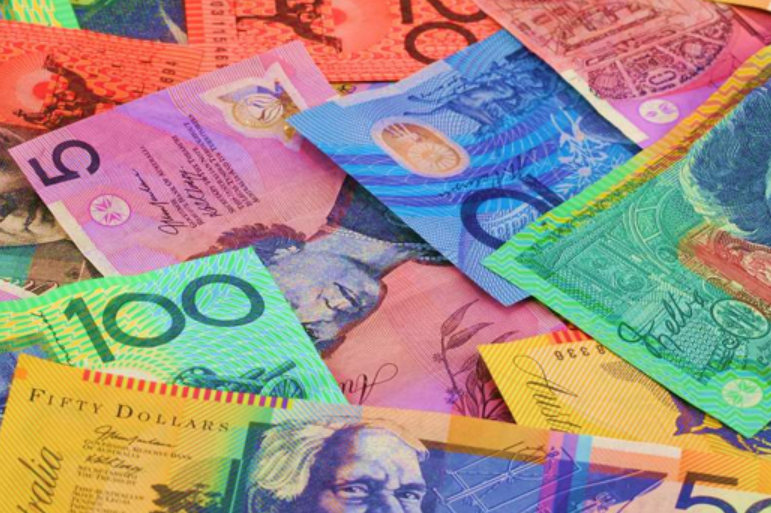
The Australian dollar has been the worst performer among the world’s major currencies this year, dropping like a rock against most other currencies apart from the Swedish krona. AUD has weakened about nine percent against the U.S. dollar, currently changing hands at 73.91 cents against the greenback from the January high of 81.15 cents.
Despite the deep slide, the current optimism that the Aussie has found a bottom may be a tad premature…. CLICK for complete article

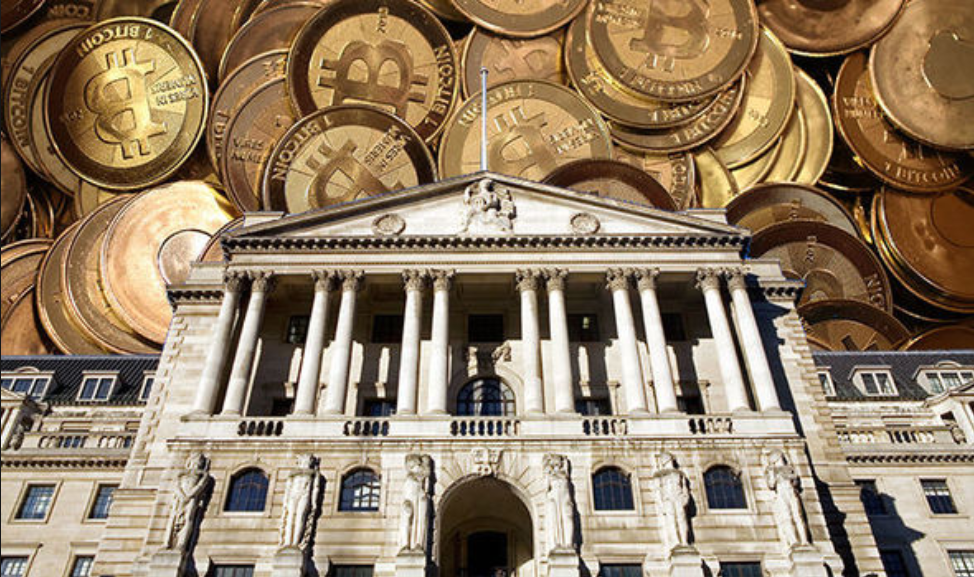
Bitcoin was created in the wake of the 2008 financial crisis that wreaked havoc on the world economy, but it hasn’t quite had the chance to prove itself since. The fact is, stock markets have been doing well. Really well. Especially in the U.S. But now, some analysts are beginning to sound the alarms…. CLICK for complete article

Gold has had a rather hard time of it during the past several months, as we can see on its latest 1-year below, but its drop has been proportionate to the rally in the dollar, and is therefore unremarkable. What this drop has achieved, which is a useful precursor to a recovery, is to finally flush out the Large Specs, who, after outstaying their welcome, have finally packed their bags and left. This we can see on the latest COT chart which is stacked right below gold’s 1-year chart for direct comparison.
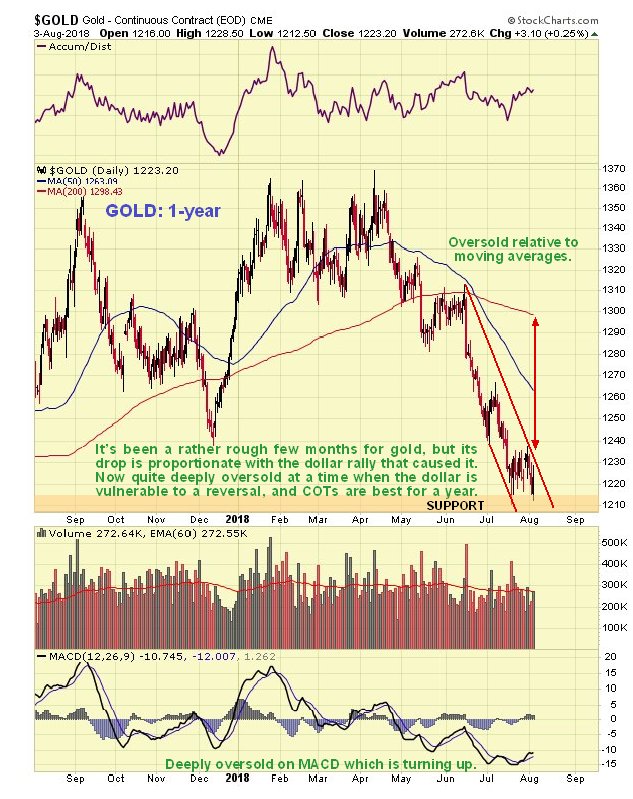
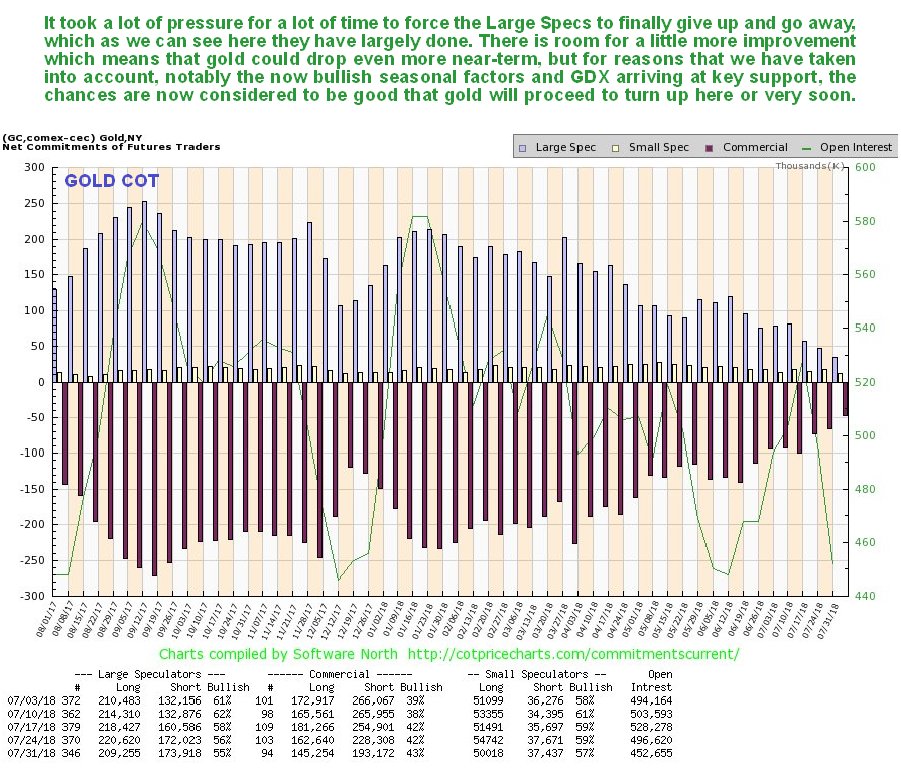
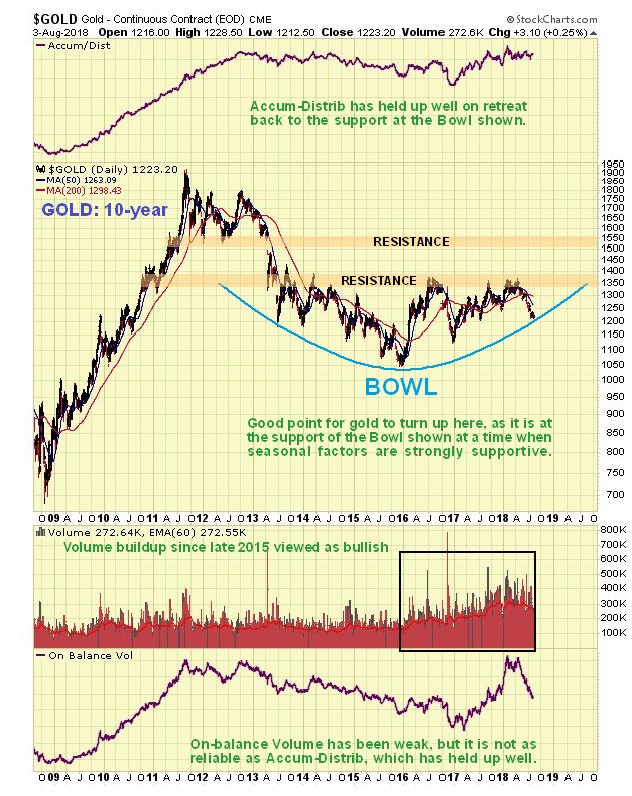
Click on chart to popup a larger, clearer version. Points worth noting on these charts include the following: gold is now oversold on its MACD and relative to its moving averages and when you couple these facts with the now cleaned up COT and strongly bullish seasonal factors now in play that we will look at shortly, we can see that there is a strong case for gold turning up here, which implies that the dollar will soon drop, so we will look at that later too. The positive divergence of the Accum – Distrib line relative to the gold price over the past couple of weeks is worth noting too. Taking all of the above into account it is thus very interesting to observe gold’s latest 10-year chart on which we see that its price has dropped down to arrive at the support of a giant Bowl pattern, so, again, this is a very point for it to turn up. The pattern in gold since early – mid 2013 may also be described as a complex Head-and-Shoulders bottom which is not shown here as it would make the chart rather messy, and the Bowl pattern suffices to define what is going on, at least for now.
Seasonally, it could not look better for gold as it has just entered its most bullish time of year, and here we should note that seasonal factors are an important influence for gold, with heavy buying in India ahead of the wedding season being one important factor behind it.
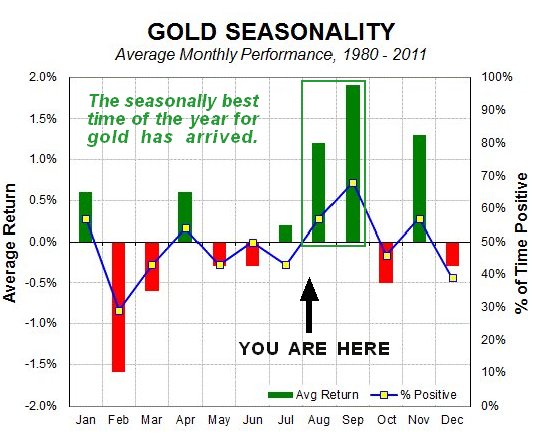
Chart courtesy of sentimentrader.comThe Gold Risk Levels chart, a new one for us, shows, as its name implies, that the risk involved in buying gold here is low. We can see on this chart that there is a good correlation between extremes on it and reversals in gold, both up and down. Whilst it could drop a little more to reach rock bottom, which would involve gold dropping back some more, it is saying that gold is either at or close to a bottom here…
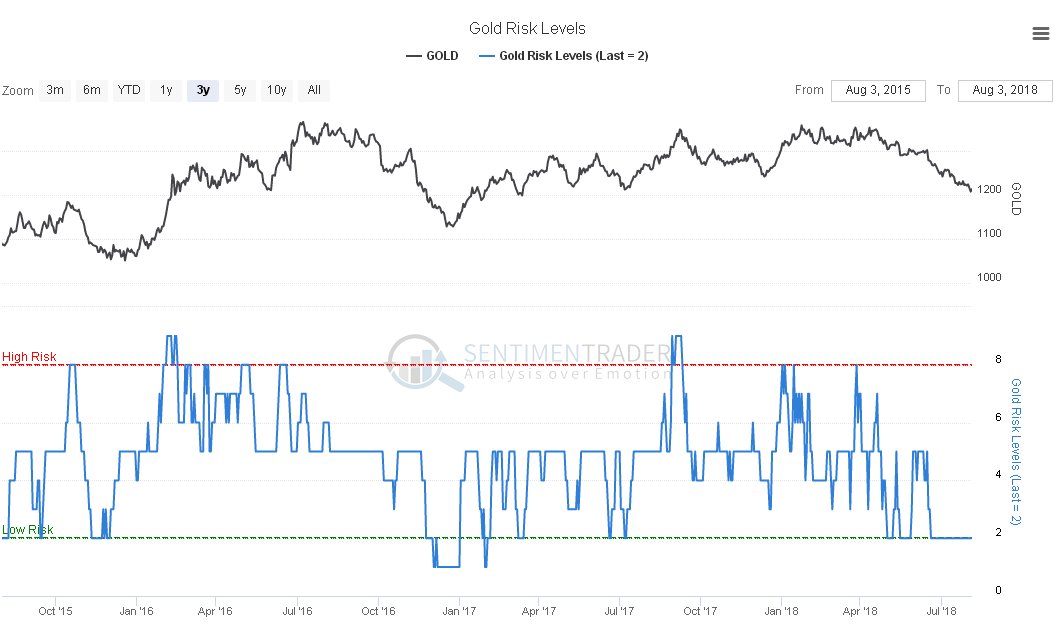
Click on chart to popup a larger, clearer version. Chart courtesy of sentimentrader.com
Now we look at the all-important dollar, which alone is responsible for gold having fallen down the stairs in recent weeks. The timeframe for seeing to best advantage what is going on in the dollar index chart is a 2-year one. On the 2-year chart we can see exactly why the dollar’s advance has stalled out in recent weeks where it has – it has arrived at an important resistance level at its October – November 2017 peak – and the entire pattern from that peak suggests that a large Head-and-Shoulders bottom may be forming, with the index getting ready to drop down to complete the Right Shoulder of the pattern. Whilst this interpretation may be incorrect and the dollar suddenly resume its rally, this is made less likely by gold’s latest COT which supports an immediate gold recovery and therefore a drop in the dollar. If the pattern is indeed a Head-and-Shoulders bottom, then it has major implications because it means that the dollar index will later run to a target in the 102 – 104 area or even higher, which we can expect to coincide with a broad based asset collapse, as in 2008. After that the emergency measures that we can expect to be implemented by the Fed and other monetary authorities, in the Fed’s case some form of QE4, will usher in a dollar collapse and hyperinflation, which must be the endgame result of years of excess and profligacy.
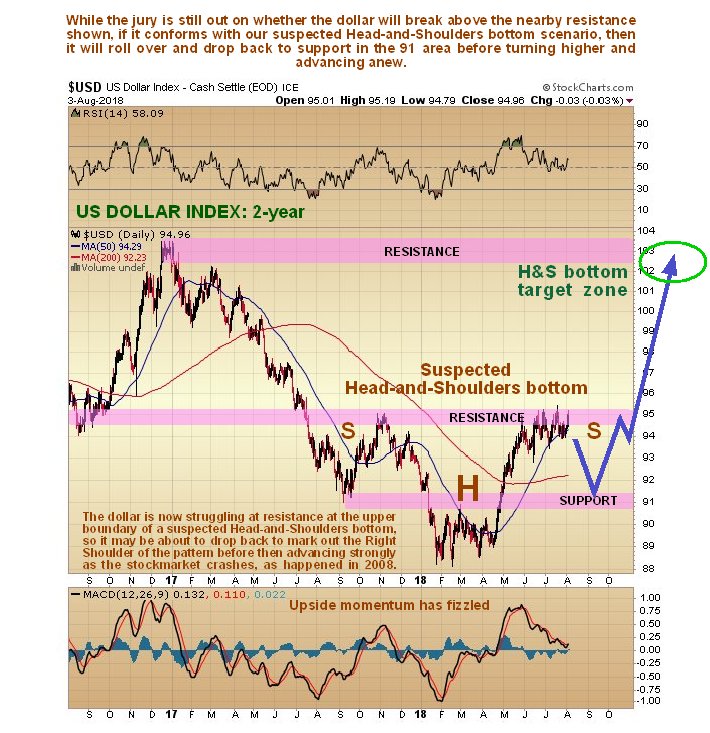
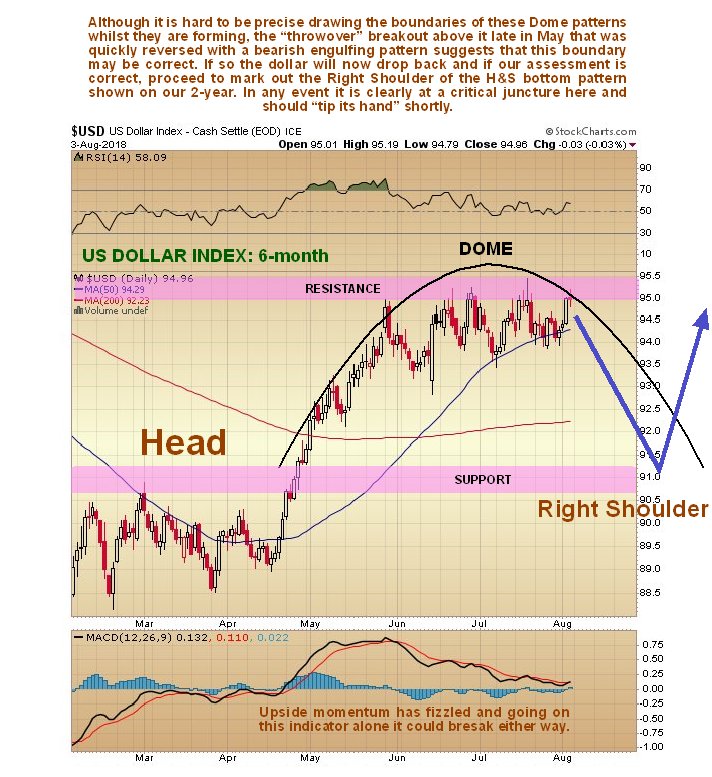
The storm clouds are already gathering with the news that the property market is starting to stall out ahead of an implosion that will spread across many asset classes. If this comes to the fore immediately then the dollar will continue to advance due to a “dash to cash” without bothering to drop back first. The dollar is thus at a critical juncture and the delicacy of the situation quickly becomes apparent when we look at the latest 6-month chart for the dollar index. On this chart we see that, in addition to stalling out at the aforementioned resistance, the dollar index is rounding over beneath a Distribution Dome, which, unless it negated by a break above it and the resistance level, will soon force it lower to drop back and mark out the Right Shoulder of our suspected Head-and-Shoulders bottom before it then turns higher again to complete the pattern as the broad-based market crash looms.
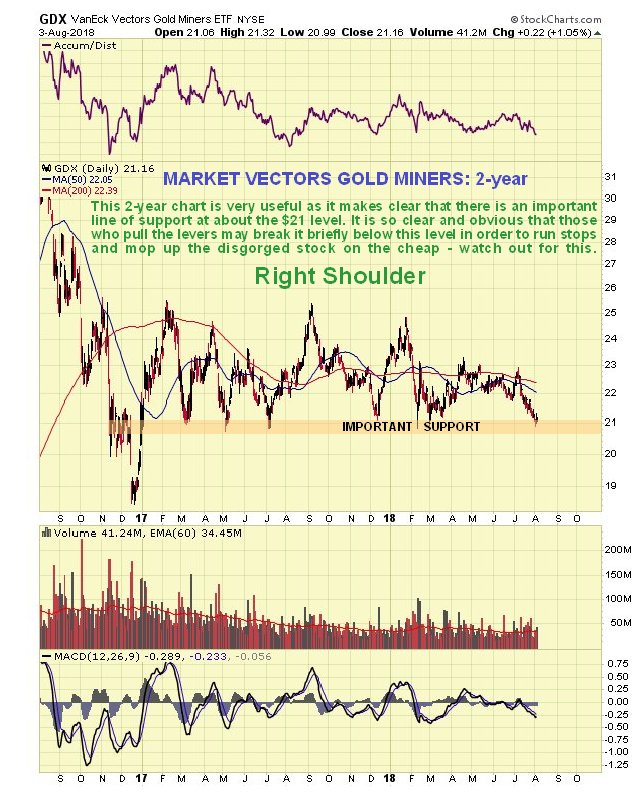
Whilst gold has dropped back significantly over the past several months, gold stocks, generally speaking, have not dropped back much at all, as we can see on the latest 2-year chart for GDX, and have in fact outperformed gold noticeably. This has bullish implications for the sector, as gold stocks tend to lead gold. The reason that we are looking at a 2-year chart for GDX is that it reveals the importance of the clear line of support at about $21, which turned the price up on no less than 5 occasions since early 2017. There is thus a high probability that the sector will turn up again here, and one tactic is to engage in across the board buying of the better stocks across the sector, employing a general stop below this line of support on GDX, but if you do this there is one thing you should watch out for. If we can see the importance of this line of support, then Big Money can too, and they may try to force GDX below this support briefly to run people out of their positions. Be aware of this and either be more generous in your placing of a general stop, or be ready to jump back in if the stop is triggered and then the sector suddenly turns higher again and hops back above the support.
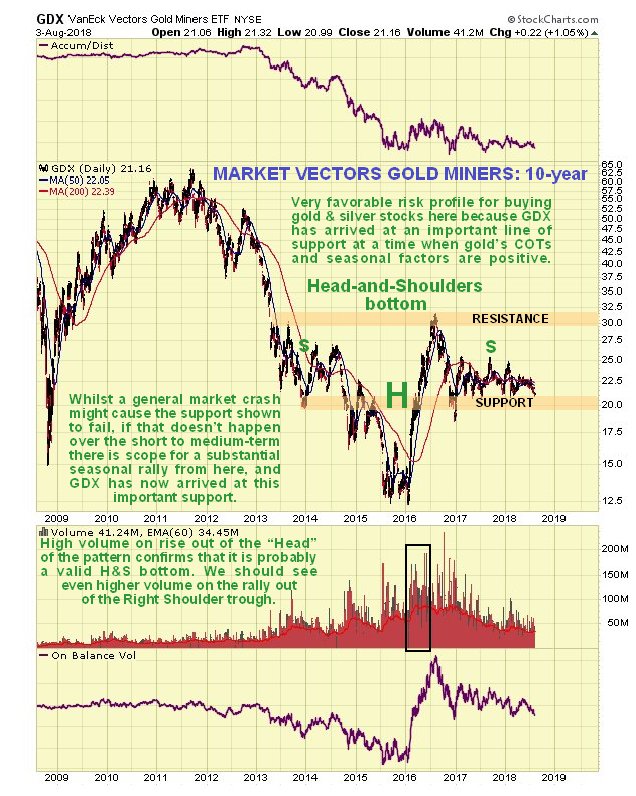
The 10-year chart for GDX continues to show it seemingly working on completing the Right Shoulder of a giant Head-and-Shoulders bottom. If this is what it is then we are clearly at a very good entry point for many stocks now.
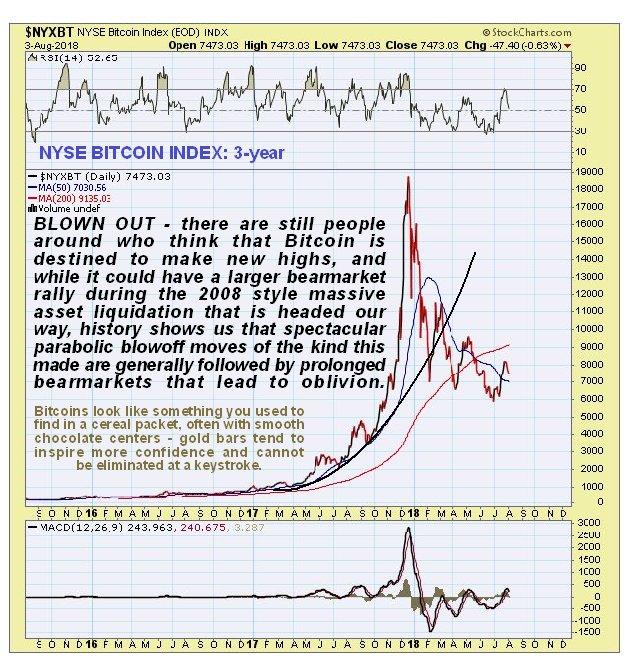
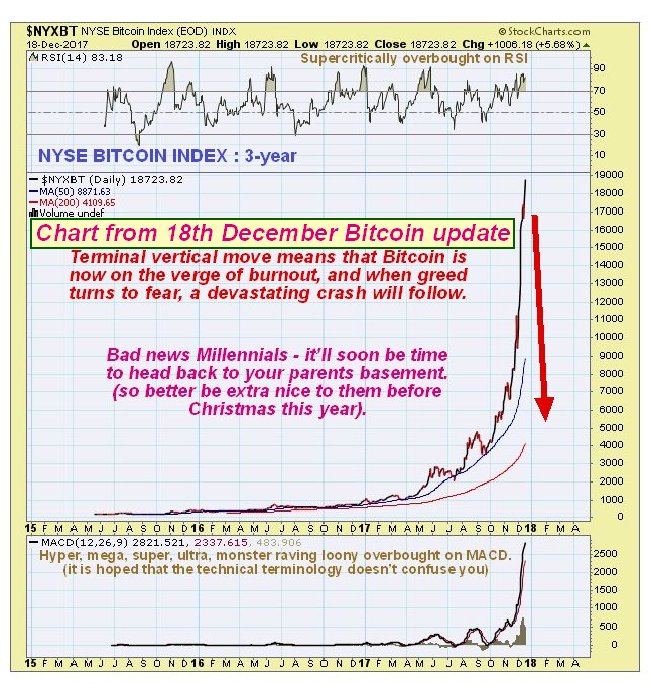
What about Bitcoin? – there has been a lot of chatter recently about it making a comeback and even advancing to new highs. You may recall that we called the top in Bitcoin within a day back in December. History is replete with examples of speculative counters like the Tulip Mania of the 16th Century or the South Sea Bubble that made parabolic blowoff moves like we have just seen in Bitcoin, and were then consigned to the trash can of history – and Bitcoin was the biggest bubble in history, even eclipsing these examples. This looks set to be the fate of Bitcoin too, especially as it is bedeviled by two problems that are having an increasingly adverse impact on it. One is that governments will simply not allow something of this nature to replace their Fiat, and will either outlaw it or tax it into the ground, or strangle it with regulations etc., the other is the proliferation of other cryptos that are all vying for a slice of the pie. So, while we might see a larger bearmarket rally in Bitcoin when the mass 2008 style asset liquidation hits, otherwise it should continue to head in the direction of obscurity and irrelevance.
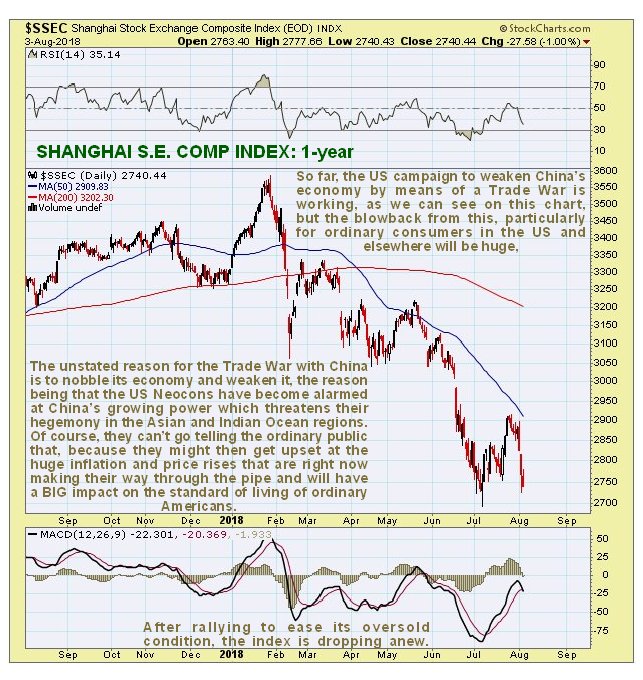
Finally it is worth making some comment on the Trade War between the US and China and its immediate impact on China, and eventual impact on the rest of the world and in particular the average US consumer. The tariffs imposed on Chinese imports are purported to be to redress “unfair trade practices”, but if you want to consider unfair trade practices try this – the United States is a country that has gotten away with swapping piles of intrinsically worthless paper in the form of dollars and Treasuries for goods and services from other lands for about 7 decades, thanks to the dollar being the global reserve currency, and bought off the Saudis in the 70’s to create the Petrodollar to continue this system. The Chinese at least work to create the stuff they sell. No – the underlying and unstated reason for the tariffs is that the US Neocons have become alarmed at the rapid rise of China as the dominant economy in the region and its consequent growing geopolitical power and the resulting threat to their hegemony. So they have decided to try to “nobble” the Chinese economy with tariffs. For now their plan appears to be working as both the Chinese currency and Chinese stockmarket are tanking, and we can see the severe drop in the Shanghai Composite index on its 1-year chart below…
The problem is that, as any student of history knows, Trade Wars create a lose – lose situation for the world economy at large, and amongst the biggest losers will be US consumers who are now accustomed to buying stuff for peanuts that is made in some distant place over the horizon. The way things are going they won’t be able to buy this stuff on the cheap for much longer. There is a tsunami of inflation heading for US shores, which doesn’t bother the Neocons of course because most of them are millionaires or billionaires, but it is going to make a big difference to the standard of living of the average US citizen which Apple becoming a trillion dollar company will not allay – get ready to tighten your belts.

Last month in Venezuela’s capital city of Caracas, a cup of coffee would have set you back 2 million bolivars. That’s up from only 2,300 bolivars 12 months ago, meaning the price of a cup of joe has jumped nearly 87,000 percent, according to Bloomberg’s Café Con Leche Index. And you thought Starbucks was expensive.
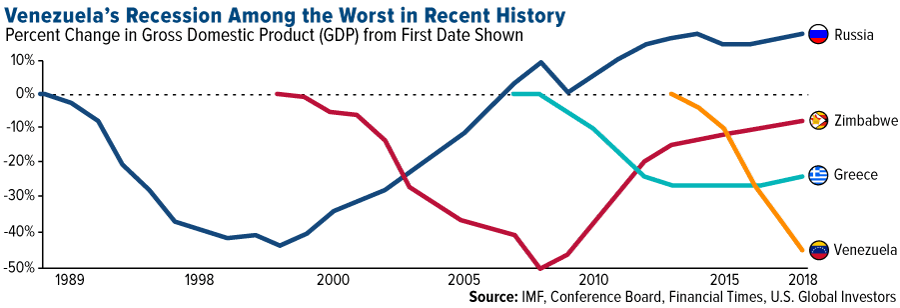
But that was July. Prices in Venezuela are doubling roughly every 18 days. The International Monetary Fund (IMF) now projects inflation to hit an astronomical 1 million percent by the end of this year. This puts the beleaguered Latin American country on the same slippery path as Zimbabwe a decade ago and Germany in the 1920s, when a wheelbarrow full of marks was barely enough to get you a loaf of bread.
Venezuela’s socialist president Nicolas Maduro—who only this past weekend survived an assassination attempt involving several explosive-laden drones—announced recently that the country plans to rein in hyperinflation by lopping off five zeroes from its currency. If you recall, Zimbabwe similarly tried to combat soaring prices of its own by issuing a cartoonish $100 trillion banknote—which in 2009 was still not enough to buy a bus ticket in the capital of Harare.
Without structural governmental reforms, a new bolivar is just as unlikely to steady Venezuela’s skyrocketing inflation or remedy its crumbling economy.
Gold Could Save Your Life
So where does this put gold? At some point, hyperinflation gets so ludicrously out of control that discussing exchange rates becomes pointless. But as of July 30, an ounce of the yellow metal would have gone for 211 million bolivars—an increase of more than 3.1 million percent from just the beginning of the year.
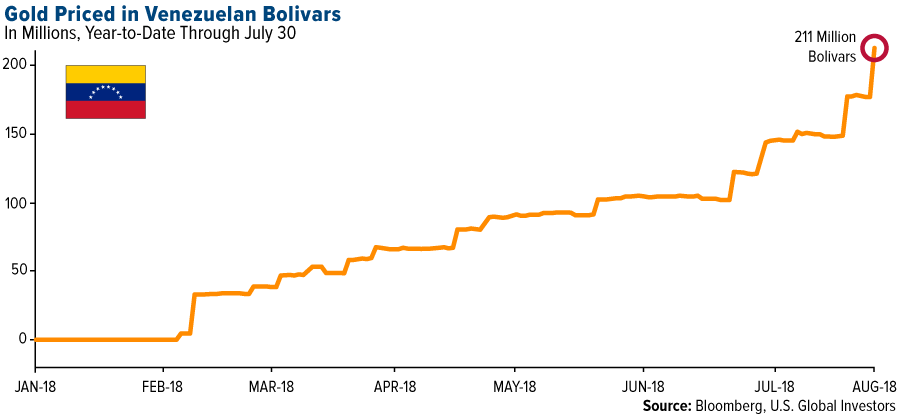
My point in bringing this up is to reinforce the importance of gold’s Fear Trade, which says that demand for the yellow metal rises when inflation threatens to destroy a nation’s currency—as it’s doing right now in Venezuela.
A Venezuelan family that had the prudence to store some of its wealth in gold would be in a much better position today to survive or escape President Maduro’s corrupt, far-left regime.
In extreme cases like this, gold could literally help save lives.
Such was the case following the fall of Saigon in 1975. If not for gold, many South Vietnamese families might not have managed to escape the country. A seat on one of the thousands of fleeing boats reportedly went for eight or 10 taels of gold per adult, four or five taels per child. (A tael is slightly more than an ounce.) Gold was their passport. Thanks to the precious metal, tens of thousands of Vietnamese “boat people,” as they’re now known, were able to start new lives in the U.S., Canada, Australia and other developed countries.
Venezuela’s Once Prosperous Economy Destroyed by Corruption and Mismanagement
But back to Venezuela. Amid the corruption and mismanagement, the only thing helping the country pay its bills right now is gold. Two years ago, it had the world’s 16th largest gold reserves. Today it stands at number 26 as it’s sold off more than half its holdings since 2010. While countries such as China and Russia continue to add to their holdings, Venezuela has been the world’s largest seller of gold for the past two years.
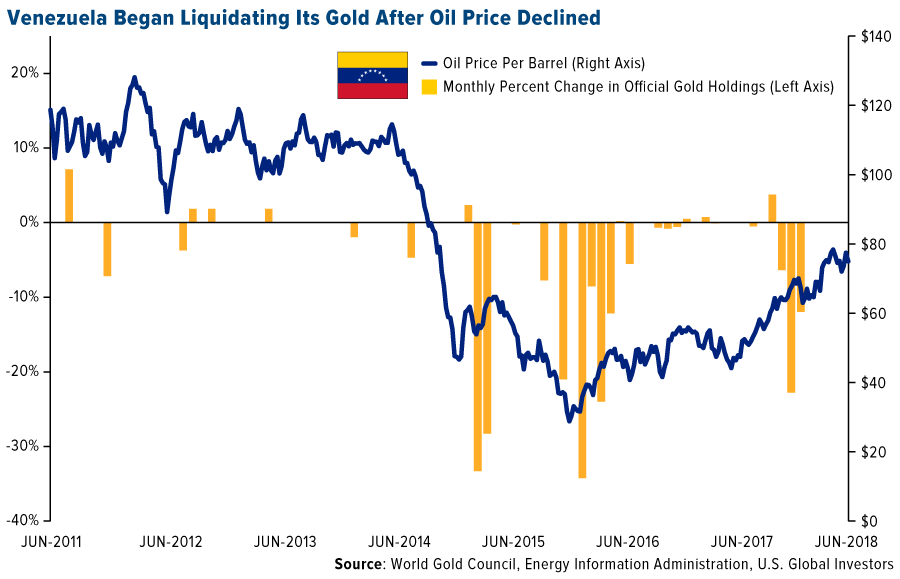
It’s hard to remember now, but as recently as 2001, Venezuela was the most prosperous country in all of South America. Like Zimbabwe, the OPEC nation is rich in natural resources, home to the world’s largest oil reserves and what’s believed to be the fourth largest gold mine. Oil exports account for virtually all of its export revenue.
In 2016, Venezuela was the third largest exporter of crude to the U.S. following Canada and Saudi Arabia, but with output in freefall, this is changing rapidly. For the first time ever in February, Colombia sold more crude oil to the U.S. than its eastern neighbor did. And in June, Venezuela’s state-owned oil and gas company, Petróleos de Venezuela (PDVSA), informed at least eight foreign clients that it would be unable to meet supply commitments. According to GlobalData, production is on track to fall to only 1 million barrels per day by 2019, down from 3 million a day in 2011, meaning the petrostate might soon have nothing left to deliver.
President Maduro now has the ignoble distinction of reigning over an economic recession that rivals the very worst in modern history. Last month, the IMF forecast that the country’s real gross domestic product (GDP) would fall 18 percent this year—the third straight year of double-digit declines.
A mass exodus of young, working-age Venezuelans, many of them college-educated, is unlikely to help. Estimates of the number of people who have fled the country in the past two years alone range from 1.7 million to as high as 4 million.
Their escape is no easy task, as numerous international airlines, citing rampant crime and a lack of electricity, have canceled all flights in and out of Caracas. The only U.S. carrier still operating in the country is American Airlines, which offers a single daily flight from the nation’s capital to Miami. Just two years ago, there were as many as 40 nonstop American flights, not to mention those of rival carriers, between the two cities—a sign of just how dramatic and swift Maduro’s mismanagement has been in crippling Venezuela’s once-robust economy.
The Diversification Benefits of Gold
The gold bears were on top last week, with the metal trading as low as $1,205 on Thursday. That’s the closest it’s come to dipping below $1,200 since February 2017. Friday’s lower-than-expected jobs report gave gold a modest boost, but it wasn’t enough to prevent a fourth straight week of price declines.
 |
| click to enlarge |
In times like this, it’s important to remember that, according to gold’s DNA of volatility, it’s a non-event for the metal to close up or down 1 percent at the end of each session, 2 percent for the 10-day trading period. And guess what? The S&P 500 Index has the same level of volatility.
Ten days ago, gold was trading just under $1,230 an ounce, or 0.6 percent more than today. The math is sound.
It’s also worth remembering that gold has traditionally had a low to negative correlation with other assets such as equities. This is why many investors over the years have used it as a portfolio diversifier.
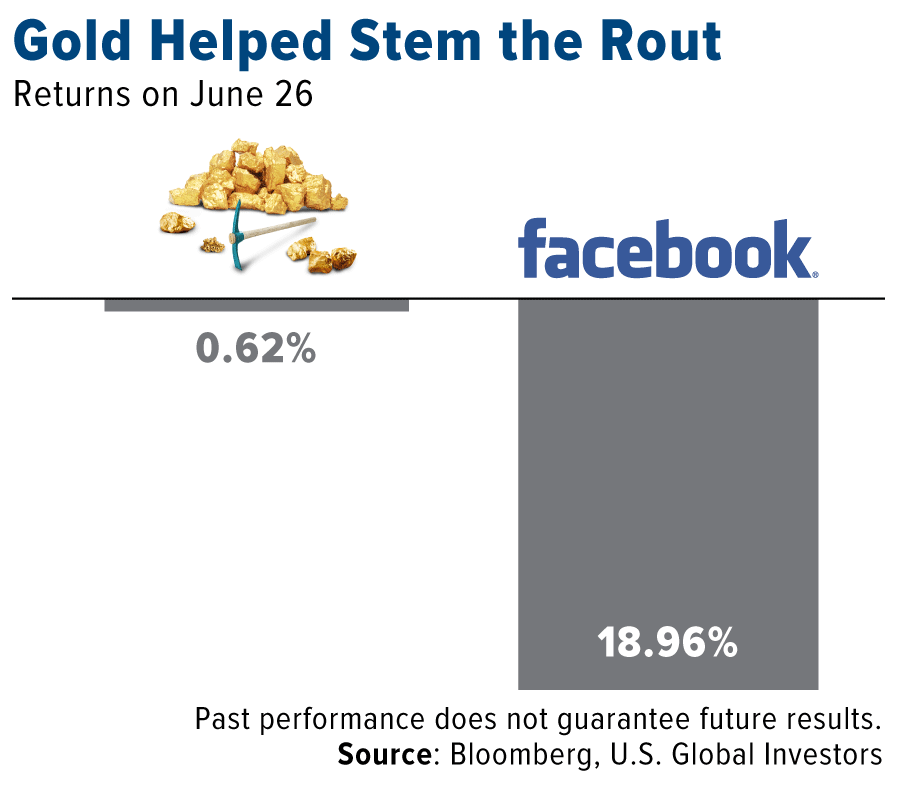
Case in point: On June 26, Facebook suffered its worst single-day decline since the company went public in 2012. Its stock plunged 19 percent, erasing some $120 billion in market capitalization—the most ever in history for a single trading session.
Gold, meanwhile, held relatively steady, slipping only 0.62 percent.
Curious about learning more? Explore the two main drivers of gold, the Fear Trade and Love Trade, by clicking here!


Why not make some money this summer? Mark wants this to be your most profitable month of the year! ~Ed

-
I know Mike is a very solid investor and respect his opinions very much. So if he says pay attention to this or that - I will.
~ Dale G.
-
I've started managing my own investments so view Michael's site as a one-stop shop from which to get information and perspectives.
~ Dave E.
-
Michael offers easy reading, honest, common sense information that anyone can use in a practical manner.
~ der_al.
-
A sane voice in a scrambled investment world.
~ Ed R.
Inside Edge Pro Contributors

Greg Weldon

Josef Schachter

Tyler Bollhorn

Ryan Irvine

Paul Beattie

Martin Straith

Patrick Ceresna

Mark Leibovit

James Thorne

Victor Adair