
Economic Outlook

Apple Inc. shares were up more than 5 percent after the company released a much better-than-feared fiscal third-quarter earnings report. The stock was trading around $200 per share in mid-day trading Wednesday…. CLICK for complete article

Last week, I wrote an article about how I view the potential effects of an economic collapse on American society. Unfortunately, many of our readers took it as an opportunity to post their perspectives on Trump and the democrats.
Yes, I know the country is exceptionally divided. However, I brought this issue to light not because I see one party as being the savior for this country over the other. Rather, I brought this issue to light to show you that we are on a path of history repeating itself, as we have forgotten the lessons learned from the pain of the past.
We all have to recognize that the United States took a big step down that slippery slope of socialism with the passage of The New Deal. Since then, it does not matter which party has been in power, as we have extended those socialistic policies when the masses thought it was “needed.” Thus, each generation since The New Deal has seen expanding socialistic policies. While you can argue whether you approve or disapprove of this progression, to ignore that we are on this path is foolish.
Moreover, the reaction to the financial market shock experienced during the Great Recession has shown us that our government is willing to go further down the path of socialistic policies. So, I really do not have much doubt in my mind that this will be the go-to answer when we get into bigger trouble in the 2030’s no matter who is in power.
But, I digress. The main point of this update is a follow up on my last article to explain the potential that the market still has overhead before we top out in the coming years.
Click HERE For Full Size Image
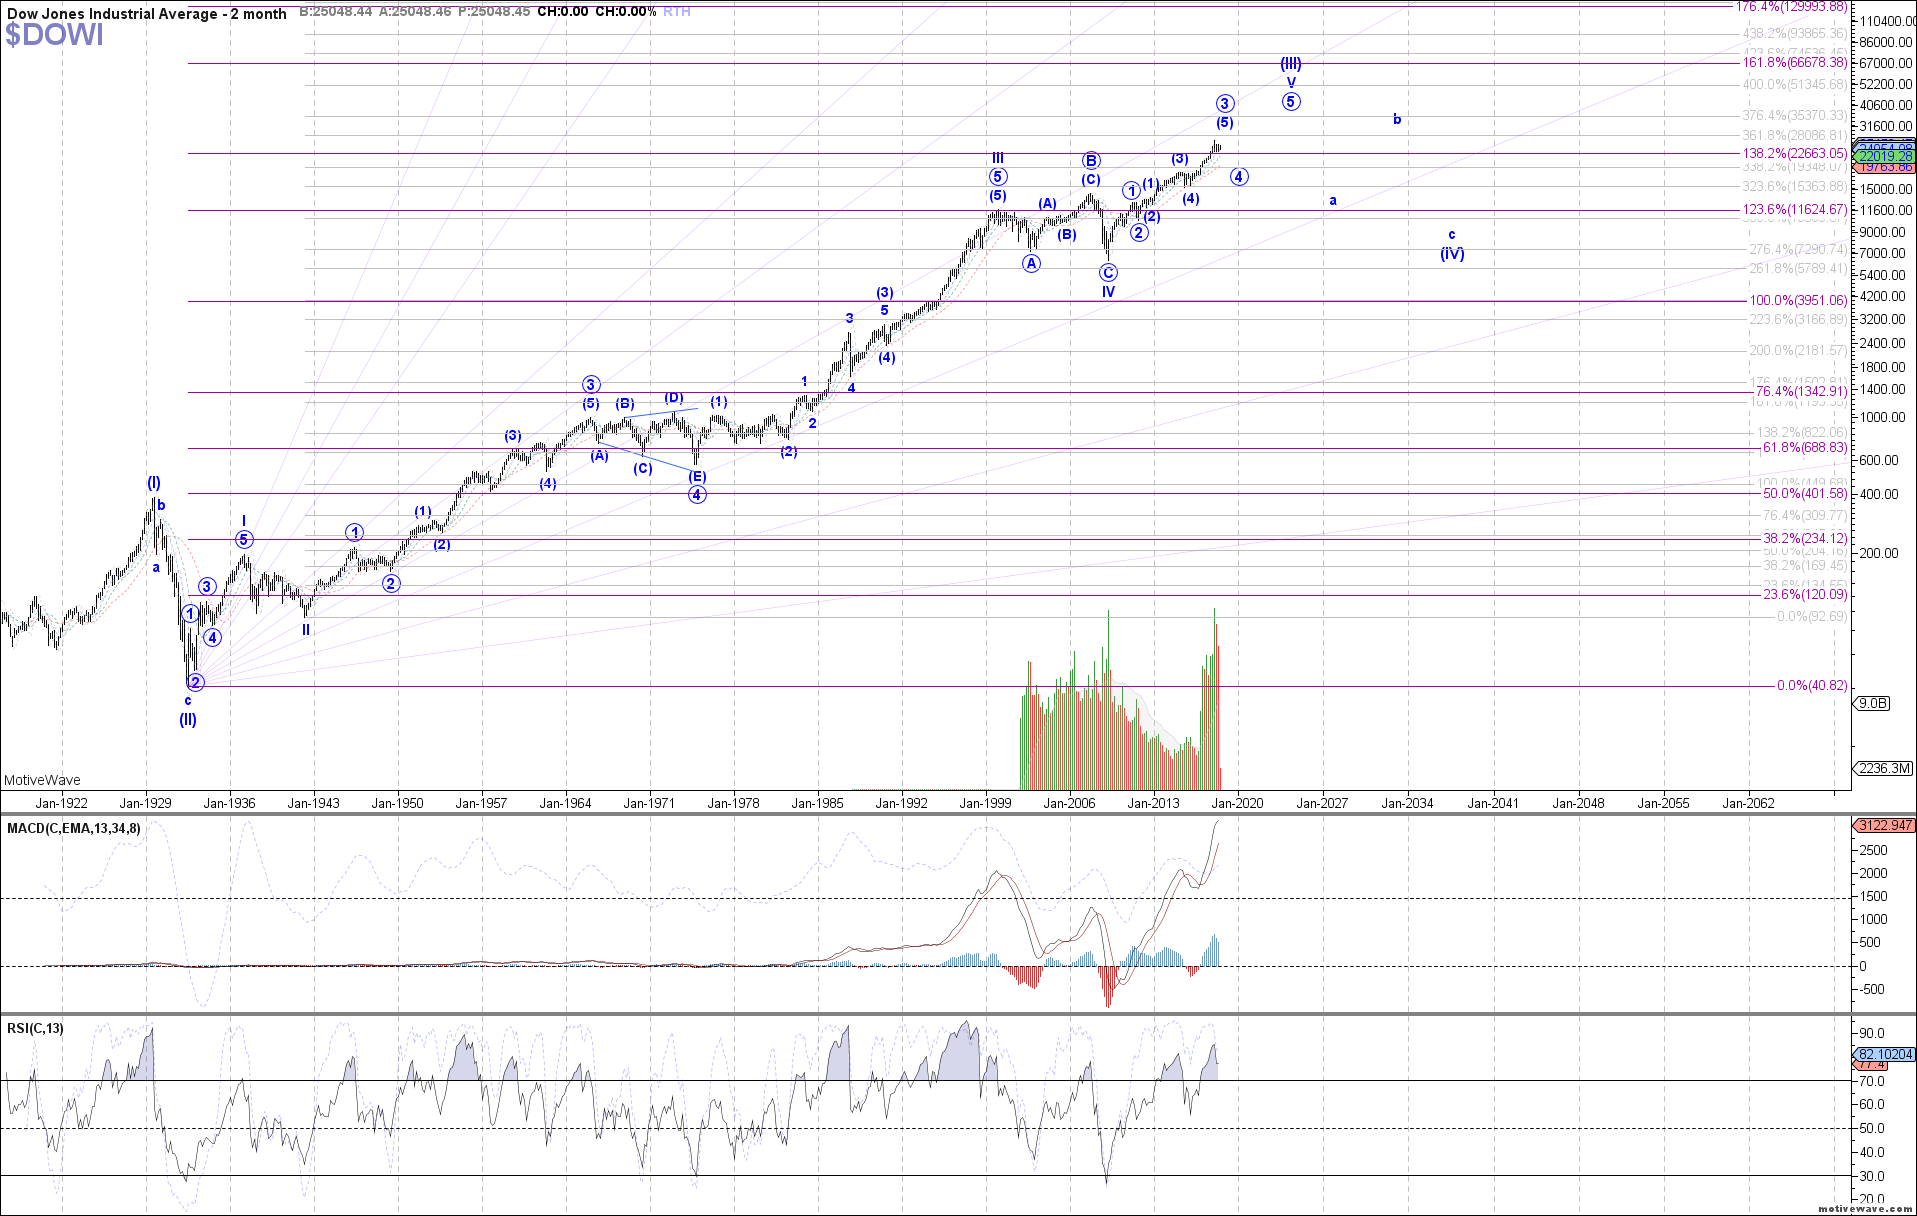
As you have seen from our very long-term perspective in this chart, which covers over 100 years of time, we still think there is upside left in this market in the coming years. However, before we are going to set up for that final run in the early 2020’s, I still think we will see a 20-30% correction begin in 2019.
But, once that 20-30% correction completes, our expectation is that the DOW can reach at least 35,000 on the rally into the mid-2020’s, with a potential blow off top taking us as high as the 66,000 region. In fact, the 66,000 region is the ideal target on the larger degree structure.
While that is quite a large range, much will depend on how that rally takes shape after we complete the expected 20-30% correction. So, it is a bit premature to be able to hone in on the exact target region upon which to focus. But, as noted, our minimal expectation at this time is the 35,000 region, whereas the ideal target has been 66,000.
So, as you can see, based upon our analysis which has kept us on the correct side of this market for many years, we still believe that this bull market has further to run. However, we are expecting a sizeable correction to begin in 2019 before that last leg of this bull market which began at the 2009 lows takes hold. And, after this last leg into the mid-2020’s completes, then we will likely begin a 10-20 year bear market which can take the DOW back towards the 10,000 region.
See expandable chart on the Dow.
Avi Gilburt is a widely followed Elliott Wave technical analyst and founder of ElliottWaveTrader.net (www.elliottwavetrader.net), a live Trading Room featuring his intraday market analysis (including emini S&P 500, metals, oil, USD & VXX), interactive member-analyst forum, and detailed library of Elliott Wave education.

Consumer price inflation is real. It sneaks into every facet of life. Bags of coffee shrink from 16 ounces to 12 ounces and then to 10 ounces. “Shrinkflation” is policy. That Snickers candy bar is smaller but costs the same or more.
But don’t blame the candy industry, coffee distributors or automobile manufacturers. Fiat currencies create the problems.
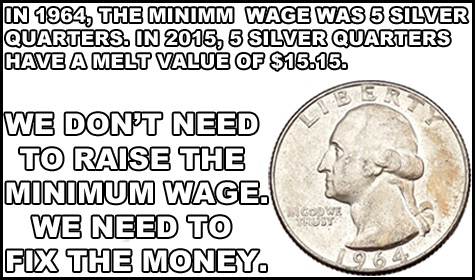
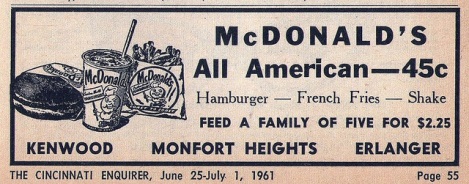
Why do we need to fix our currency? Because commercial banks (via fractional reserve banking) and the Federal Reserve print dollars by the trillions, devalue all existing dollars, and increase prices on almost everything. Do you remember McDonald’s prices in 1961?

The problem is the currency unit. It shrinks in value!
How well would the military perform if the government changed the units of measurement every year? Example: The diameter of the rocket fuel tank is 47 inches. The next year the diameter measures 49 inches, but the rocket didn’t change! Chaos, craziness, and a dysfunctional military would result.
Reducing the value of currency units is like changing the measuring units for length. The chaos becomes unmanageable.
Most unbacked paper currencies have failed. Others, such as the pound and dollar, are worth a tiny fraction of their initial value. However we delude ourselves and believe flawed currencies will survive and prosper.
When insanity and delusions persist, there are reasons. One might think the powers-that-be prefer a flawed system that enriches them at the expense of the savers, pension plans, taxpayers and future workers…
Whatever the reason, the process continues. Devalue the dollar, increase prices, pretend and extend, and work the scam.
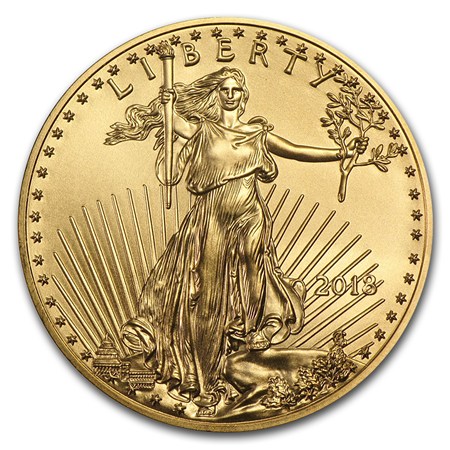
Rather than curse the darkness, light a candle within your financial world! Buy silver and gold.
The following is a quick history lesson on prices, devaluing dollars, and preserving purchasing power with gold.
In 1913 gold sold for $20.67, potatoes cost 1.6 cents per pound, a pack of cigarettes cost ten cents, and an average house sold for about $3,000.
Prices are higher today! I used $0.60 per pound for potatoes, $6.00 for cigarettes, and $392,000 for an average house (source: St. Louis Federal Reserve.) Consider the following.


Other Examples of “Excessive Printing” – Argentina and Venezuela:
During the past 70 years Argentina devalued their peso by lopping off 13 zeros. That is ten trillion-to-one devaluation against the dollar which also devalued. One year ago Argentina sold 100 year bonds to yield hungry “investors” who should have studied history. Read this. Interest rates have risen to about 40% per year and the peso is devaluing.
Inflation is out-of-control and hurting everyone in Venezuela. Those who placed their savings in gold bullion are better protected. A recent article tells about a cardiologist who received severance pay after working five years. It purchased a cup of coffee!
CONCLUSIONS:
- Prices rise as currencies devalue, sometimes rapidly.
- Huge devaluations have occurred in many other countries but not recently in the U.S.
- Printing the global reserve currency creates advantages. One advantage is that the U.S. can import real goods and pay for them with “printed” debt—Treasury notes. Exchanging real goods for “IOUs” can work for a long time, but not forever.
- Imagine the impact upon the U.S. economy if it could not exchange paper debt for real goods. Other countries strive to eliminate these exchanges. Treasury Notes are accepted for imports, but for how many more years?
- Prices in the U.S. will rise when there is less demand for the dollar in global trade. (Think crude oil!)
- Politics and military posturing may delay the loss of reserve currency status, but not indefinitely.
TAKE ACTION:
- Financial changes are inevitable. Most of those changes devalue dollars. (Name one politician who wants a return to stable prices, a strong dollar, and a balanced budget…)
- Silver and gold preserve purchasing power. See the above graphics regarding trucks and houses priced in gold ounces.
- Buy silver and gold to protect your assets, retirement and purchasing power.
- Call Miles Franklin or WhyNotGold to exchange digital debt based currency units for real money – silver and gold.


When you think of the top 1 percent of all income earners in American households, how much do you think this group rakes in? Millions? Tens of millions? What about the top 10 percent?
On the contrary, to be considered in the top 1 percent of taxpayers US nationally, you’d need an annual income of $480,930. The top 10 percent of taxpayers make at least $138,031. These figures are based on 2015 income tax data, the most recent year available.
This income level varies widely by both state and city. In San Jose, California, the top 1 percent income threshold is close to $1.2 million, almost double the level for Los Angeles. As seen in the chart below, the spread is fairly wide between the top 10 most populous cities in the U.S. In San Antonio, Texas – home to U.S. Global Investors – you’d need to make $416,614 annually to be considered in the top 1 percent, slightly below the national threshold of top 1 percenters.

Earning enough income to be in the top 1, 10 or even 20 percent is no small accomplishment, but chances are good that many people you know, and may not think of as wealthy, fall into the top 1, 10 or 20 percent.
Is the Top 1 Percent Paying Their Fair Share?
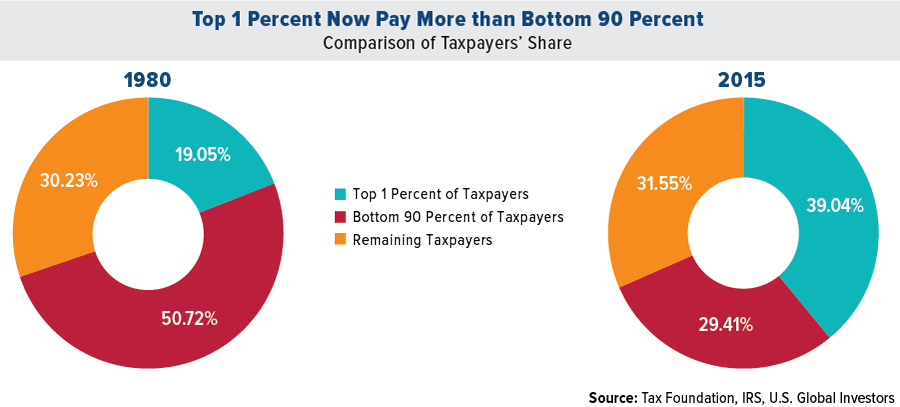
Contrast the above income statistics with the picture often painted in the media that the wealthiest Americans aren’t paying their fair share. According to the Tax Foundation, the top 1 percent of households collectively pay more in taxes than all of the tax-paying households in the bottom 90 percent.
Take a look at how much this has changed over the past few decades. In 1980, the bottom 90 percent of taxpayers paid about half of the taxes. The top 1 percent contributed about 20 percent.
Now, the top 1 percent pays more than the bottom 90 percent. Perhaps this is more than their fair share?
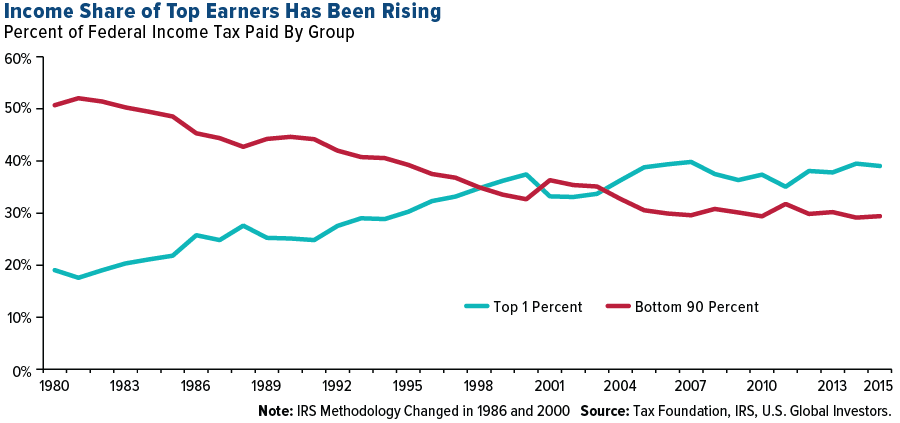
Below is the line chart from the Tax Foundation showing how the income tax share for each category has changed since 1980. For the majority of years, the share of the bottom 90 percent fell while the share of the top 1 percent rose.
Individual Tax Rate Cuts Take Effect in 2018
Taxpayers in the highest bracket should see a noticeable change when filing for the 2018 tax year since the top rate fell from 39.6 percent to 37 percent. President Donald Trump’s administration passed the Tax Cuts and Jobs Act in late 2017, which included small reductions to income tax rates for most individual brackets plus changes to exemptions, deductions and more. The average top 1 percent taxpayer will get a tax break of over $50,000 in 2019, according to estimates.
The new tax bill, however, eliminates the ability of taxpayers to deduct more than $10,000 in state and local taxes from their federal tax returns. This could significantly increase the tax burden of top earners who itemize their deductions in high-income tax states such as California and New York. One possible solution for these investors could be to take advantage of municipal bonds, which are often exempt from local, state and federal taxes.
Maximize Tax-Advantaged Investment Vehicles
Although it can be discouraging to see how top earners pay the majority of income taxes, there are still tax advantages for hard-working Americans who make saving and investing a priority in their lives.
How can you help make sure less of your money is going to the government and more of it is working for you in your investments? One way is to maximize your contributions to tax-advantaged investment vehicles such as an individual retirement plan, a 401(k), individual retirement account (IRA) or simplified employee pension (SEP) for the self-employed, all of which offer tremendous tax benefits.
To make it easier to have the discipline to set money aside, try an automatic plan that invests a fixed amount at regular intervals, such as the U.S. Global Investors’ ABC Investment Plan.
Wealth Isn’t Just a Number
No matter how much you earn, wealth is determined by how much you keep. My friend, Alexander Green, chief investment strategist of the Oxford Club, is a great source of inspiration for me and for many investors with his uplifting, holistic articles that relate to both health and wealth. Alex says wealth isn’t necessarily determined by an income figure. Instead, real wealth is determined by looking at your balance sheet. Here’s his formula:
“Maximize your income (by upgrading your education or job skills). Minimize your outgo (by living beneath your means). Religiously save the difference. (Easier said than done.) And follow proven investment principles.”
What matters most is being grateful for what you have. I’m a big believer that wealth is not a number or an amount, it’s an attitude and the umbilical cord to attitude is gratitude.
Take a look at my 10 favorite wealth and prosperity affirmations in this slideshow!
 Jeffrey Saut, chief investment strategist at Raymond James, a widely followed strategist and an unwavering market bull, made two very critical observations Tuesday that are likely to reverberate for stocks going forward.
One, the stock market just made a positive move that has not happened since 1958, the same year that NASA was born and President Dwight Eisenhower, a Republican, was in the White House. Two, Democrats are likely to fail in their effort to retake the Senate and may even fall short in the House this fall.
After a fairly rocky month, stocks closed out July with solid gains, extending the S&P 500’s SPX, +0.28% winning streak to four months. Historically, when the market gains in April, May, June and July of midterm election years, the market has finished higher in that year, according to Saut.
“The history of midterm election years is that stocks become dicey in August, but tend to rally as we approach the midterm elections,” said Saut, in a note. “Also worth a mention is that going back decades shows that when the stock market is up in April, May, June and July in midterm election years, in the two years that has happened (1954 and 1958), after an August Angst moment, stocks have finished the year stronger.”
The S&P 500 was up 0.3% in April, 2.2% in May, 0.5% in June and 3.6% in July. The large-cap index jumped 45% in 1954 and rallied 38% in 1958. So far this year, the benchmark has risen 5.3%.
Even without the added boost from politics, stocks almost always gain in years when the market finished higher between April and July, according to Paul Hickey, an analyst at Bespoke Investment Group.
But perhaps the most interesting nugget in Saut’s report is that he doesn’t expect the Democrats to retake the Senate, and even their ability to recapture the House is uncertain.
“Our contacts in D.C. say the House is up for grabs, despite hoots that the Dems will sweep the House,” he said.
Aside from politics, Saut, ever the optimist, stressed that the fact that the broader market didn’t collapse in the wake of Facebook Inc.’s FB, +0.98%meltdown is an indication that funds exiting mega-tech stocks such as Amazon.com Inc. AMZN, +0.89%Netflix Inc. NFLX, +1.54%and Alphabet Inc.’s Google GOOGL, +0.99%GOOG, +0.67% are being rotated into other sectors.
Facebook has slumped 21% after the social media giant last week issued a weak outlook, followed by Twitter Inc. TWTR, +0.60% which also tanked 29% after it released quarterly earnings. The dramatic decline of the two high-profile stocks has raised questions about popular technology and internet-related bets that have helped to buttress the broader market in recent months.
Stocks on Wednesday rose, with the S&P 500 adding 0.2% and the tech-heavy Nasdaq COMP, +0.71% gaining 0.6%. Apple Inc. AAPL, +4.96% on the heels of better-than-expected earnings, rallied more than 4% to lead the Dow Jones Industrial Average DJIA, +0.20% into the green.

-
I know Mike is a very solid investor and respect his opinions very much. So if he says pay attention to this or that - I will.
~ Dale G.
-
I've started managing my own investments so view Michael's site as a one-stop shop from which to get information and perspectives.
~ Dave E.
-
Michael offers easy reading, honest, common sense information that anyone can use in a practical manner.
~ der_al.
-
A sane voice in a scrambled investment world.
~ Ed R.
Inside Edge Pro Contributors

Greg Weldon

Josef Schachter

Tyler Bollhorn

Ryan Irvine

Paul Beattie

Martin Straith

Patrick Ceresna

Mark Leibovit

James Thorne

Victor Adair