Economic Outlook

And Then There Were None

raisedsteaks

By simply looking at the returns of the S&P 500 in the first half of 2018, one could be forgiven for thinking returns were decent and that markets were uneventful. by the close of the books in June, the S&P 500 managed a price gain of 1.7% or 2.6% including dividends.

However, what’s amazing about this is that much of the gains this year both in the S&P 500 and the Nasdaq are due to just three stocks…. CLICK for the complete article

Support Is Growing For Bitcoin ETF

boxcoin

As things stand, the bitcoin ETF is widely considered to be the biggest news story in the cryptocurrency industry this year. We have recently seen a decision on the Direxion Investments ETF’s announced for some time in September, while Bitwise Asset Management has become the latest venture to go down the route of lodging a cryptocurrency ETF application with the US Securities and Exchange Commission (SEC).

The application that has caught the attention of the cryptocurrency industry though is that which was unveiled in June from VanEck and SolidX. Both ventures have had previous applications shut down by the SEC, and decided this time to join forces and submit what is increasingly looking like a successful bitcoin ETF…. CLICK for the complete article

New York Evicts Internet Provider For High-Speed Failure

ny

The State of New York is moving to evict its largest internet and cable provider for failing to deliver on fast connection promises that had won it approval two years ago for a merger with Time Warner Cable.

The deal was that rural areas would get high-speed internet access as a result of the merger, but the company—Spectrum (of Charter Communications)—didn’t make it happen on time…. CLICK for the complete article

July 31, 2018 

1.  Under Trump, it can be argued that the US economy (which is separate from the Wall Street casino) is experiencing a degree of normalization.  

2.  Top economists give him credit for corporate tax cuts and deregulation.  At the same time, the US central bank is also pursuing a policy of normalization that began with Yellen.

3.  As I predicted, this normalization has seen the stock market begin a topping process while inflationary pressures become more evident.  This topping process will now accelerate, as will the inflationary pressures.

4.  Please click here now. Double-click to enlarge this disturbing weekly Nasdaq100 index chart.

5.  Note the ugly non-confirmation taking place between the RSI oscillator and the price.  For decades I’ve urged investors to hedge themselves or sell as the US stock market “crash season” begins at the start of August.  It lasts until the end of October, and I recommend rebuying then.  Please click here now.  As stock market heavyweight Mike Wilson notes in his interview yesterday, the US stock market selling has just begun! 

6.   While US stock markets are set to swoon and perhaps crash, the rise of China/India and the normalization of America is producing a new era for gold. The wild fear trade of the past is being superseded by a theme of general respect for the asset.

7.   Chinese and Indian gold investors do invest in the global fear trade for gold.  That’s a big part of why they buy, but their understanding of gold is highly refined.  Their analysis is wise and subtle. 

8.   The growing dominance of Chindians in the market is producing a much calmer investing experience for Western investors who are feeling this wonderful golden vibe! 

9.   Please click here now.  Next, please click here now. Out with the old (fear trade of the West), and in with the new (love trade demand of the East)! 

10.   To Vanguard’s credit, I will note that it is restructuring its fund to gain exposure to the general equity markets, but with a commodity-oriented theme.

11.  Official Indian imports would be over 1000 tons for fiscal 2018 if the rupee had not been temporarily derailed.  If free (black) market demand is included, the total imports are probably in the 1200 – 1300 tons area.  

12.   Please click here now. It’s a bird!  It’s a plane!  It’s the gold bull era’s superman!  Since being appointed as “interim” finance minister of India, Piyush Goyal is pumping out so many pro-citizen and pro-business tweets and announcements that he makes Donald Trump look like a turtle swimming through a pool of end of empire molasses, and Trump himself can be considered a pro-business racehorse!

13.   If Goyal continues to reduce the drag of government on citizens and businesses, my prediction that India will hit 10% GDP growth and 1500 tons of total annual gold demand in the next 18 months will likely become a “done deal”.

14.  To view what may be the world’s most important chart, please click here now. Double-click to enlarge.  Gold stocks have surged against gold and held their ground against US fiat while bullion has fallen about $170 an ounce!

15.  While earnings, AISC, and cash flow numbers have turned negative for many gold miners, most of them continue to look good against gold and are holding their recent lows against the dollar.  

16.  GDX would likely be trading around $10 a share right now if institutions were buying or selling just based on earnings and other financial reports about the component companies.

17.  Please click here now. Why is this strange price action happening?  Why is GDX trading above its February low even though gold has moved so much lower?

18.  Well, the most reasonable explanation is that savvy institutional power players are looking beyond the short term earning hits.  They are focusing on the rise in inflation in the West.  

19.  This interesting gold market action is occurring just as the horrific action of the main US stock market sectors begin to suggest that general equities are already in a rolling bear market and poised to begin something much more sinister.  

20.  The US stock market could soon become an inflation-oriented quagmire that would greatly resemble the markets of the 1970s.

21.  Please click here now. Double-click to enlarge this gold chart.  Gold is oversold, but the 14,3,3 Stochastics series is flatlining. 

22.  This tends to happen when investor sentiment becomes weak but physical demand in China and India has yet to strengthen.  It creates an incentive for smart commercial traders on the COMEX to cover short positions but not to buy many longs.

23.  Please click here now. Double-click to enlarge another great gold chart.  From both a fundamental and technical perspective, nothing is happening in the gold market that is unexpected.  

24.  If the current gold price sale ends in the $1200 – $1180 area it would give the right side of the huge inverse head and shoulders pattern almost perfect symmetry with the left side.  The personnel changes in India’s finance ministry and the rise of inflation in America (as the stock market peaks) are fundamentally in tune with the big picture technical action for gold.  A joyous bull era is poised to begin, with good times for all gold investors!

 Thanks

Cheers

St  

Stewart Thomson  

Graceland Updates 

Note: We are privacy oriented.  We accept cheques, credit card, and if needed, PayPal.

Written between 4am-7am.  5-6 issues per week.  Emailed at aprox 9am daily.

https://gracelandjuniors.com     

www.guswinger.com   

Email: 

stewart@gracelandupdates.com  

Stewart Thomson is a retired Merrill Lynch broker. Stewart writes the Graceland Updates daily between 4am-7am. They are sent out around 8am-9am. The newsletter is attractively priced and the format is a unique numbered point form.  Giving clarity of each point and saving valuable reading time.

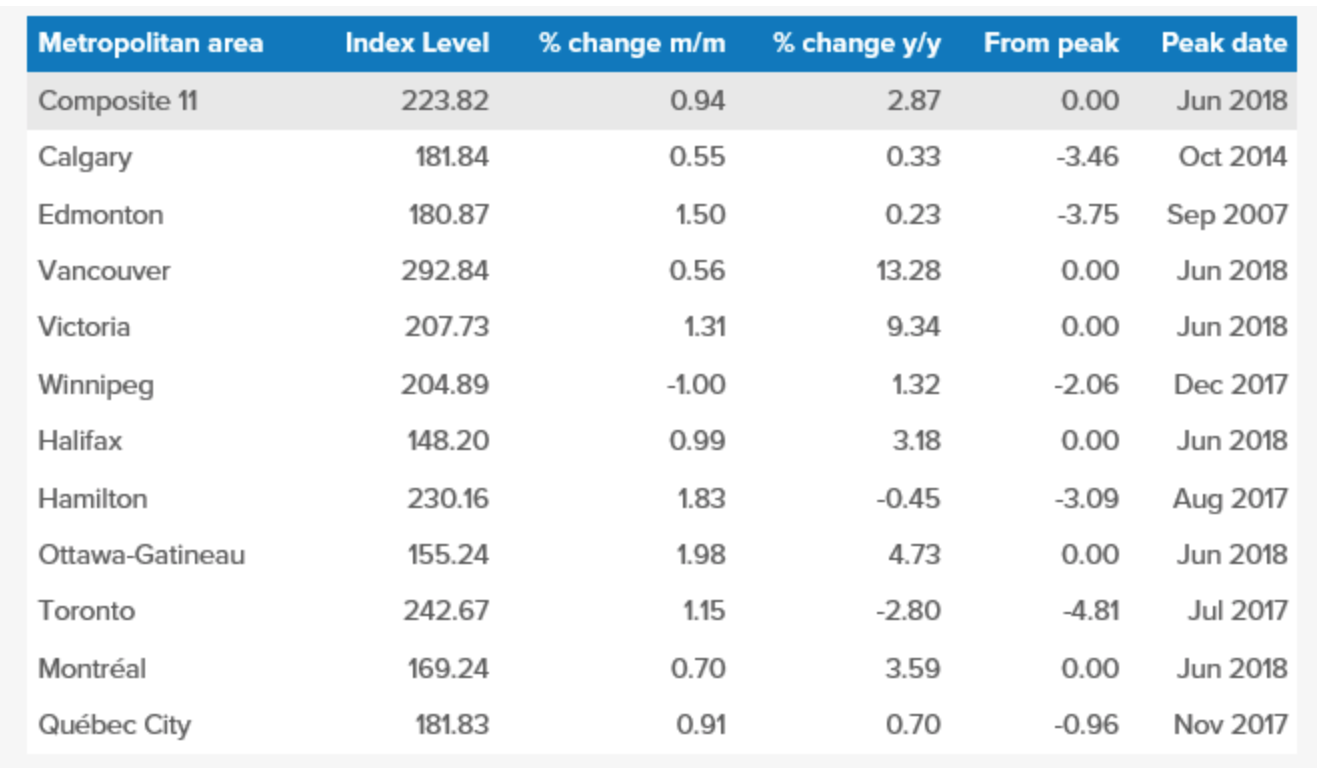
“Five of the 11 markets reached a new high in June: Vancouver, Victoria, Montreal, Halifax and Ottawa-Gatineau. The market furthest from its previous peak was Toronto, down 4.8% from its reading of last July…Over the first half of the year (2018) the Toronto index rose at an annual rate of 5.7%. For the condo segment, the rate was 12.1%, for other housing only 2.9%, reflecting a tight seller’s market for condos. The Vancouver story is similar: condo segment up 17.6% annualized since last September, other dwelling types up 4.9%.” (The Teranet–National Bank National House Price Index, July 12, 2018)

Housing prices Canada’s 11 metropolitan areas increased 0.9% in June, as 10 of the 11 urban centers recorded monthly increases, led by Ottawa-Gatineau (+2.0%) and Hamilton (+1.8%).

House prices in Toronto rose 1.2% in June, suggesting that some price stabilization was occurring in the country’s biggest city. The Toronto housing market (excluding condos) recently weakened after the provincial government adopted measures to rein in the market.  As well, tighter mortgage rules took effect at the start of 2018 which also hurt housing prices. The Toronto house price index is down 4.8% from its peak in July 2017.

On a year over year measurement basis, however, Canada’s housing prices have been clearly slowing, with the latest aggregate increase at just 2.9%, the lowest increase since October 2013.

As of June, the annual price winners were Vancouver (+13.3%), Victoria (+9.3%), Ottawa-Gatineau (+4.7%), Montreal (+3.6%) and Halifax (+3.2%), while housing prices in Toronto fell 2.8%. 

A snapshot of housing prices over the past five years also confirms that a slowing pattern that has emerged.

Over the past five years, average housing prices in Canada have increased about 46%, with the peak rate of increase occurring around mid-2017. Since then, as the second chart illustrates, the average rate of house price increase has decelerated sharply from about 14% per year to less than 3% recently.

In sum, Canada’s recently hot housing market has softened in the wake of four interest rate hikes by the Bank of Canada since July 2017 and the imposition of tighter mortgage rules, though the condo markets in both Toronto and Vancouver have remained quite robust.

Tighter mortgage rules have priced many buyers out of the more expensive single-family home purchases.

Screenshot 2018-07-31 08.03.41