
Stocks & Equities
Todd Market Forecast for 3pm Pacific Wednesday July 25, 2018.
Dow +172 on 690 net advances
NASDAQ COMP +91 on 381 net advances
SHORT TERM TREND Bullish
INTERMEDIATE TERM Bullish
STOCKS: Today the analysis is pretty easy. President Trump and EU Commission President, Jean -Claude Juncker made progress in trade talks. So much so that the overnight stock index futures are surging.
Even before the announcement the market was making progress. We had been worried about market breadth, but it straightened out somewhat today.
GOLD:Gold was up $ 7. Not ready to change our bearish posture.
CHART: The QQQ, which is the ETF for the NASDAQ 100 is at an all time high. This index tends to lead the Dow and S&P 500 so I would expect them to follow suit over the next few months.

BOTTOM LINE: (Trading)
Our intermediate term system is on a buy.
System 7 We are in cash. Stay there for now.
System 9 Neutral.
System 10 – Gold We are in cash. Stay there for now.
NEWS AND FUNDAMENTALS: New home sales were 631,000, higher than the expected 608,000. Oil was down 6.1 million barrels. Last week they rose 5.8 million. On Thursday we get nd oil inventories.
INTERESTING STUFF : Never interrupt your enemy when he is making a mistake. ——Napoleon Bonaparte
TORONTO EXCHANGE:Toronto gained 30.
BONDS: Bonds made anew reaction low.
THE REST: The dollar lost some ground. Crude oil was somewhat higher.
Bonds –Bearish as of July 20.
U.S. dollar – Bullish as of June 27.
Euro — Bearish as of June 27.
Gold —-Bearish as of June 15.
Silver—- Bearish as of June 15.
Crude oil —-Bearish as of July 5.
Toronto Stock Exchange—-Bullish as of Feb. 12.
We are on a long term buy signal for the markets of the U.S., Canada, Britain, Germany and France.

Monetary conditions (+2 means the Fed is actively dropping rates; +1 means a bias toward easing. 0 means neutral, -1 means a bias toward tightening, -2 means actively raising rates). RSI (30 or below is oversold, 80 or above is overbought). McClellan Oscillator ( minus 100 is oversold. Plus 100 is overbought). Composite Gauge (5 or below is negative, 13 or above is positive). Composite Gauge five day m.a. (8.0 or below is overbought. 12.0 or above is oversold). CBOE Put Call Ratio ( .80 or below is a negative. 1.00 or above is a positive). Volatility Index, VIX (low teens bearish, high twenties bullish), VIX % single day change. + 5 or greater bullish. -5 or less, bearish. VIX % change 5 day m.a. +3.0 or above bullish, -3.0 or below, bearish. Advances minus declines three day m.a.( +500 is bearish. – 500 is bullish). Supply Demand 5 day m.a. (.45 or below is a positive. .80 or above is a negative). Trading Index (TRIN) 1.40 or above bullish. No level for bearish.
No guarantees are made. Traders can and do lose money. The publisher may take positions in recommended securities.

Commodities, including gold and silver, have plunged to become so deeply oversold that a snapback rally looks likely soon, that could be sharp as if they turn up here it will trigger a wave of short covering. Such a rally is likely to be sparked by a dollar reaction, as we will see, but it is likely to be followed by further heavy losses across the sector if a general market crash ensues as expected.
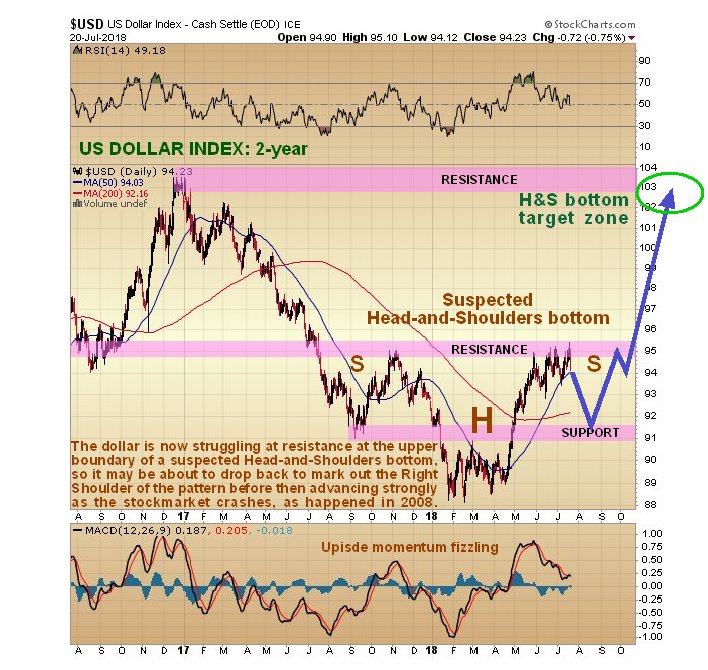
We will start by looking at the latest dollar index chart, as a dollar reaction here will be what ignites a commodity rally. The 2-year chart for the dollar index shows that the dollar is rounding over beneath a zone of resistance that dates back to a reversal that occurred at this level last October and November. The pattern that has formed from last July looks like a large Head-and-Shoulders bottom with the Right Shoulder of the pattern about to form. If this is what it is, it implies that the dollar will in due course go considerably higher to the 102 – 104 area, which we can expect to happen during the market crash phase, but first there is the little matter of the Right Shoulder forming to balance the pattern, and if a more or less symmetrical Right Shoulder forms then we are looking at the dollar dropping to the 91 – 92 zone over the near-term, which will be sufficient to generate a significant snapback rally in commodities, that, as mentioned above, is likely to be magnified by short covering. That is the theory that I have and which is mine and what it is too.
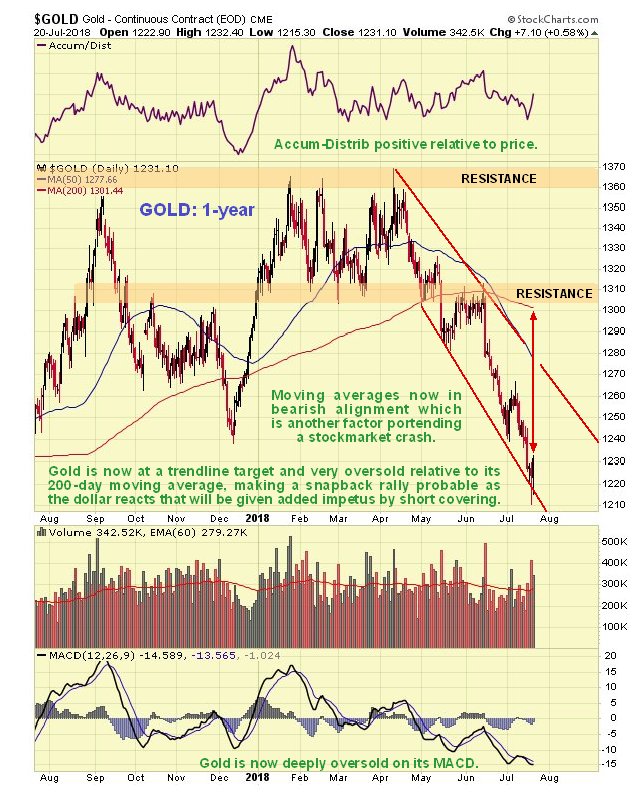
So now let’s proceed to review the charts of a range of important commodities – copper, gold, silver, and platinum and their respective COT charts, which will give us more of an idea regarding how likely it is that they will soon rally. 1-year charts are selected to enable us to relate them directly to the COT charts which are also for 1-year. Starting with gold we see that it has accelerated into a deeply oversold state on its MACD indicator and relative to its moving averages, with the drop from its April peak clipping $150 off its price at its April peak. Clearly gold didn’t take kindly to the dollar’s latest rally. Gold’s accumulation line has held up well, however, which increases the chances of a snapback rally imminently, which will be augmented by sudden short covering as mentioned above.
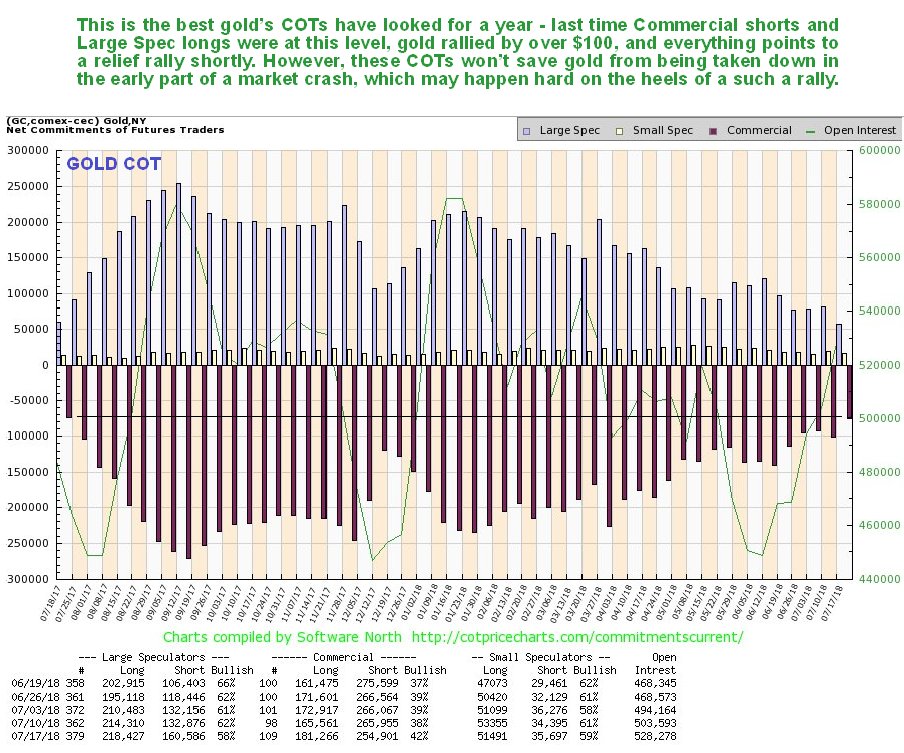
Not surprisingly, Gold’s COTs have improved substantially as this drop has unfolded, and this past week arrived at a level that is construed as bullish, as the manic – depressive and wrong Large Specs gave up on gold in increasingly numbers. These are the best readings we have seen for a year, and while they don’t guarantee an immediate rally, they make one highly likely.
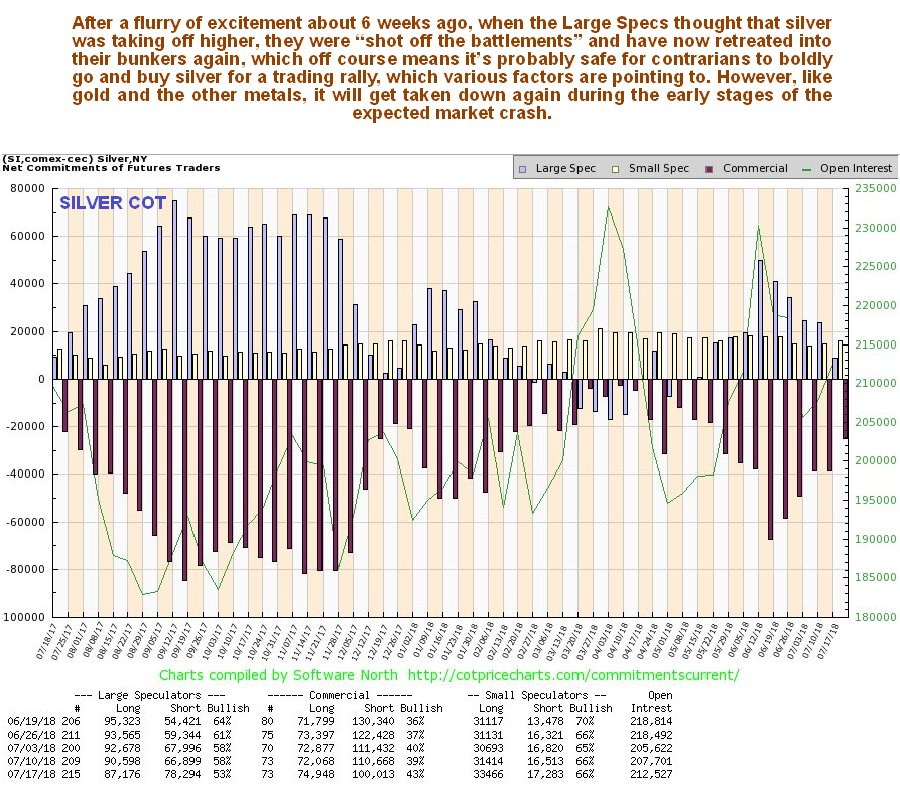
Silver has also dropped, albeit rather grudgingly, because it is already so depressed, and it is noteworthy that it is approaching but has not dropped below its lows of last July, as we can see on its latest 14-month chart, with this timeframe being selected to show this low. Whilst not as oversold as gold, it too looks set to bounce back with it, although it will encounter significant resistance above $16. As with gold, silver’s accumulation line has held up well and supports a rally soon.
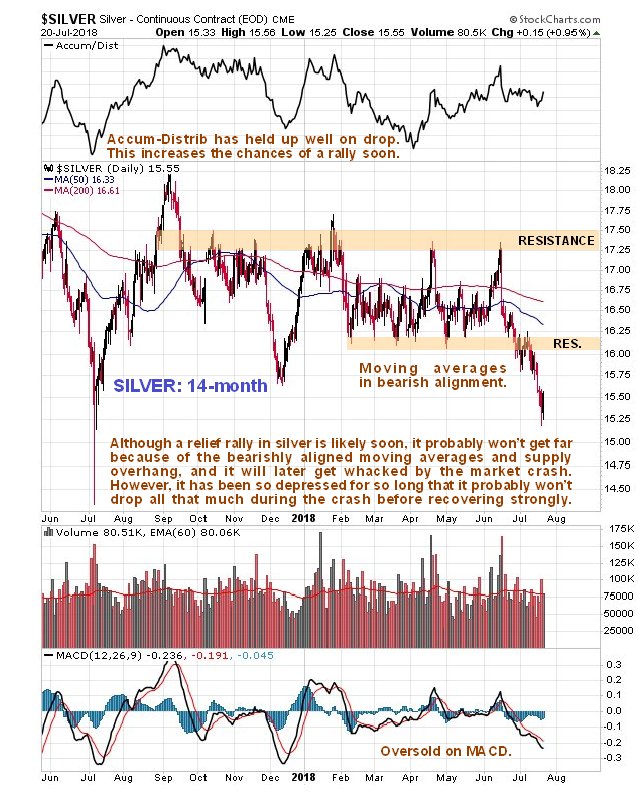
Silver’s latest COT chart shows that the Large Specs suddenly got enthused with it some weeks back before they were shot off the parapets and finally crawled back into their hole in a capitulative manner last week when their long positions plunged to a low level. While Commercial short positions could drop a bit more (Small Specs are still quite bullish), they have certainly dropped enough to permit a rally to develop.
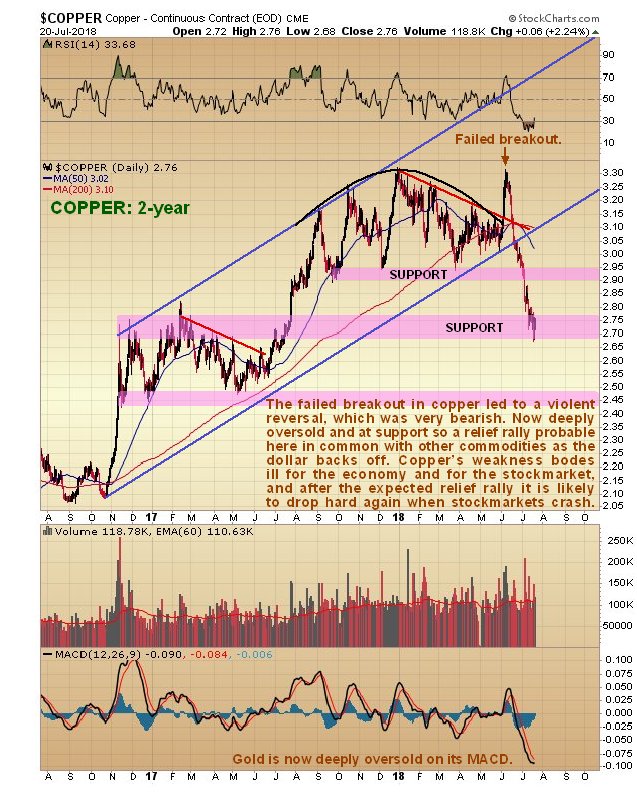
Moving on we see that poor old Dr Copper has “taken it on the chin” in recent weeks, after a failed attempt to break out into a 3rd upwave was followed by a violent reversal and breakdown from its long-term uptrend. This alone has bearish implications for the entire world economy. However, it is now deeply oversold, at support, and thus in position to stage a relief rally. We are looking at a 2-year chart for copper in order to see the origin of its long-term uptrend and also the significant support that exists at and just below current levels that arises from the considerable trading in this area in the trading range that formed from November 2016 through July 2017.
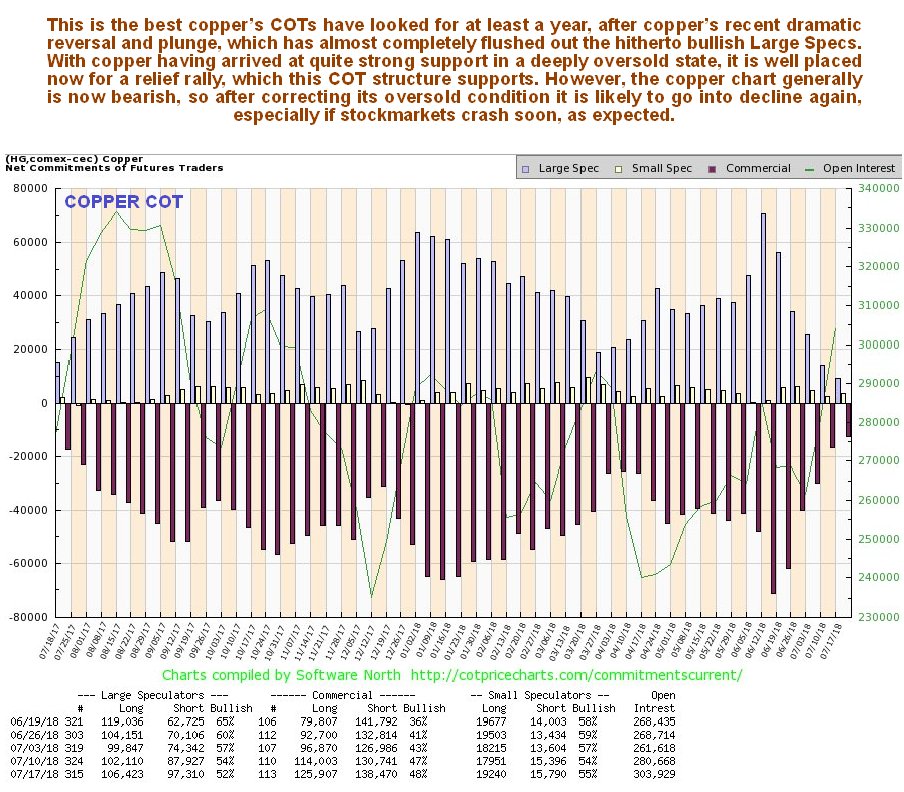
Copper’s COTs now look decidedly bullish for the near-term, with the Large Specs, having taken a severe beating, giving up and heading for the hills, which of course greatly increases the chances that it will now rally.
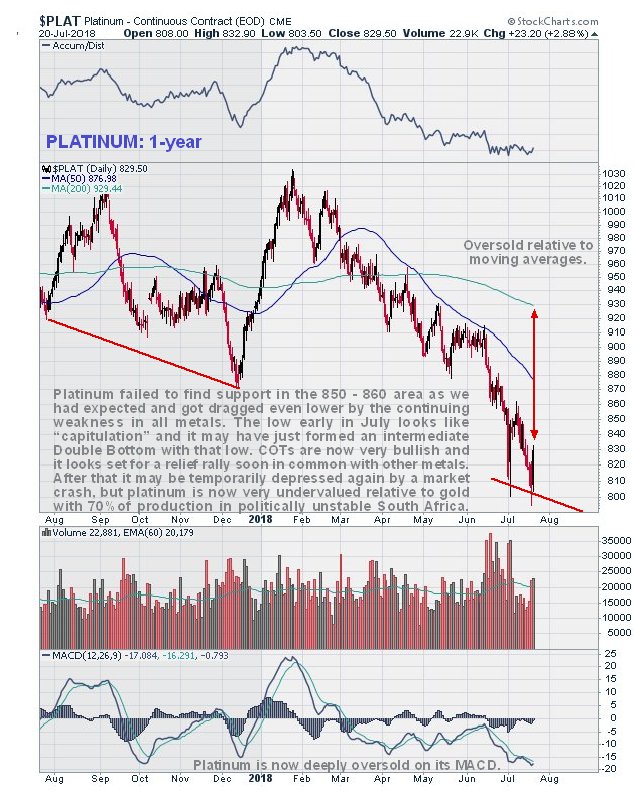
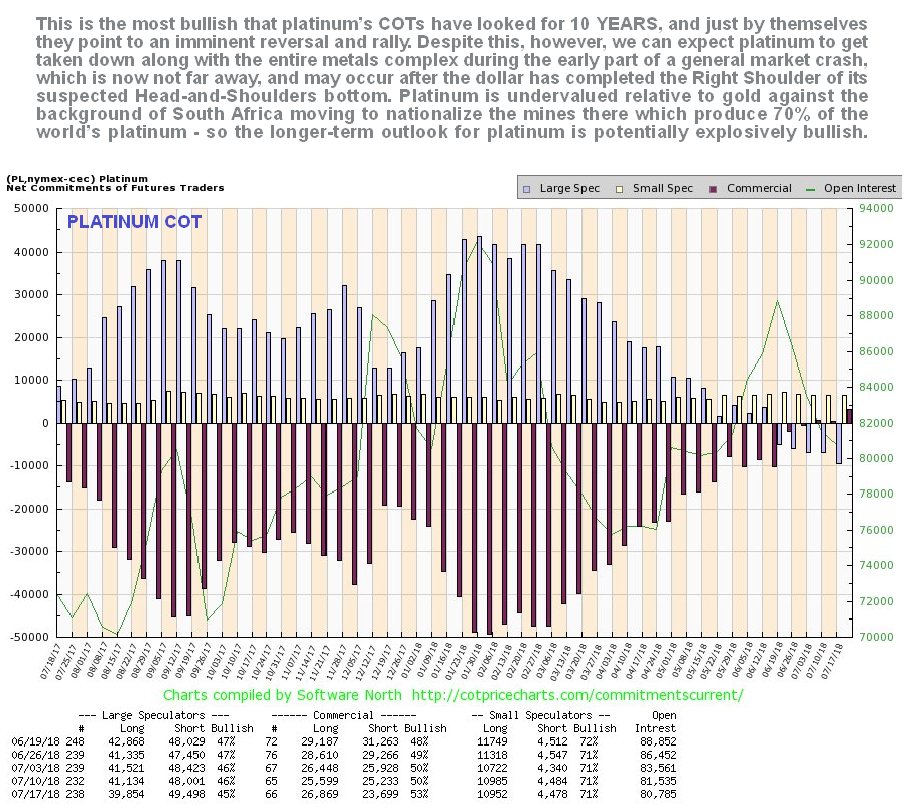
You may recall that we had thought that platinum had hit bottom some weeks back, largely on account of the collapse in Large Spec long positions, but it has since dropped even further in sympathy with the sector, and we now have a situation where the Large Specs are short to a significant degree, which is considered to be very foolish given how undervalued platinum is relative to gold, and given the South African government’s plans to take over the mining industry and kick out the whites running it, which, needless to say, will lead to a shambles and probably a supply shortage. Of all the metals, platinum looks like the best value here. The spike down to a low early in July looks like a capitulative move, and the low of a few days back looks like a Double Bottom with that low that will probably lead to a significant snapback rally – at least until the markets crash.
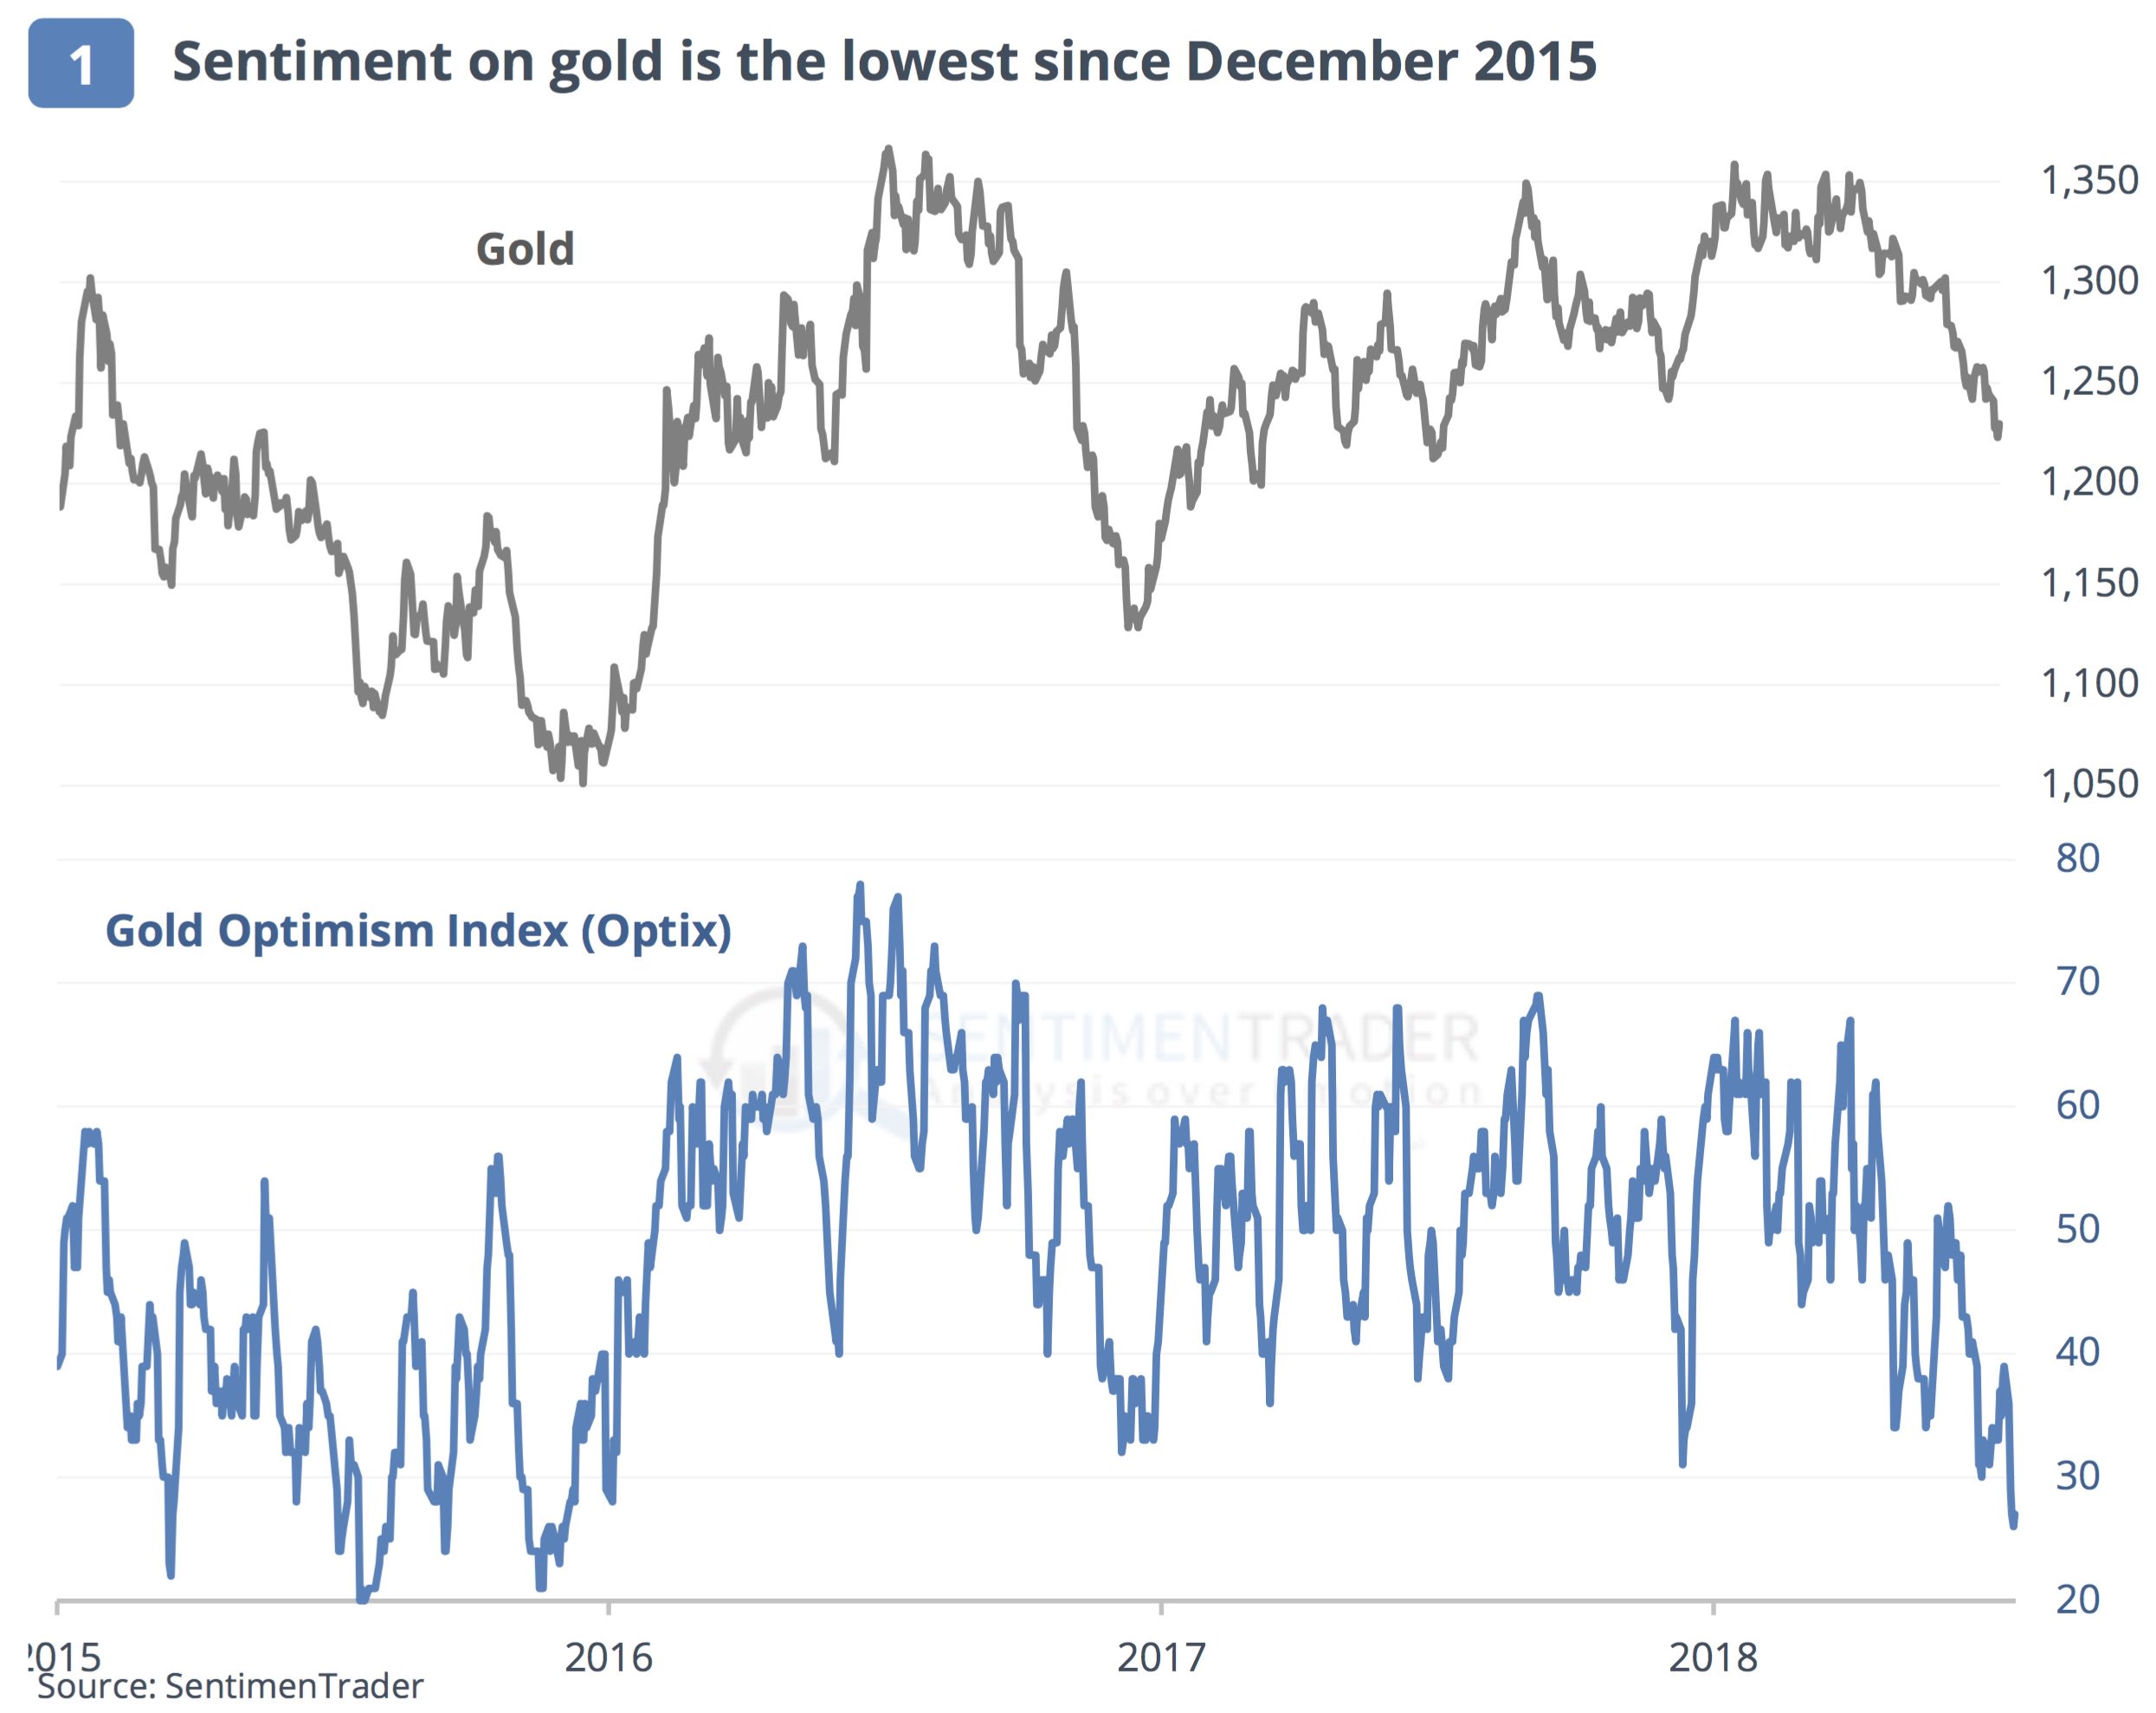
Here is a special update on the gold market from Jason Goepfert at SentimenTrader: Optimism on gold dropped to one of its lowest levels in its 7-year bear market, and the lowest since December 2015. When holding through all days when sentiment was this low, gold’s returns over the next few months were excellent, especially the risk/reward…
….also from KingWorldNews: A Golden Opportunity – Pretium is one of the cheapest miners relative to NAV and earnings on next year’s estimate that I have ever researched.

 Asian stocks have commenced on a positive note this morning, as strong U.S. corporate earnings and optimism over China boosting fiscal support for its economy rekindled risk appetite. European markets could benefit from the risk-on sentiment; however, gains may be limited as investors adopt a guarded approach ahead of a meeting between the European Commission President Jean-Claude Juncker and U.S. Donald President Donald Trump.
With escalating trade tensions between the European Union and the United States still, a key theme that continues to weigh on global sentiment, the outcome of today’s meeting could leave a lasting impact on the markets. If the talks prove unsuccessful and trade tensions end up escalating further, risk sentiment is likely to be negatively impacted. Market players should be prepared to expect the unexpected from the talks, especially when considering how highly unpredictable the Trump administration can be.
Turkish Lira crumbles after central bank holds rates
The Turkish Lira depreciated heavily against the Dollar yesterday after the nation’s central bank defied market expectations by leaving interest rates unchanged at 17.75%, despite inflation soaring.
This move immediately raised questions over the central bank’s independence, a month after President Recep Tayyip Erdogan’s re-election under an amended constitution that enabled him to follow through on his promise to take more direct control over monetary policy. Outside of Turkey, global trade tensions, a broadly stronger Dollar and expectations of higher US interest rates have exposed to the Lira to downside risks. With a combination of external and domestic factors eroding buying sentiment towards the Lira, the local currency remains at risk of depreciating towards 5.00 and beyond against the Dollar.
Currency spotlight: EUR/USD
The euro/U.S. dollar (EUR/USD) currency pair was on standby on Wednesday morning, as investors positioned ahead of the anticipated meeting between US President Trump and European Commission President Jean-Claude Juncker.
Heightened concerns over a trade war with the United States have shaved some attraction away from the euro and this can be reflected in the bearish price action. There could be some action on the EUR/USD today depending on the outcome of the meeting. Focusing on the technical picture, the EUR/USD remains in a wide range on the daily charts. Sustained weakness below 1.1700 could inspire a decline towards 1.1640 and 1.1600, respectively. In regards to the longer-term outlook, the divergence in monetary policy between the European Central Bank and the Federal Reserve could ensure the currency pair remains depressed for prolonged periods.
Commodity spotlight: Gold
It has been a quiet start for gold this morning as bulls and bears were both missing in action. Regardless, the yellow metal remains bearish on the daily charts and has scope to extend losses as the Dollar stabilizes. Although global trade tensions could accelerate the flight to safety and support appetite for safe-haven gold, any meaningful gains are likely to be threatened by U.S. rate hike expectations. Gold bears need to attack and conquer $1,213 for prices to sink towards the psychological $1,200 level.

Google was already worth more than $800 billion and, while well short of Apple, is now jumping into that batch of companies that are on their way to being a $1 trillion company.
Alphabet, Google’s parent company, substantially outperformed market expectations in its second quarter by bringing in $32.66 billion. That’s a 26 percent increase year-over-year… CLICK for the complete article

-
I know Mike is a very solid investor and respect his opinions very much. So if he says pay attention to this or that - I will.
~ Dale G.
-
I've started managing my own investments so view Michael's site as a one-stop shop from which to get information and perspectives.
~ Dave E.
-
Michael offers easy reading, honest, common sense information that anyone can use in a practical manner.
~ der_al.
-
A sane voice in a scrambled investment world.
~ Ed R.
Inside Edge Pro Contributors

Greg Weldon

Josef Schachter

Tyler Bollhorn

Ryan Irvine

Paul Beattie

Martin Straith

Patrick Ceresna

Mark Leibovit

James Thorne

Victor Adair