
Asset protection
Slowly but surely, cash is moving away from banks as depositors increasingly shift funds to products that pay higher yields.
That much has become abundantly clear during the current earnings season whereby the big banks have reported an acceleration in deposit outflows especially from wealthy individuals as interest rates continue rising across the board. Main Street depositors have started following suit as well after the Fed hiked short-term rates for the 7th time in less than three years…. CLICK for the complete article

QUESTION: Hi Marty,
I continue to read your blog and if I understand correctly, interest rates are going up.
My question is, can one profit from higher interest rates such as buying CD or bank stocks like Wells Fargo?
ANSWER: The one thing you do not want to do is buy a CD with maturity. As rates go higher, you will be locked in and unable to take advantage of the rising rates. Bank stocks will not benefit from higher rates in general. So that is not a valid reason to buy bank stocks. The safest thing would be to buy US TBills or agency paper no more out than 90 days and keep the cash rolling in that area until we reach a point when the rates are peaking. Toward the end, the yield curve will invert so that means the short-term rates will exceed long-term when confidence is shaken.
In an upward cycle for interest rates, never lock & load – always stay nimble if you are the investor. If you are the borrower – load & load fixing the rate out as long as possible.
….related from Martin: Russia Dumps US Bonds – Is it Politics or Yield?


In June 2018 a single family dwelling in the hot metros of Vancouver, Calgary and Toronto is now 24% cheaper if purchased in USD as opposed to CAD. They were 28% cheaper in February 2016 and at the March 2009 Pit of Gloom, prices were 21% cheaper in USD.
The ensuing commodity price spike blew out first in oil and housing in 2007-08 with the propellant of a low CAD exhausting itself at par at the 2008 peak.
Going into the March 2009 crash the FX spread widened to 21% cheaper Canadian housing in USD and then the tracks were replaced with slick new central bank high speed ZIRP rails and housing no longer needed to catch a ride on the commodity train but went air borne on a maglev of credit.
On this hyper ride the CAD quickly accelerated and by the spring of 2010 only a year after the Pit of Gloom the world traded Canada at par with the US on energy and housing. But then the CRB Commodity Index priced in USD blew out in the spring of 2011 and then in the fall of 2013 spot oil reversed to the downside. The cyclical change in trend has been set.
Enthusiasts for Canadian housing denominated in CAD may have now come to realize that a switch has been thrown. Calgary housing values have been shunted onto a siding and the brakemen are now working in Toronto, and Vancouver.

 |
Anticipate before you participate in the market. This is a classic piece of advice I like to give investors and have written about extensively in my CEO blog, Frank Talk. Financial markets are influenced by relatively predictable cycles and trading patterns, and by better understanding these we are able to react thoughtfully to headline noise or unexpected market developments.
How many of you remember the old police procedural Dragnet? In it, Sgt. Joe Friday famously uses the line “Just the facts, ma’am.” I’ve always felt this nuts-and-bolts attitude relates perfectly to how our investments team makes its decisions on where to allocate capital. Follow the models, look at the math—and leave emotions at the door.
A Sentiment Indicator for Contrarian Investing
At U.S. Global Investors, one tool that we find particularly useful to track the different market cycles is our U.S. Global Sentiment Indicator. This indicator tracks 126 commodities, indices, sectors, currencies and international markets to help monitor volatility and cash flow levels.
Using this indicator, we note the percentage of positions that have five-day moving averages above or below the 20-day moving averages. Then we compare it to the S&P 500 Index. As you can see in the chart below, as of Wednesday, the sentiment indicator rebounded to 54 percent, rallying from a low of around 20 percent at the end of June.
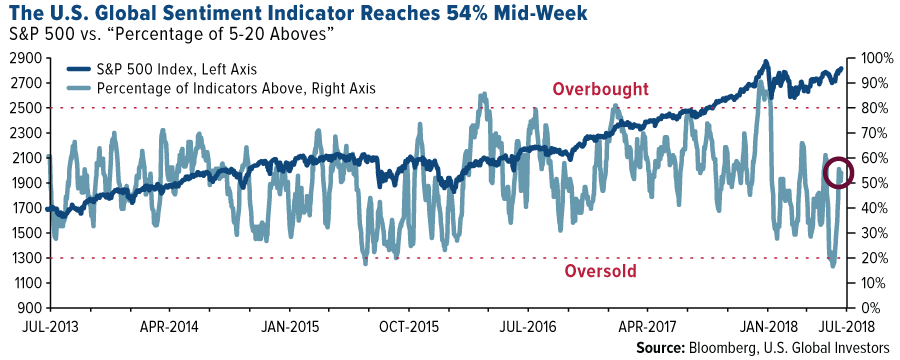
While a drop below 20 percent means the market is extremely oversold, we do not view the market as overbought until around the 80 percent mark. Having a keen awareness of these movements allows our investments team to be more proactive rather than reactive. It helps us manage our emotions and not be swept away by negative media or overly optimistic headlines.
Explore this topic further in the Managing Expectations whitepaper!
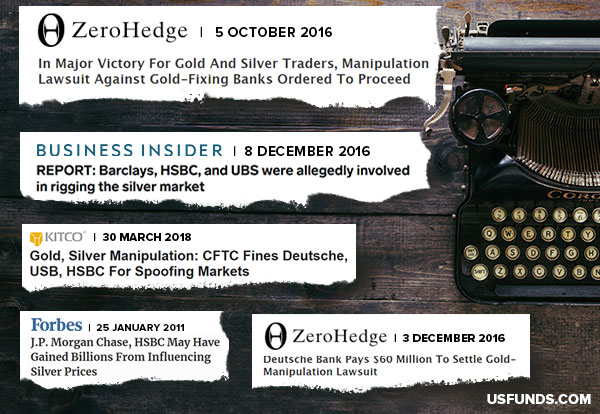
Is the Gold Market Being Suppressed?
Gold continued its trek lower last week, the price steadying around $1,220 an ounce on Tuesday following Federal Reserve Chair Jerome Powell’s congressional testimony. Powell commented that he thought the U.S. was on course for continued steady growth, supporting his expectation of a rate hike every three months. These comments sent the dollar up and gold down.
Despite this movement, I’m amazed that gold is holding up so well, particularly when you compare real interest rates in the U.S., Japan and the European Union.
In addition to these price moves, we’ve seen suppression and manipulation in the gold market in recent years. This is a topic I discussed last week in our webcast, cohosted by Randy Smallwood, CEO of Wheaton Precious Metals.
What do I mean by “gold suppression”? Historically, the price of gold has tracked U.S. debt, but as you can see in the chart below, that seems no longer to be the case.

The question, then, is not whether gold is actively being suppressed, but to what extent and by whom. Traders working at some big banks—including UBS, Deutsche Bank and HSBC—have already been charged for manipulating the price of precious metals futures contracts and fined as much as $30 million by the Commodity Futures Trading Commission (CFTC).
However, I’m skeptical that this has resolved the issue. In the past several years, gold has traded downin the week prior to China’s Golden Week, when markets are closed. As much as $2.25 billion of the yellow metal was dumped in the futures market in October 2016, as someone clearly sought to take advantage of the fact that markets were closed for the week in the world’s largest buyer of gold.
During the webcast, Randy Smallwood thoughtfully pointed out that the deliberate suppression of prices can’t go on forever. I agree, and believe that precious metals such as gold and silver are significantly undervalued right now.
So what should investors be paying attention to?
The Magic Behind the Math
Using an oscillator chart, let’s compare the U.S. dollar to gold. I believe oscillators are vital to identifying the optimal time to buy or sell, and right now it appears that the greenback is overbought while gold is oversold.
Looking back over five years of data, we’ve discovered that, historically, when gold exceeded two standard deviations above the mean, the commodity fell 51 percent of the time in the following three months.
In contrast, when gold prices exceeded two standard deviations below the mean, it rose 77 percent of the time in the following three months. This is because gold is undervalued at this level.

Buying the laggards when the time is right could enable you to participate in a potential rally—and right now, that rally could be in gold, currently down 2.24 standard deviations.
Understanding this kind of math is almost like being adept at counting cards. In the 2008 film 21, an MIT professor helps six students become experts at card counting. The story, based on true events, shows how these students end up taking Vegas casinos for millions in winnings by following their professor’s teachings. Of course, there’s no way I can promise such an extraordinary outcome in your investments, but I do think there’s something to be said for the magic behind the math.
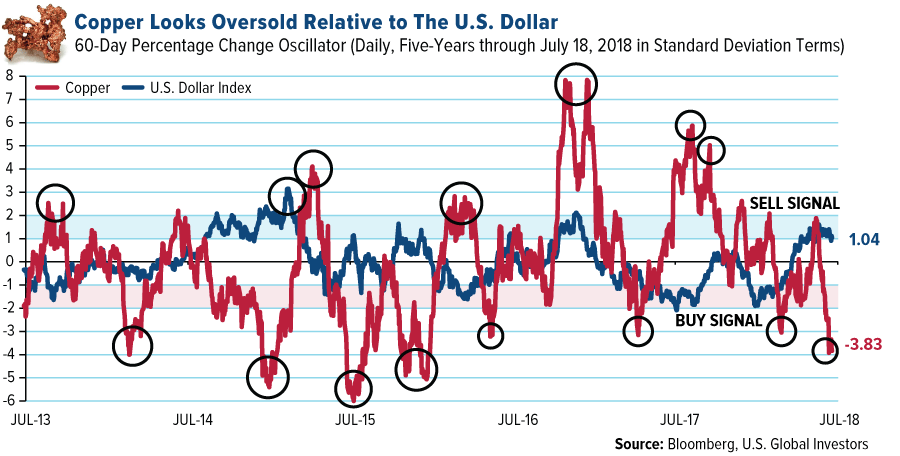
King Copper Could Also Be Due for a Reversal
Gold isn’t the only commodity that might be due for a reversal. Take a look at this chart showing copper versus the U.S. dollar. The red metal looks even more oversold than gold, down close to four standard deviations as of July 18. As I mentioned in the 2018 Commodities Halftime Report, copper looks attractive on surging demand for electric vehicles (EVs), which require between three and four times as much copper as traditional gas-powered automobiles.
What’s more, based on these mathematical models, emerging markets have the potential to move higher as well. I encourage you to take a look at the chart featured in the Europe section of Friday’s Investor Alert to see what I mean.
Always Remember the Golden Rule
Gold continues to be a classic example that helps illustrate seasonal rotations and price fluctuations based on a number of different factors geopolitical noise, inflation, wedding season in China and India, and much more.
The DNA of volatility, as I like to call it, shows that it is a non-event for gold to move up or down 17 percent over a rolling 12-month period. Knowing this has helped me to develop the 10 percent Golden Rule.
I have always advocated investors have around 10 percent of their portfolios in gold—5 percent in gold bullion or beautiful gold jewelry, and 5 percent in well managed gold mutual funds or ETFs. And then rebalance.
While no investment rules or statistical tools are accurate 100 percent of the time, investors can take ownership in how they use certain tools to manage emotions of the market and position themselves for greater success.
Capturing opportunities and understanding the ins and outs of the markets are what make investing so exciting.
All opinions expressed and data provided are subject to change without notice. Some of these opinions may not be appropriate to every investor.By clicking the link(s) above, you will be directed to a third-party website(s). U.S. Global Investors does not endorse all information supplied by this/these website(s) and is not responsible for its/their content.
Standard deviation is a measure of the dispersion of a set of data from its mean. The more spread apart the data, the higher the deviation. Standard deviation is also known as historical volatility.
The S&P 500 Index is a widely recognized capitalization-weighted index of 500 common stock prices in U.S. companies.
The U.S. Dollar Index is a measure of the value of the U.S. dollar relative to the value of a basket of currencies of the majority of the U.S.’s most significant trading partners. This index is similar to other trade-weighted indexes, which also use the exchange rates from the same major currencies.
Holdings may change daily. Holdings are reported as of the most recent quarter-end. None of the securities mentioned in the article were held by any accounts managed by U.S. Global Investors as of 6/30/2018: Wheaton Precious Metals Corp.
Know a fellow investor who could benefit from this type of weekly investment analysis? Share our Investor Alert sign up page with them—subscribing is always FREE!

-
I know Mike is a very solid investor and respect his opinions very much. So if he says pay attention to this or that - I will.
~ Dale G.
-
I've started managing my own investments so view Michael's site as a one-stop shop from which to get information and perspectives.
~ Dave E.
-
Michael offers easy reading, honest, common sense information that anyone can use in a practical manner.
~ der_al.
-
A sane voice in a scrambled investment world.
~ Ed R.
Inside Edge Pro Contributors

Greg Weldon

Josef Schachter

Tyler Bollhorn

Ryan Irvine

Paul Beattie

Martin Straith

Patrick Ceresna

Mark Leibovit

James Thorne

Victor Adair