
Stocks & Equities
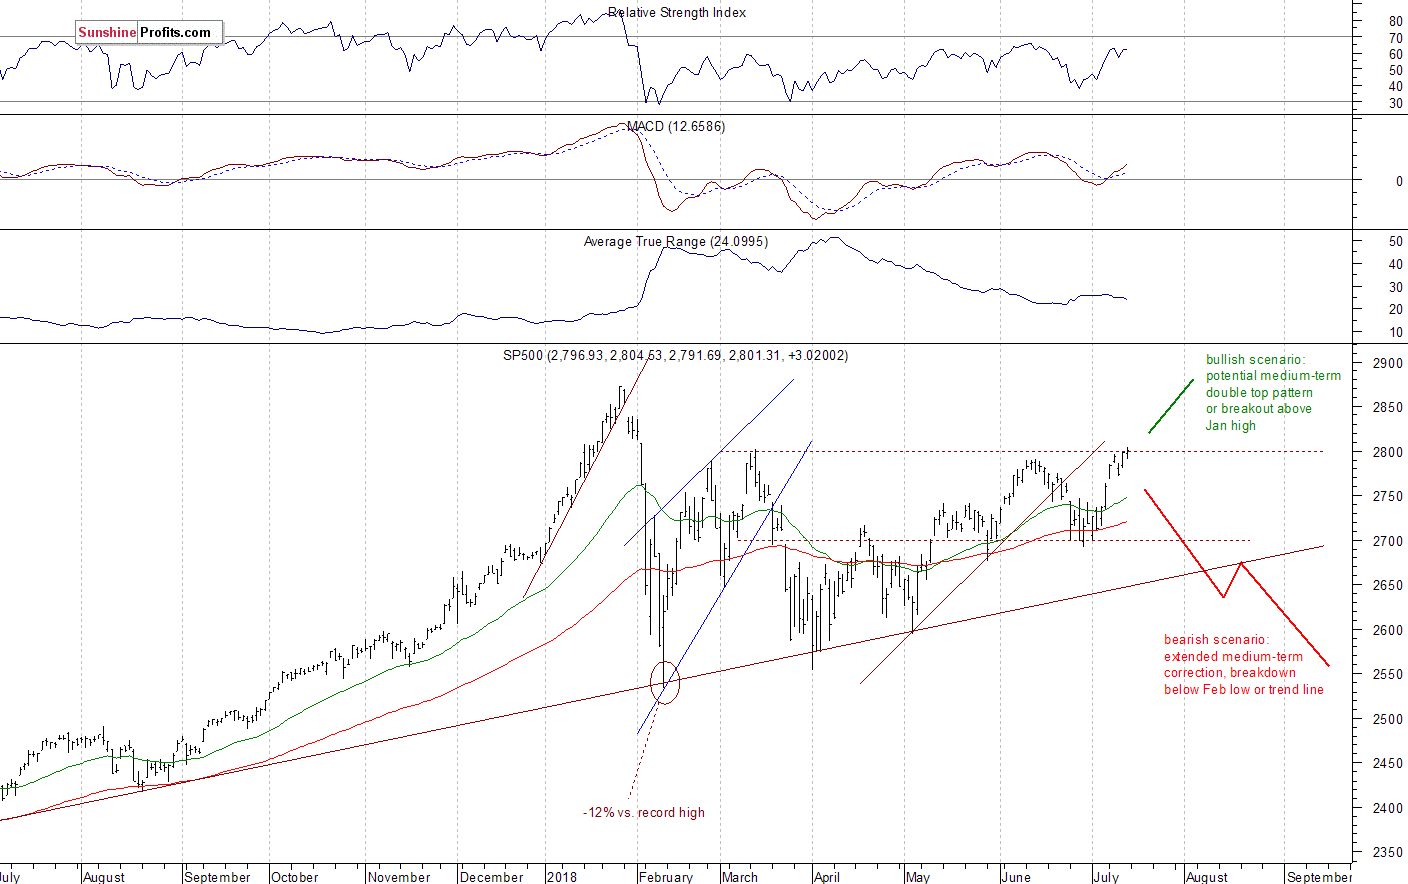
The U.S. stock market indexes were mixed between 0.0% and +0.4% on Friday, as investors took some short-term profits off the table following the recent advance. The S&P 500 index traded along the level of 2,800. It reached the highest since the early February. It currently trades 2.5% below the January’s 26th record high of 2,872.87. The Dow Jones Industrial Average gained 0.4% and the technology Nasdaq Composite was unchanged on Friday.
The nearest important level of support of the S&P 500 index remains at around 2,780-2,785, marked by the recent local lows. The next support level is at 2,765-2,770, marked by last Wednesday’s local low along with last Monday’s daily gap up of 2,764.41-2,768.51. On the other hand, the resistance level remains at around 2,800, marked by the previous local highs from February, March and June. The level of resistance is also at 2,840, marked by January the 30th daily gap down.
The broad stock market broke above its recent trading range a week ago. Is this a new uptrend or just more medium-term fluctuations following January-February sell-off? If the S&P 500 index breaks above 2,800 mark, we could see more buying pressure. Perhaps we could see a move to new record high. However, there are still two possible medium-term scenarios – bearish that will lead us below the February low following trend line breakdown, and the bullish one in a form of medium-term double top pattern or a breakout towards 3,000 mark. The S&P 500 index is closer to breaking higher now:
Still Bullish?
Expectations before the opening of today’s trading session are virtually flat, because the index futures contracts trade 0.1% higher vs. their Friday’s closing prices. The main European stock market indexes have been mixed so far. Investors will now wait for some economic data announcements today: Retail Sales, Empire State Manufacturing at 8:30 a.m., Business Inventories at 10:00 a.m. Investors will also wait for the quarterly corporate earnings releases. The broad stock market will likely extend its short-term uptrend this morning. However, we may see a profit-taking action at some point.
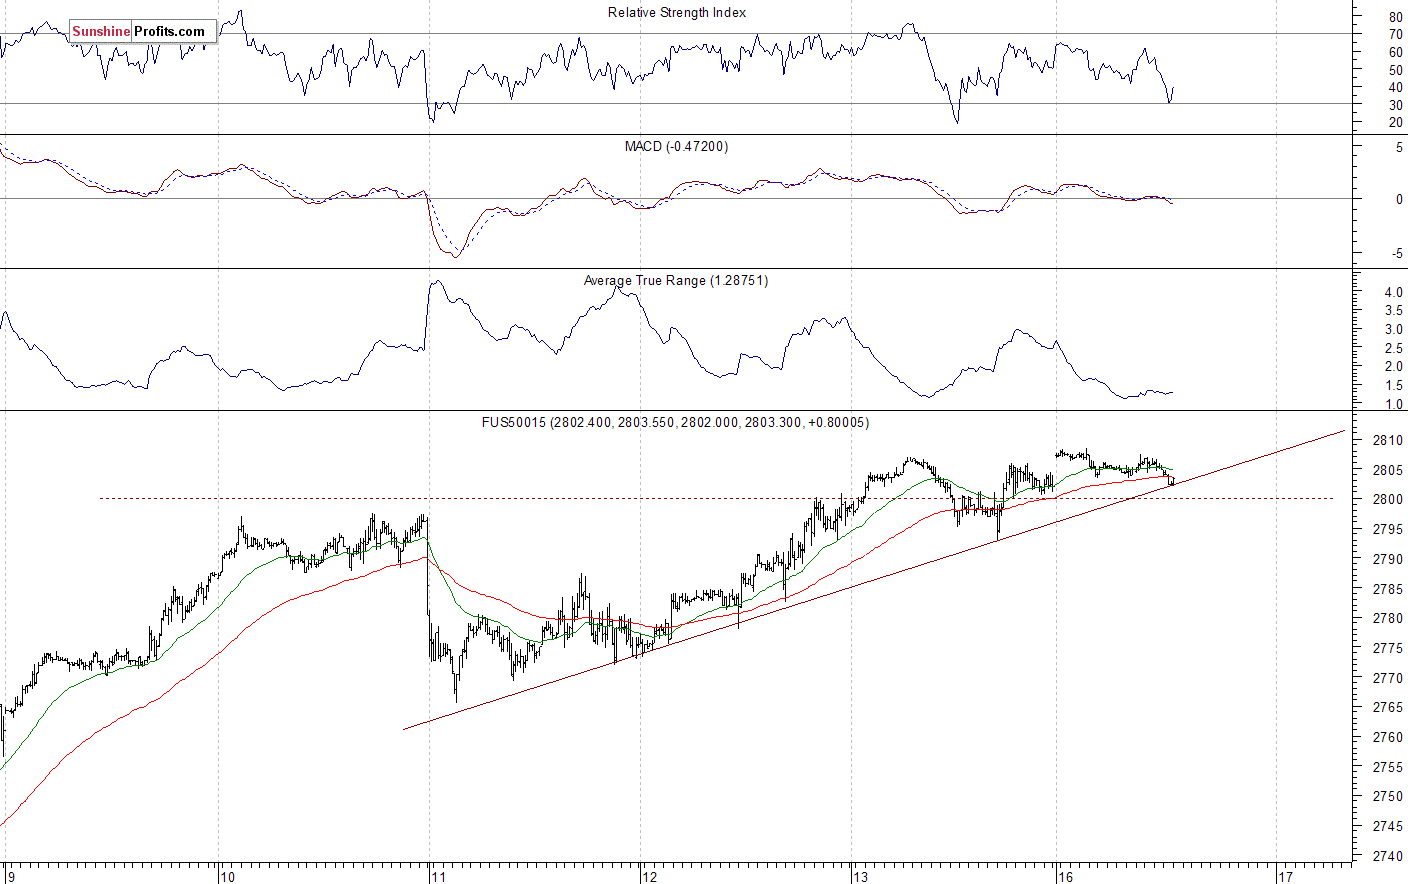
The S&P 500 futures contract trades within an intraday consolidation following an overnight advance. The nearest important level of resistance is at around 2,805-2,810, marked by the local highs. On the other hand, the level of support is now at 2,790-2,795, among others. The futures contract remains close to its short-term upward trend line, as the 15-minute chart shows:
Nasdaq Trades Along New Record High
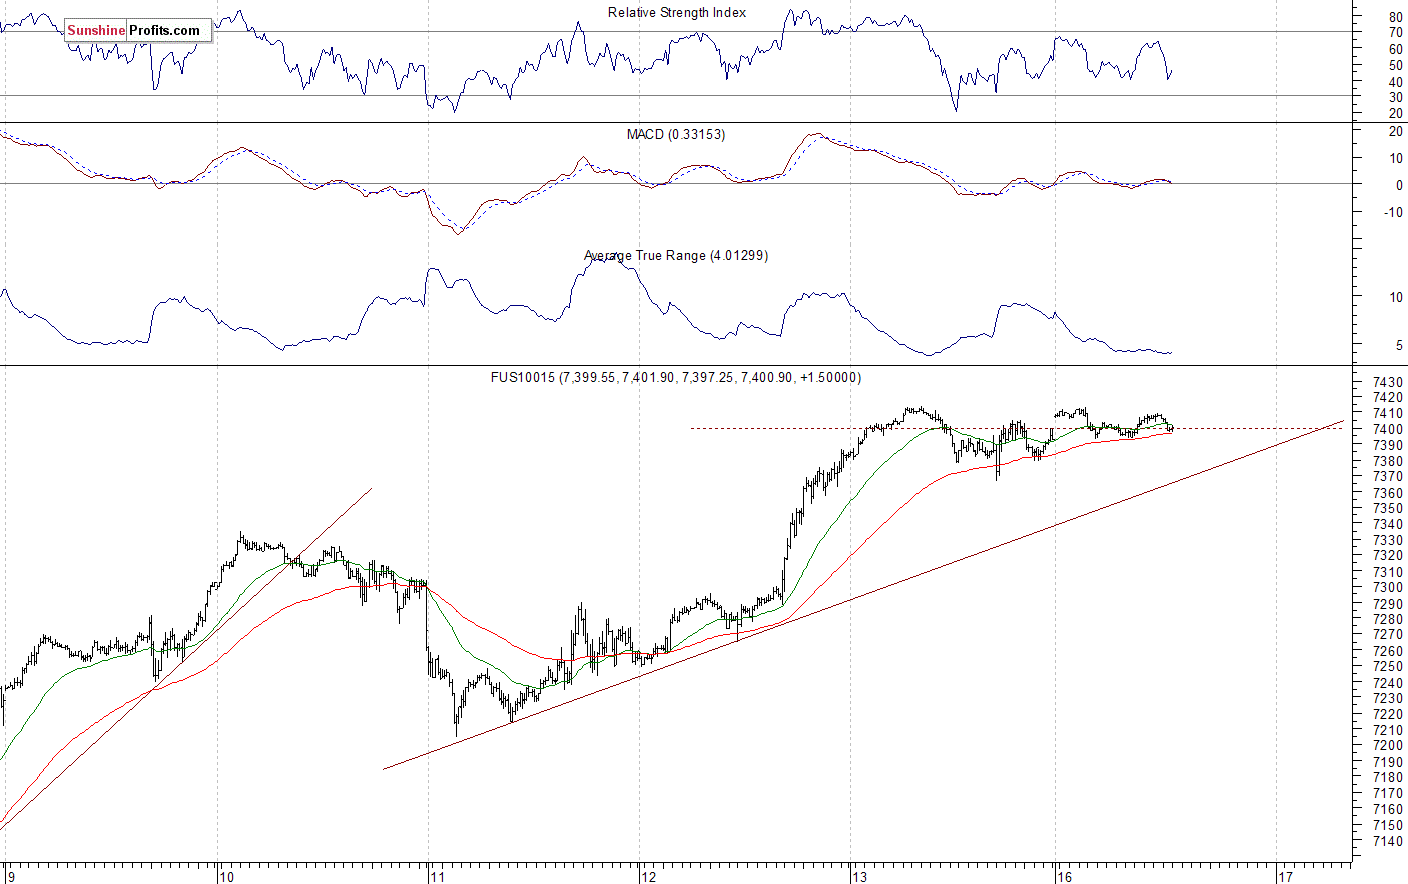
The technology Nasdaq 100 futures contract follows a similar path, as it trades along its short-term local highs. The market reached the new record high on Friday, as it broke above the level of 7,400. Will it continue upwards? There have been no confirmed negative signals so far. The nearest important level of support is at around 6,370, and the resistance level is at 7,410-7,420. The Nasdaq futures contract trades along the level of 7,400, as we can see on the 15-minute chart:
Apple Still Weaker, Amazon at Another New Record High
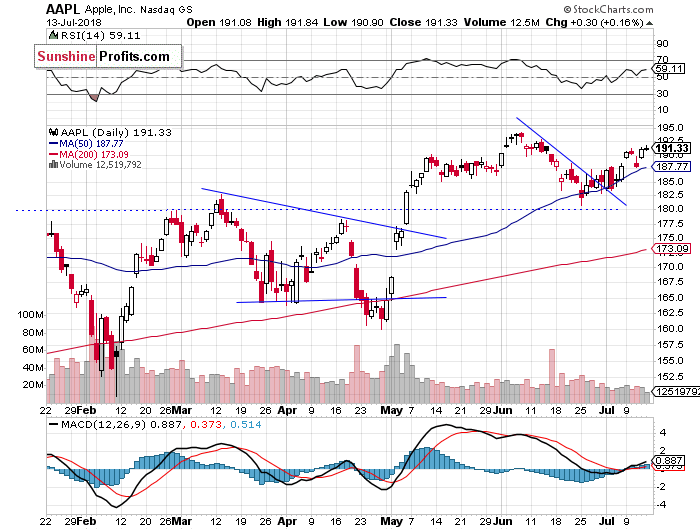
Let’s take a look at Apple, Inc. stock (AAPL) daily chart (chart courtesy of http://stockcharts.com). The stock slightly extended its advance last week, but it still trades at the resistance level of around $190-195. On the other hand, support level remains at around $185, marked by the previous level of resistance:
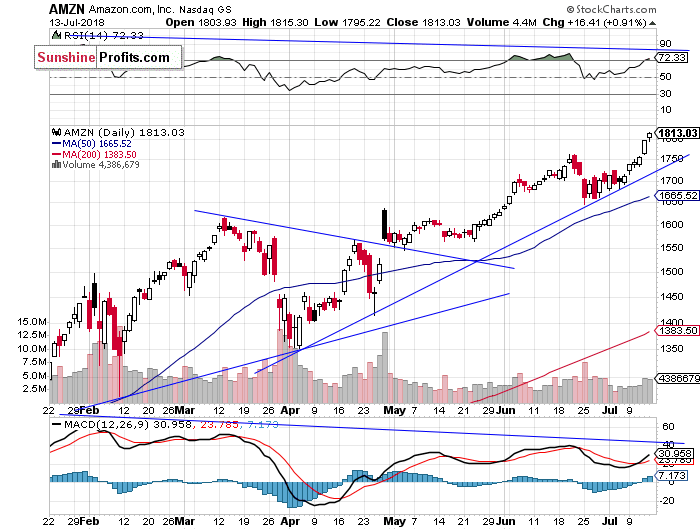
Now let’s take a look at Amazon.com, Inc. stock (AMZN) daily chart. It reached the new record high on Friday at the level of $1,815.30. The nearest important level of support is now at around $1,800, marked by the previous resistance level. We still can see negative medium-term technical divergences. But there have been no confirmed negative signals so far:
Dow Jones Slightly Above 25,000 Mark
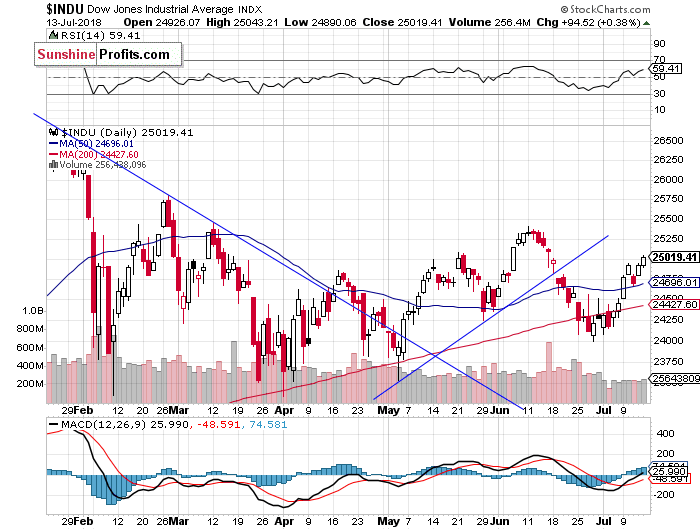
The Dow Jones Industrial Average closed slightly above the level of 25,000 on Friday. The market extended its short-term uptrend, but will it continue higher despite some short-term overbought conditions? There have been no confirmed negative signals so far. The 200-day moving average acted as a support level recently, as we can see on the daily chart:
The S&P 500 index broke slightly above the level of 2,800 on Friday, as it got the highest since the early February. But will the broad stock market continue towards its late January record high? It is just 2.5% below that level. Investors will now wait for the quarterly corporate earnings releases.
Concluding, the broad stock market will likely open virtually flat today. We may see more short-term uncertainty, as the S&P 500 index trades along its recent months’ highs.
If you enjoyed the above analysis and would like to receive free follow-ups, we encourage you to sign up for our daily newsletter – it’s free and if you don’t like it, you can unsubscribe with just 2 clicks. If you sign up today, you’ll also get 7 days of free access to our premium daily Gold & Silver Trading Alerts. Sign me up!
Thank you.
Paul Rejczak
Stock Trading Strategist

The upside price moves recently in the US Equities markets have been dramatic. While many people believe the US Equity markets are overvalued and setting up for a top, we believe just the opposite – that the US Equity market and strong US Dollar are attracting capital and investment from numerous internal and external sources. We also believe the Q2 2018 earnings season, which is just about to begin, could be an additional driving force for further price advances – with big upside moves ahead.
There are really three things at work in the global markets right now:
Strong US Dollar and global trade/policy issues: these are driving concerns and economic sustainability issues in many foreign nations and attracting investments as the US Dollar continues to strengthen against many foreign currencies.
Foreign Debt/Economic Sustainability issues: the fact that economic cycles, as well as political and social concerns, have roiled many foreign markets, elections and policies in combination with somewhat out of control debt levels in some countries is starting to weigh on investors. Yes, strategic investors will still be looking for opportunities, but longer-term investors are seeking risks everywhere and are searching for protected investments – not risky deflationary investments.
Leadership Changes/Challenges: as we have all recently seen, there are a number of political leadership and regional economic and policy challenges that are underway at the moment. Italy, Greece, Malaysia, Mexico, Denmark, Belgium and a host of others are all in the process of restructuring policies, objectives and SOP (standard operating procedures) to address new demands from their people and the world. What was acceptable, nearly 24+ months ago, is now just not the case any longer. The result is that leadership must adapt to the new demands of the people and economic environment.
Simply put, there is so much going on throughout the rest of the world in terms of currency valuations, global trade and policy issues, debt levels and economic sustainability concerns as well as leadership concerns and dramatically changing political and economic environments that investors are actively seeking some level of “standard of protection” for their capital.. And the only places on the planet, right now, that offers that standard are the US, Canada, and Great Britain. Our opinion is that, soon enough, the only economies on the planet that will be capable of handling the ROI and capital requirements of the world will be the most mature and dynamic economies on the planet.
Keeping this in mind, as we near the Q2 US earnings season, expect the following to play out:
- Technology will likely continue to shine with earnings growth and increased subscriber bases. Netflix, Hulu, Microsoft, Amazon and a host of others will likely surprise with earnings over the next few weeks.
- Industrial standards like Disney, Comcast, Charter Communications, Sony, Marvel and many others will likely support strong earnings and forward guidance.
- Manufacturing and Chemicals will likely be positive to mixed overall. Some companies will likely issue strong forward guidance while others may issue weaker guidance as a result of foreign market slowdowns.
- Biotech and healthcare will likely produce strong results overall as the past quarter has likely been a “lean operational process” for many not knowing what to expect throughout the next 12+ months.
- Weakness may be seen in some isolated instances with companies that may be more exposed to global demand and raw material costs (oil, copper, hard materials). Yet we believe the outcome of this Q2 earnings season will be moderately strong overall.
What does this mean for the markets?
This 240 Minute ES chart shows the recent upside price action as well as the recent breakout to new highs (above 2800 for the first time since March 2018). These upside price channels are likely to hold going forward and we expect earnings to drive prices to near or above 2900 (new all-time highs) relatively quickly in the ES. As we have been highlighting, we believe the ES and YM have the strongest potential for upside price moves compared to the NQ.

This Daily SPY chart clearly shows the rotational lows followed by upside price advances that are indicative of the recent price swings. These deep rotational lows continue to setup “higher low” price levels that allow technicians to understand price pivot formations. Each of these rotations sets up an opportunity for skilled traders to jump into the next upside move for profits. The recent breakout of new highs indicates we could be in for a dramatic move to well above $290 throughout the earnings season.

Lastly, this 240 Minute YM chart helps to illustrate the upside potential of the DOW & Transports Index. The last upside swing in price from July 7th till July 11th totaled about 800 points. If that move replicates with this new upside swing, we could see another +800 point move higher from recent lows near 24,500. This would indicate an upside potential to near 25,300 or higher.

Make sure you are positioned for these moves through this next earnings season. If our estimates are correct, we should see some fantastic trading opportunities over the next 30+ days. Visit www.TheTechnicalTraders.com to learn how we can assist you in capturing greater profits and greater success with our advanced research and market reporting, daily market videos, detailed trading signals and more. Join the hundreds of other traders that follow our research every day to create greater successes.
Also, visit here to read all of our most recent free research posts. We believe you’ll quickly see the value in what we provide our members and our visitors by reading and understanding how we have continued to stay ahead of these market moves for months.
###
Chris Vermeulen
website: www.thetechnicaltraders.com
Disclaimer: This material should not be considered investment advice. Technical Traders Ltd. and its staff are not registered investment advisors. Under no circumstances should any content from this website, articles, videos, seminars or emails from Technical Traders Ltd. or its affiliates be used or interpreted as a recommendation to buy or sell any type of security or commodity contract. Our advice is not tailored to the needs of any subscriber we advise that you talk with your investment advisor before making trading decisions. This information is for educational purposes only.

While equities continue to take the risk of escalating trade wars in stride, ignoring the threat of an additional $200BN in tariffs on Chinese exports and pushing the S&P back above 2800, some investors are taking a far more cautious approach: instead of piling into tech names – the most popular trade of 2018 bar none – Australian investment manager AMP Capital Investors, which manages $139BN, is instead buying ultra-long bonds as a hedge for a worst case scenario, according to Ilan Dekell, the head of macro for global fixed income at the asset manager.
“Six weeks ago, we started increasing our duration in the 30-year part of the curve,” Dekell told Bloomberg in an interview in Sydney. “It gives us a bit of protection. I can’t forecast the trade war.”
Doing the opposite of Horseman Capital, AMP Capital is also betting on continued dollar strength by shorting a basket of emerging-market currencies which have been pounded in recent months amid tightening global liquidity.


The oil market took a beating this week, with the return of Libyan supply weighing on crude prices…. CLICK for the complete article


Protectionist trade policies have really been whipsawing the market. The S&P 500’s seven-day defiant rally in the face of ongoing trade war bluster has suddenly been stopped in its tracks after president Trump escalated China tariffs from $34 billion to $200 billion—or at least has threatened to. Still, there are stocks that remain on the upswing and are likely to continue riding long-term trends despite ongoing trade wars and geopolitical instabilities…. CLICK for the complete article

-
I know Mike is a very solid investor and respect his opinions very much. So if he says pay attention to this or that - I will.
~ Dale G.
-
I've started managing my own investments so view Michael's site as a one-stop shop from which to get information and perspectives.
~ Dave E.
-
Michael offers easy reading, honest, common sense information that anyone can use in a practical manner.
~ der_al.
-
A sane voice in a scrambled investment world.
~ Ed R.
Inside Edge Pro Contributors

Greg Weldon

Josef Schachter

Tyler Bollhorn

Ryan Irvine

Paul Beattie

Martin Straith

Patrick Ceresna

Mark Leibovit

James Thorne

Victor Adair