
Gold & Precious Metals

One month ago, in a surprising reversal, we reported that Bridgewater was outperforming peers this year even after losing money in April, largely as a result of a a massive derisking, i.e. turning bearish. As Bloomberg further added, “the fund has also reduced its net long bets on U.S. equities to about 10 percent of assets from 120% earlier this year, and that overall, the fund is net short equities.”
And now we know why.
In one of Bridgewater’s latest Daily Observations authored by co-CIO Greg Jensen, the firm writes that “2019 is setting up to be a dangerous year, as the fiscal stimulus rolls off while the impact of the Fed’s tightening will be peaking” a point echoed yesterday by the head of the Indian central bank, Urjit Patel, who warned that unless the Fed ends its balance sheet reduction which comes as a time when the Treasury is soaking up dollar liquidity by issuing substantial amounts of Treasuries to fund the Trump budget, the tightening in financial conditions could lead to a global conflagration started by emerging markets.
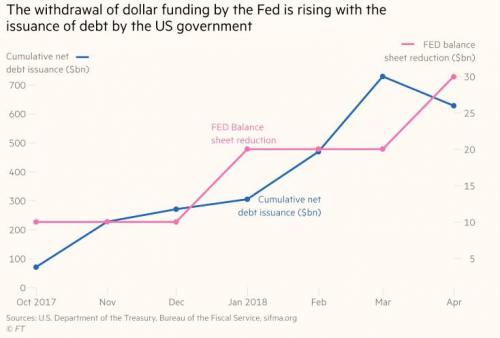
And since asset markets lead the economy, Bridgewater continues, “for investors the danger is already here” and explains as follows:
Markets are already vulnerable, as the Fed is pulling back liquidity and raising rates, making cash scarcer and more attractive – reversing the easy liquidity and 0% cash rate that helped push money out of the risk curve over the course of the expansion. The danger to assets from the shift in liquidity and the building late-cycle dynamics is compounded by the fact that financial assets are pricing in a Goldilocks scenario of sustained strength, with little chance of either a slump or an overheating as the Fed continues its tightening cycle over the next year and a half.
….continue reading HERE

The total U.S. public debt hit a new record high of $21.145 trillion on the last day in May. As the U.S. debt increased, so did the interest expense which jumped by more than $26 billion in the first seven months of the fiscal year. That’s correct; the United States government forked out an additional $26 billion to service its debt (Oct.-Apr) versus the same period last year.
While the U.S. debt reached a new high on May 31st, it took nearly two months to do it. Let me explain. During tax season, the total U.S. public debt actually declined from a peak of $21.135 trillion on April 10th to a low of $21.033 trillion on May 3rd. Since then, the U.S. debt has been steadily moving higher (including some daily fluctuations):
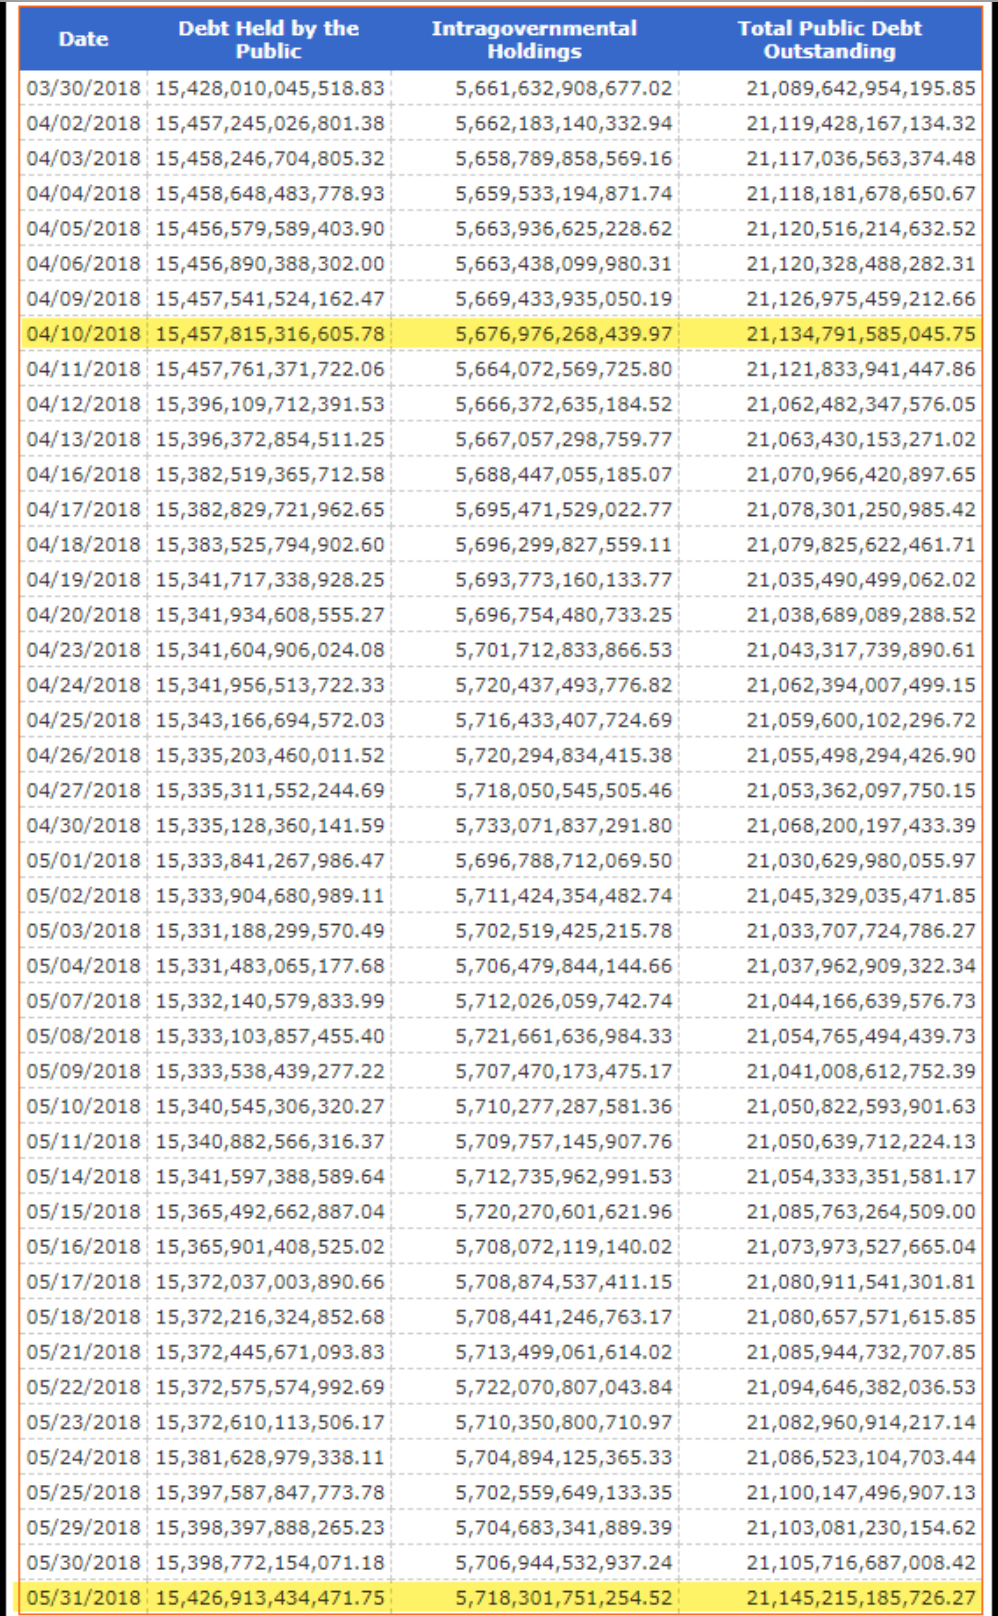
If you spend some time on the TreasuryDirect.gov site, you will see that the total public debt doesn’t go up in a straight line. There are days or weeks where the total debt declines. However, the overall trend is higher.
Now, a rising debt level impacts the interest the U.S. Treasury must pay on this debt… especially when the average interest rate also increases. According to the TreasuryDirect.gov, the interest expense rose from $257.3 billion (Oct-Apr) 2017 to $283.6 billion (Oct-Apr) this year:


As I mentioned, the U.S. government paid an additional $26 billion to service the debt than it did last year. Now, $26 billion may not seem like a lot of money these days, but it could buy the total global Registered Silver inventory:

Thus, the extra $26 billion paid by the U.S. Treasury to service its debt would have purchased the 1+ billion ounces of silver held in the COMEX (270 million oz) and all the Global Silver ETFs. And, this would include the 138 million oz of silver supposedly stored at the JP Morgan vaults.
However, with the remaining $10 billion ($26 billion minus $16 billion), the U.S. government could have also purchased all the Silver Eagles minted since 1987. According to my figures, the U.S. mint sold over 510 million Silver Eagles from 1987-2018. If we give a value of $20 for each, that would be roughly $10.5 billion.
And remember, this is just the ADDITIONAL interest expense paid from Oct-April to service the massive U.S. public debt. If interest rates continue to stay the same or rise for the remainder of the fiscal year, the U.S. government will likely pay between $45-50 billion more in 2018 to service its debt.
Lastly, I am quite surprised by some of the analysis coming from the precious metals community. I will be writing about this at length in a new article, but it’s quite frustrating to see precious metals analysts totally disregard energy in their work or change the facts to promote a certain ideology.
For example, Bix Weir recently posted a new video on the “10 Reasons to own Silver.” While I agree with some of the reasons he states to own silver, I was quite stunned to see Mr. Weir state in his 8th Reason was due to a 1/1 Ratio of Gold to Silver. Bix remarked that there were about 6 billion ounces of above ground gold and silver, so this One-to-One ratio meant that silver was undervalued.
I get it. However, Bix has been claiming that the world has millions of tons of gold in the world. But if he states there are 6 billion oz of gold above ground, that is roughly 187,000 metric tons… a figure that I have reported to be accurate for several years.
So, which is it??
Check back for new articles and updates at the SRSrocco Report.

For most of the past few years, emerging market stocks and bonds were among the favorite investments of everyone from hedge funds to pension funds to retirees.
 Now, not so much.
The next two charts (courtesy of Saturday’s Wall Street Journal) show the huge recent run ending in January, to be replaced by a full-on rout.

What happened? Well, it turns out that a big part of the apparent success of economies like Argentina and Indonesia came from their ability to borrow in international markets – frequently in US dollars – and use the resulting cash to build roads, bridges, airports, and soccer stadiums — that is, things that imply visible progress. Visitors came, saw all the “modernization,” went home impressed and hit “buy.”
But then US interest rates started to rise and the dollar spiked off of its recent lows. Treasury bonds suddenly started to look attractive relative to EM securities, while all those EM dollar debts began to look onerous rather than wondrous. The hot money decided to leave, putting downward pressure on EM currencies (which makes dollar-denominated debt even harder to pay off) and forcing EM central banks to tighten monetary policy and raise rates.


The result? Contraction where once there was limitless growth, and instability where there was rock-solid continuity. Emerging markets have been here before, of course, and history teaches that it will get worse before it gets better.
History also teaches that trouble on the periphery frequently moves towards the center to threaten developed world institutions that were buyers of all that EM dollar debt. Hedge funds, pension funds, bond funds, global stock funds, and major-bank prop trading desks, are all on the hook for Brazilian, Argentine, and Mexican paper, which means – history again – that US taxpayers are actually the ones on the hook.
So watch for apocalyptic headlines as the 1% softens the rest of us up for yet another transfer of wealth from middle to top.
 Rise in index has a lot of myriad causes
The US Dollar Index’s 4.5 per cent rise since mid-April has myriad causes. One, the Italian election annihilated the political center and produced the worst possible coalition scenario of the far left (Five Star) and the far right (Northern League), two populist, anti-euro parties that won 54 per cent of the vote. Italy has a de facto bankrupt banking system, a 130 per cent public debt/GDP ratio, vast regional inequalities (Milan and Calabria are different planets, as are Lombardia and Veneto from Sardinia) a toxic Mafia presence and a fiscal nightmare. Now its politicians want to renege on the fiscal/pension reforms imposed by Berlin and Brussels in 2011. This is the nightmare scenario for the euro and the euro is 57 per cent of the US Dollar Index.
Two, the Italian-German Bund debt spread has surged, as has Italy’s risk of sovereign default. The euro’s fall to its SNB’s floor against the Swiss franc at 1.20 is an ominous message of systemic risk. There is no way the ECB can begin quantitative tightening in September. A premature end to Dr Draghi’s asset purchase programme could literally trigger a Greek-style sovereign debt crisis – only on a far bigger scale. Italy has the third-largest bond market in the world. If Italy goes bad, Planet Forex will script the requiem for the euro and the dream born in the Treaty of Rome. The safe-haven bid in the US dollar has only just begun.
Three, the US-China deal averts an immediate trade war, though it is mathematically impossible for the US trade deficit to fall $200 billion on higher Chinese imports of US energy and agribusiness products. Chinese exports to the US will have to fall, a real risk to growth in Japan, South Korea, Taiwan, Singapore and Malaysia. Net-net, this means lower Asian currencies against the US dollar.
Four, the correlation coefficient between the greenback and Uncle Sam debt yield has risen in the past month with a vengeance. Japanese inflation data shows Governor Kuroda’s 2 per cent inflation target is a central banker’s midsummer nights fantasy. This means there is no chance that the Bank of Japan will exit its zero bond yield policy in 2018. Shinzo Abe is mired in a political scandal and yet another LDP factional night of the long knives. The path to ¥110, a target I outlined a month ago, was inevitable given US Treasury-JGB yield spreads, Fed-BoJ monetary tightening timetables and the political time bomb that now haunts Abenomics.
Five, the risk of emerging markets contagion is all too real as I watch the Turkish lira and the Argentine peso meltdown. There is $220 billion in external debt issued by non-financial Turkish corporates. There is $14 trillion of debt outside the US held by non-American banks. Deutsche Bank has $25 billion in equity capital and $1.7 trillion in liabilities. Is there a Lehman scale banking time bomb in Europe? Is the Pope Catholic? The world is on the precipice of a major funding and debt crisis. The US dollar is the world’s natural safe-haven currency as the US banking system is the only true credible deposit insurance scheme for savings when the lights go out in Europe.
Six, I was stunned to see the Canadian dollar trade as low as 1.2980 (Nafta?) even though Brent crude surged to $80 a barrel. When petrocurrencies fall while Brent hits 4-year highs, I get nervous. I remember the bitter memories of 2007 when I seriously thought that we were doomed to relive the Great Depression. Every post-war US recession has been preceded by a surge price of crude oil. Will the recession of 2019 be any different?
Seven, financial markets now ignore the US trade and budget deficits and focus on relative US economic outperformance versus Europe. This is the reason the Fed Funds futures contract implies three more rate hikes in 2018 and two rate hikes in 2019. King Dollar is back from its post-election Trumpian netherworld and King Dollar will now kick (rhymes with) glass My next target? ?1.08.
Eight, The Turkish lira has plunged to 4.80 lira against the US dollar despite central bank rate hike that is anathema to Erdogan. The AKP’s top economics honcho Mehmet Simsek will fly to London to reassure terrified investors. Too little, too late; a financial crisis and deep recession is now inevitable even as Erdogan goes to the polls to seek reelection on June 24. The Ottoman Empire died amid a tsunami of foreign debt. A deadly endgame awaits the world on the Bosphorus.
The writer is a global equities strategist and fund manager. He can be contacted at mateinkhalid09@gmail.com.

-
I know Mike is a very solid investor and respect his opinions very much. So if he says pay attention to this or that - I will.
~ Dale G.
-
I've started managing my own investments so view Michael's site as a one-stop shop from which to get information and perspectives.
~ Dave E.
-
Michael offers easy reading, honest, common sense information that anyone can use in a practical manner.
~ der_al.
-
A sane voice in a scrambled investment world.
~ Ed R.
Inside Edge Pro Contributors

Greg Weldon

Josef Schachter

Tyler Bollhorn

Ryan Irvine

Paul Beattie

Martin Straith

Patrick Ceresna

Mark Leibovit

James Thorne

Victor Adair