
Gold & Precious Metals

Steve Todd notes that although we have broken a downdtrend line from January, the Stock Market is somewhat overbought. The real short term money has been made in his bullish US Dollar and Bearish Gold posiitions R. Zurrer for Money Talks.
For 3pm PST Wednesday May 9, 2018
DOW + 182 on 675 net advances
NASDAQ COMP + 73 on 691 net advances
SHORT TERM TREND Bullish
INTERMEDIATE TERM Bullish
STOCKS: There seemed to be several factors at work on Wednesday. First, the political reaction to the decision on Iran seemed to be pretty mild on Tuesday. This probably encouraged investors.
Second, the inflation data was pretty benign. This suggested that the Fed may not be so anxious to raise rates.
Third, CNBC pointed out that there was a technical breakout for the S&P 500. We show this in the chart below.
GOLD: Gold was lower by $1. Very minor range at present.
CHART: The S&P 500 broke out of a declining trendline connecting a series of peaks going back to late January. This may have encouraged buying by traders who monitor this type of thing. Yes, we are overbought and that is something to be aware of.

BOTTOM LINE: (Trading)
Our intermediate term system is on a buy.
System 7 We are in cash. Stay there on Thursday.
System 9 We are neutral.
NEWS AND FUNDAMENTALS: The PPI-FD rose 0.1%, less than the expected 0.3%. Oil inventories dropped 2.2 million barrels. Last week they rose 6.2 million. On Thursday we get the CPI and jobless claims.
INTERESTING STUFF : There is no great genius without some touch of madness. —–Aristotle
TORONTO EXCHANGE: Toronto gained 68.
BONDS: Bonds were lower.
THE REST: The dollar had a mild drop. Crude oil surged to a new rally high.
Bonds –Bullish as of April 26.
U.S. dollar – Bullish as of April 23.
Euro — Bearish as of April 23.
Gold —-Bearish as of March 27.
Silver—- Bearish as of March 27.
Crude oil —-Bullish as of May 4.
Toronto Stock Exchange—-Bullish as of Feb. 12.
We are on a long term buy signal for the markets of the U.S., Canada, Britain, Germany and France.
Martin Armstrongs makes a vivid case that the booming Stock Market move that has been in motion vertically since 2016 is only going through a consolidation, and will ultimately resume its vertical move upward to extraordinary levels as it did in 1929.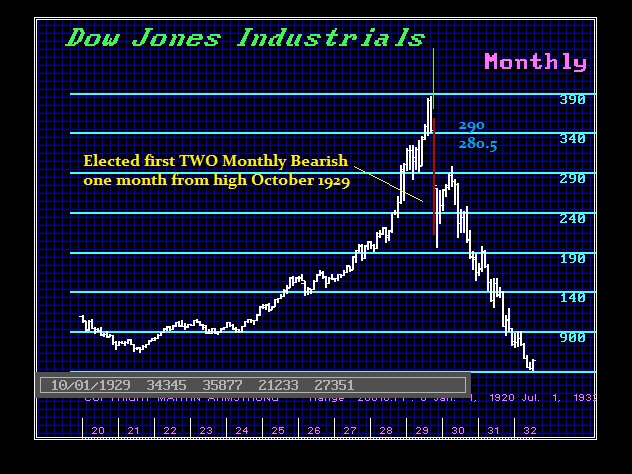
QUESTION: Thanks for the update. So it looks like the Vertical Market in the Dow will extend into the end of this cycle 2032 as you warned it could do. Correct?
EK
ANSWER: It appears to be shaping up that way. The consolidation has been shallow and nothing to get excited about. If the January high was it, then you should have made a major thrust downward by now certainly electing Monthly Bearish Reversal within the first three months. To judge the extent of a potential decline, the key is to watch HOW FAST does a market elect Monthly Bearish Reversals or Bullish for that matter. This is how to gauge the tone of a market. If we look at 1929, it elected the first TWO Monthly Bearish Reversals in just one month from the high. That was obviously a signal that this was going to be a protracted decline of MAJOR importance.
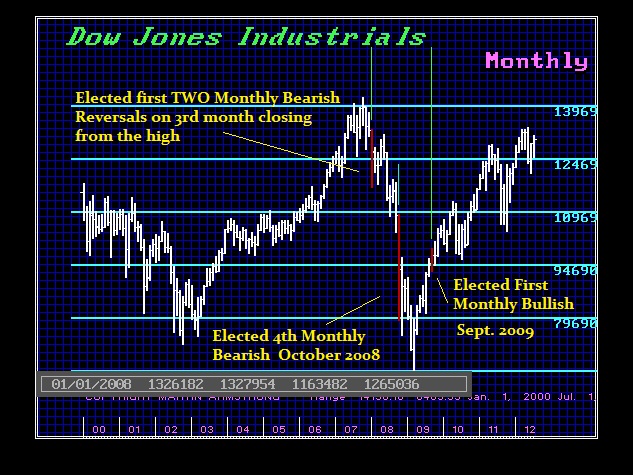
Now, let us compare 1929 to the 2007 Crash which was dramatic, but not anything close to 1929. We did elect ALL FOUR Monthly Bearish. Here we also elected the first TWOMonthly Bearish at the same time 3 months from the high. We have not elected anything on this consolidation no less even reached the Monthly Bearish. Then coming out of the low, it took 6 months to elect the first Monthly Bullish Reversal.
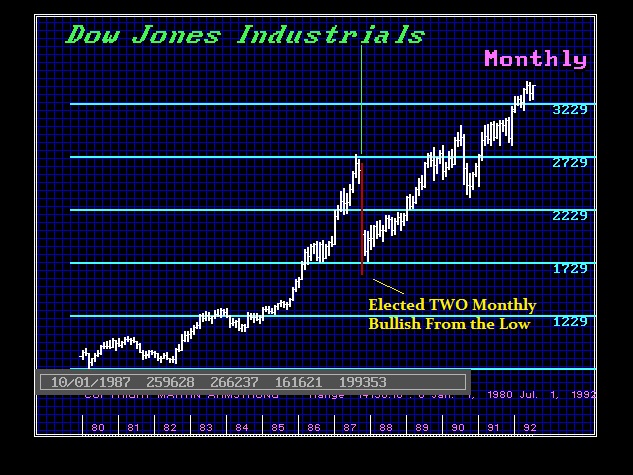
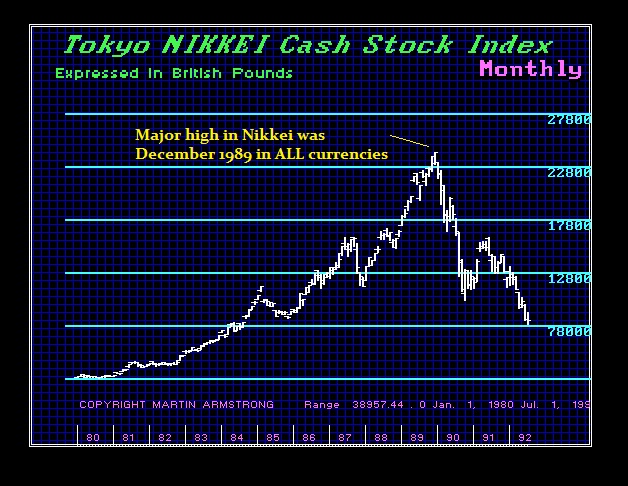
Now let us look at the 1987 Crash. People thought I was nuts when the very day of the low I came out and said that was it, the low was in place, and we would make new highs by 1989. Yes, this was all confirmed by the Economic Confidence Model. The low was precisely that day of the ECM and the next target was 1989.95 which was the Bubble top in the Nikkei. But this was NOT THE ONLY confirmation. We elected TWO Monthly Bullish Reversals at the close of October 1987. Hopefully, you can see that this was NOT a personal opinion call. We can see that we elected the Monthly Bullish right then and there. This is what I mean by how fast reversals are elected determines the type of trend move we get.
I love the idiots who so immediately are always trying to find something they can claim I am wrong about. They try to attack me like 99% of the analysts out there that offer just their opinion. The mere fact that they say – oh you are wrong, the Vertical Market is over, demonstrates that this type of person is INCAPABLE of ever learning anything because they are desperate to prove me personally wrong rather than become a student of the market. We are on a journey here to understanding how everything moves. These people are obsessed with trying to disprove something because they are not capable of understanding the free markets in the slightest. This is not about me being right or wrong. Nobody is ever right personally in life all the time. Everyone has opinions and everyone is wrong from time to time. We only learn from our mistakes – never our victories. So such comments simply reveal they are not really worth talking to for they cling to their beliefs and are incapable of converting.
The model is objective. That is the best way to approach this not opinion. The forecast was for a January high following be “consolidation” which is exactly what you call this. We have not declined to test the Monthly Bearish and we would have to close BELOW21600 on the Dow on a Monthly Basis to imply a short-term correction will be sustained even briefly.
Clearly, is the Vertical Market over? No way. There is no other choice for capital but to move to equities when (1) bonds crash, (2) confidence in government declines, and (3) the rise in interest rates send everyone’s budgets into high gear for automatic expansion.
Obviously, the people who are incapable of comprehending what is at stake here will be the source of profits for the rest of us. That is simply the way it goes. So smile, shake their hand, say oh you are right and thank you for being there when I need to trade against someone. Remember, we ALWAYS need the exit on a trade and that means if we will sell the high or buy the low, there has to be someone on the opposite side to sell or buy. That is the blunt reality of trading. So convert those who are with an open mind and seek to learn. Those who want to disagree just say thank you for being there when we need you the most. Don’t worry, they will not understand what you mean. Many like to see themselves as victims and paint their mistakes because of a great conspiracy against them. Don’t feel sorry for them. They just need to slepp with the light on, look in the closet, and check under the bed before they go to bed. It’s their nature – that’s all.
….also from Martin: Has the Dollar Turned?

In this past weekend’s missive, I discussed the market once again retesting support at the 200-dma.
“As stated, the market did defend its 200-dma and is very close to reversing its short-term ‘sell signal.’”

“That’s the good news.
The not so good news is that while the market did muster a rally on Friday, it still remains well-entrenched within the ongoing consolidation/correction process.”
As you can see in the “reddish triangle,” prices have been continually compressed into an ever smaller trading range. This “compression” is akin to coiling a spring. The more tightly the spring is wound, the more energy it has when it is released.
More importantly, these “compressions” can not go on indefinitely and will resolve themselves. It is a binary outcome. Currently, we have now reached the point where we will likely see a “conclusion” within the next several days to a couple of weeks at the most. So, exactly what does that mean?
When these compressions normally occur in a rising market trend, they historically resolve themselves to the upside. However, as discussed in a moment, there are many factors at work currently which makes “betting” on a positive outcome substantially riskier.
The chart below shows the total expected range, based on the initial decline, of a breakout of the consolidation range. As I discussed this past weekend, I am using a “weekly chart” to smooth out daily volatility which means the next update on the chart will be in this coming weekend’s newsletter.

If the market can break back above the current downtrend from the previous highs, a push to the top of the longer-term overhead bullish trend line is quite logical. That line has served as the peak of the current advance since the conclusion of the correction in early 2016.
A break downward, however, has substantially different connotations. Such a break will likely see the broader market step back to the 2400 level. Such a decline will definitely change the current “tone” of the market toward a more negative bias. If a breakdown does occur, the risk of being more aggressively invested in equities rises markedly.
I continue to “hope” for a more bullish conclusion to this corrective process. We remain invested in equities currently, although we are holding more cash than normal, and a more positive development would allow us to move equity exposure back towards full allocations.
As stated above, while we “hope” for a more bullish outcome, we will “wait” for it to occur before committing more capital towards “risk.”
Remember, “risk” is how much you lose when you are “wrong.” Waiting for the market to “tell us” where it is going next reduces that risk substantially.
We’ve Seen These Before
The rally on Friday and Monday, while certainly encouraging, has been little more than a short-covering, oversold, bounce currently. As noted above, the intermediate-term signals have been little changed as of yet and we have seen these rallies before.
During a corrective process, it is not uncommon to see sharp, reflexive rallies. Also, after two particularly rough months of trading, it would not be surprising to see a month of more positive price action. This is why we continue to give pathways #3a and #3b the most weight currently as noted in the first chart above.
On a longer-term basis, we remain focused on the potential triggering of our longer-term sell-signal. As shown below, these signals are rare and have previously coincided with more serious declines than what we have seen to date. Again, as stated above, the long-term weekly moving average (green line)current intersects at 2400.
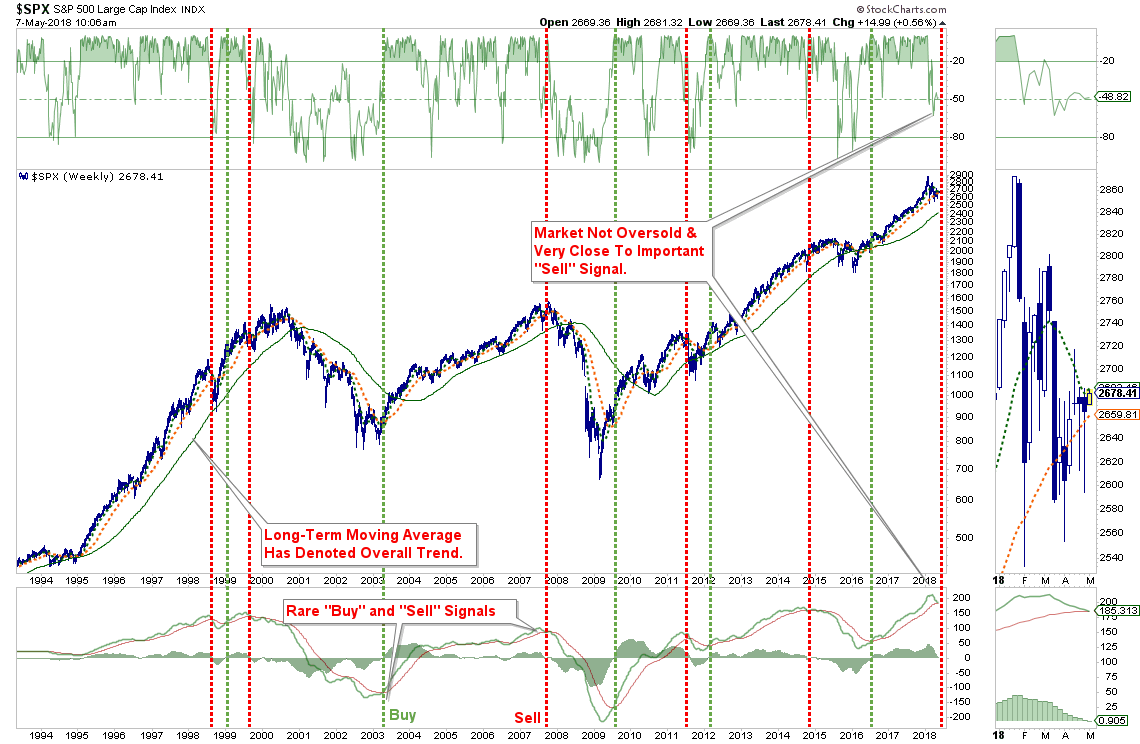
More importantly, when long-term indicators turn lower, they tend to precede longer-term correction processes. We previously addressed the massive overbought condition represented by the monthly relative strength index. As shown below, it is not the rise in the RSI that becomes problematic for the market, but the decline. While the extreme extension of the RSI index has begun to decline, it still has a much more to fall before returning back to levels more normally associated with bull market advances. Also, notice that RSI has previously peaked and began to decline several months prior to the onset of a more important corrective period or outright bear market.

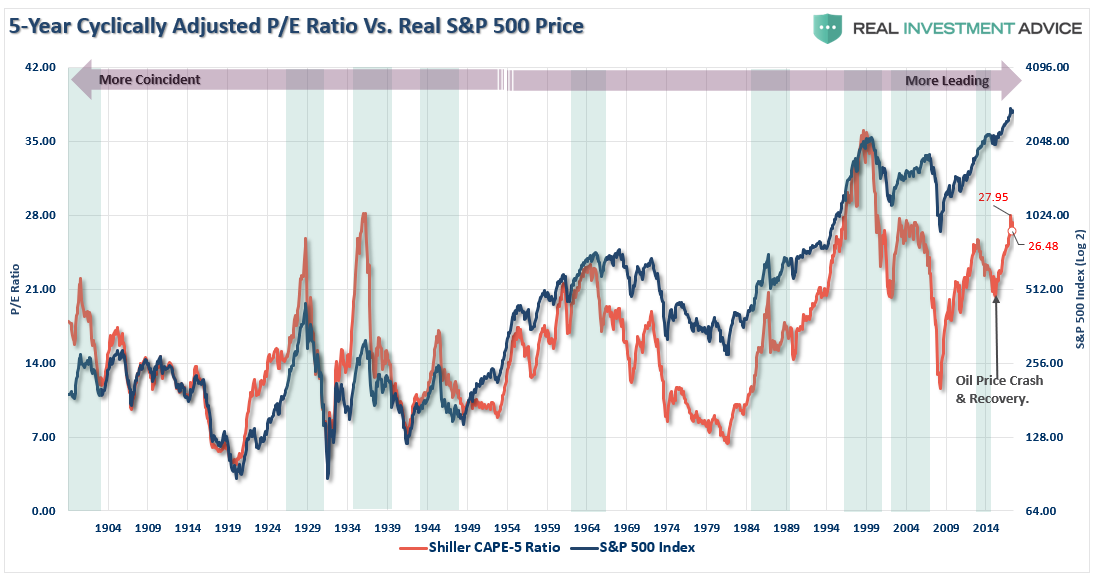
Valuations also have begun to decline which tends to lead more important corrective market actions. This is particularly something to watch as we have likely reached peak earnings for this current cycle. (Year-over-year comparisons will begin to become much more problematic as we head into 2019.)
The chart below is a cyclically-adjusted price to earnings ratio based on a 5-year average of reported earnings. It is a bit more sensitive to market turns than use a 10-year average. (Read this)
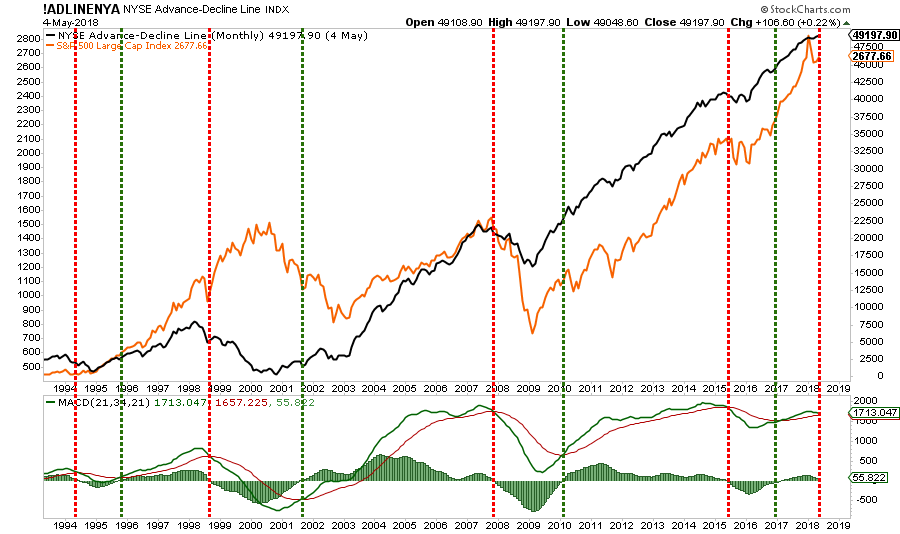
The monthly advance-decline line has also started to flatten out and is close to registering a monthly “sell” signal. Again, as with all monthly signals, changes occur on a significantly slower basis and are much more important to pay attention to. Importantly, these signals are only updated AFTER the close of each monthly period so a very sharp rally between now and the end of the month could keep the signal from triggering. It is just something we are paying very close attention to currently.
Lastly, despite the recent corrective process, investors still remain primarily allocated to equities as shown by the Rydex allocation measures below. With the market below its bullish trendline from the 2016 lows, Rydex Bear and Cash allocations remain at low levels while bullish allocations have not fallen much from their recent highs.

If the market does break down out of the current consolidation process, the decline could well be fueled by a sudden shift out of long-asset exposure. In other words, investors haven’t “panicked” yet.
While “everyone loves a good bullish thesis,” the reality is that several changes are occurring simultaneously that have chipped away at the markets previous pillars of support:
- The Fed is raising interest rates and reducing their balance sheet.
- The yield curve continues to flatten and risks inverting.
- Credit growth continues to slow suggesting weaker consumption and leads recessions
- The ECB has started tapering its QE program.
- Global growth is showing signs of stalling.
- Domestic growth has weakened.
- While EPS growth has been strong, year-over-year comparisons will become challenging.
- Rising energy prices are a tax on consumption
- Rising interest rates are beginning to challenge the valuation story.
While there have been several significant corrective actions since the 2009 low, this is the first correction process where liquidity is being reduced by the Central Banks.
The current correction process is coming to an end, and soon. The only question is simply which way it breaks?
My suspicion is that even if the market breaks out to the upside, the advance may be somewhat limited as investors remain way too “complacent” currently.
Lance Roberts

Lance Roberts is a Chief Portfolio Strategist/Economist for Clarity Financial. He is also the host of “The Lance Roberts Show” and Chief Editor of the “Real Investment Advice” website and author of “Real Investment Daily” blog and “Real Investment Report“. Follow Lance on Facebook, Twitter and Linked-In
At the 2018 World Outlook Financial Conference Paul Beattie shared his top picks for 2018. We are very pleased to be able to bring this video out from behind our pay wall for everyone to watch for free. CLICK TO ACCESS


-
I know Mike is a very solid investor and respect his opinions very much. So if he says pay attention to this or that - I will.
~ Dale G.
-
I've started managing my own investments so view Michael's site as a one-stop shop from which to get information and perspectives.
~ Dave E.
-
Michael offers easy reading, honest, common sense information that anyone can use in a practical manner.
~ der_al.
-
A sane voice in a scrambled investment world.
~ Ed R.
Inside Edge Pro Contributors

Greg Weldon

Josef Schachter

Tyler Bollhorn

Ryan Irvine

Paul Beattie

Martin Straith

Patrick Ceresna

Mark Leibovit

James Thorne

Victor Adair