Timing & trends

The Individual Investor Has Left The Building

sell-high-go-short

It took a long time before individual retail investors were even mildly bullish before the big drop, but now they are “flat out BEARISH”. Since every major turn down into a bear market has been precededed by a long period of increasing optimism ultimately ending in euphoria, it was unusual as this analyst points out that just before the recent drop from the January 26th 2018 high, the “little guy’s”were just beginning to become optimistic. Not eurphoric, but getting “comfortable” as explained below. Perhaps now they are virtually absent as they were when this chart below appeared in 2017: – R. Zurrer for Money Talks

retailpart-1


Individual Investors Bail

2018 hasn’t been the year for the little guy.  Late last year, individual investors appeared to be finally getting comfortable with stocks as bullish sentiment in the weekly poll from AAII topped 50% for the first time in nearly three years.  For a little while, they enjoyed the ride as equities surged to start the year and bullish sentiment reached just shy of 60%.  Then the correction came.  Since then, the bulls have been in steady retreat as increased volatility and lower prices remind these individuals why they were so apprehensive in the first place.  This week provided a further confirmation of that trend as bullish sentiment in the weekly AAII poll dropped from 31.9% down to 26.09%.  This marked the fourth straight week of declining bullish sentiment and took the percentage of bulls to the lowest level since last August.


041218-AAII-Bullish-Sentiment


 Charts courtesy of Bespoke – Save 30% By Starting a Bespoke Research Trial Now!

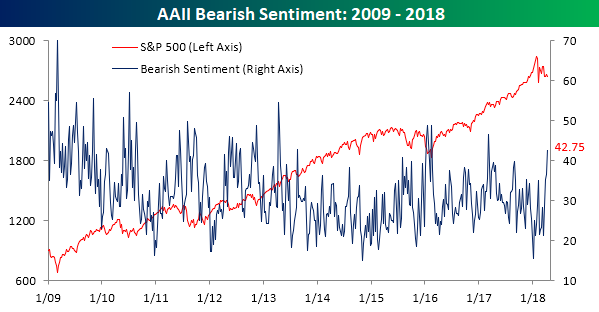
The investors leaving the bullish camp recently aren’t just moving to the neutral sidelines either.  They are flat out bearish.  In this week’s survey, bearish sentiment surged from 36.6% up to 42.75%.  Bearish sentiment has now increased by more than 20 percentage points in the last four weeks and is at its highest level since last March.


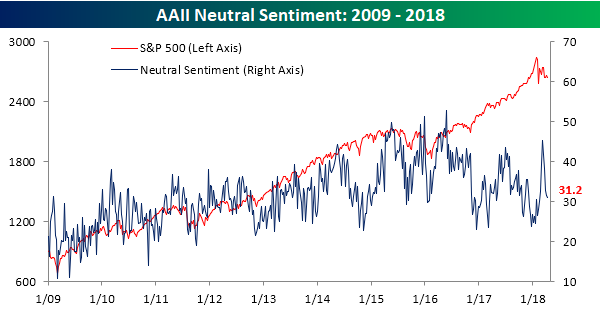
Fence sitters have plummetted in recent weeks as well, so it’s not as though investors don’t have conviction.  After hitting a recent high of over 45% in early March, neutral sentiment is now down to 31.2%.


Now Is a Great Time to Buy the Dip

During the recent wild volatility this analyst has used a method to stay out of trouble & keep on the right side of the huge swings. This tool now foresees a great opportunity as he explains below – R. Zurrer for Money Talks

On March 9, I cautioned you that we were about to enter a period of prolonged volatility

And that’s exactly what we saw.

The S&P 500 Index has plunged as much as 8% since that day, and the volatility in the market is nerve-racking.

A 1% move in the broad market now takes just hours, compared to what would have taken days to amass during all of last year.

But just as my chart of moving averages showed this was coming, it is also showing that the end of this slump in the market is near, and now is a great time to jump in.

Take a look:

cotd-13-final

In the chart, the red line is a simple 200-day moving average, an average almost all traders follow.

The green line is the 50-day moving average, and the yellow line is the 50-day moving average offset by 25 days.

The blue line is my forward indicator for the yellow line, because the data continues to change until it is 25 days old. At that point, it is our 50-day moving average offset by 25 days (the yellow line).

This yellow line is the key one, but the blue line is our indicator for where it is headed.

And just as it showed it was about to cross below the green line a month ago (which was bearish), it now shows that it is set to climb back above the green line — a bullish move.

This is why jumping in now is a great time to buy the dip.

I know, it may seem nerve-racking to enter with such volatility, but start small.

Buy some stocks to benefit from the quick rally, but keep some cash on the side due to the volatility that you can put to work once the market has turned the corner and is officially out of the stock market correction.

Regards,

Chad Shoop, CMT

Editor, Automatic Profits Alert

Stocks Enter Period of Seasonal Strength This Week

Timing is everything, and seasonality is a great tool to use to help get your timing right. A strong seasonal period began with Stocks in General on April 11th, and is currently powering the Energy Sector higher. This report covers the Markets, individual stocks and Energy. – R. Zurrer for Money Talks

SPGI


Seasonal Chart Analysis

Analysis of the S&P Global Inc. (NYSE:SPGI) seasonal charts above shows that a Buy Date of October 5 and a Sell Date of December 29 has resulted in a geometric average return of 2.39% above the benchmark rate of the S&P 500 Total Return Index over the past 20 years. This seasonal timeframe has shown positive results compared to the benchmark in 17 of those periods. This is a very good rate of success, but the return underperforms the relative buy-and-hold performance of the stock over the past 20 years by an average of 3.5% per year.

The seasonal timeframe is Inline with the period of seasonal strength for the Financial sector, which runs from November 22 to April 13. The seasonal chart for the broad sector is available via the following link: Financial Sector Seasonal Chart.

The Markets

Stocks jumped on Tuesday as investors reacted to a speech from Chinese President Xi Jinping, who discussed plans to to open up the country’s economy.  The S&P 500 Index surged by 1.67%, testing, once again, the declining 20-day moving average.  The benchmark has been gyrating between resistance at this short-term moving average and support at the 200-day moving average for the past three weeks, charting large intraday swings as investors attempt to find a level of comfort amongst equity prices.  The more formidable level of resistance to watch is the gap around 2700, which is now intersecting with the declining 50-day moving average.  Significant negative reaction to this hurdle would increase the likelihood of a break of horizontal support below around 2575.  A bullish MACD crossover was triggered during Tuesday’s session, presenting some hope that the next move on the benchmark is higher, barring some catalyst that destabilizes markets, yet again.

image

Topping the leaderboard on Tuesday was the energy sector as commodity prices moved higher following the Chinese President’s remarks.  The S&P 500 Energy Sector index broke out from its intermediate consolidation range, as well as advanced beyond significant moving averages in the process.  The energy benchmark has significantly outperformed the market for the past three weeks, benefitting from the strength in the price of oil, which remains around multi-year highs.  Strong demand for product commodities and a return to normal levels for stockpiles of the raw input have been a significant influence.  Seasonally, the price of oil and the stocks of the companies that produce it tend to gain through the start of May.  We’ll obtain further insight as to the state of the oil market when the EIA releases their official tally on Wednesday.

image

Energy Sector Seasonal Chart

ENERGY Relative to the S&P 500 

ENERGY Relative to the S&P 500

ENERGY Monthly Averages


….if you want more analysis on the economic front continue reading HERE

Todd Market Forecast: Impressive Breadth & Hot Techs

Fear of War, both Trade and Missiles drove all 3 Stock Indexes down yesterday. Despite the hammering, there were actually more NYSE issues up than down, an unusual event. Mr. Todd thinks something is going to happen missle wise, but doubts that “it will effect markets all that much” – R. Zurrer For Money Talks

Wednesday April 11, 2018. 3:00 Pacific

DOW – 219 on 4 net advances

NASDAQ COMP – 25 on 72 net declines

SHORT TERM TREND Bullish

INTERMEDIATE TERM Bullish

STOCKS: Today was all about the prospect of military conflict in the Middle East. Russia issued threats and President Trump issued counter threats. It does look something is about to happen, but I doubt that it will affect the markets all that much.

Today also looked like a bit of reaction and profit taking to yesterdays gonzo move.

We were impressed by breadth. It isn’t often that we see a 200 point Dow drop with more advances than declines. 

GOLD: Gold gained $11. We still haven’t closed above the late March peak which constitutes resistance.

CHART: The QQQ is the ETF for the NASDAQ 100 and it has a tendency to be market leader. I am impressed that after a March decline, it is now making a series of ascending highs and ascending lows. 

toddm

www.toddmarketforecast.com

BOTTOM LINE: (Trading)


Our intermediate term system is back on a buy.

System 7 We’re currently in cash. If the S&P 500 is positive on Thursday with 5 minutes to go in the session, buy the SSO at the close. 

System 9 Currently neutral 

NEWS AND FUNDAMENTALS: The CPI was down 0.1%, lower than the expected unchanged reading. Oil inventories rose 3.3 million barrels. Last week they declined 4.6 million. 

INTERESTING STUFF: Nothing is more difficult, and therefore more precious, than to be able to decide. ——-Napoleon Bonaparte 

TORONTO EXCHANGE: Toronto was down 4. 

BONDS: Bonds were higher. 

THE REST: The dollar stopped going down. Crude oil was higher and moved above the resistance zone which was the previous peak in late March. 

Bonds –Bearish as of April 3.

U.S. dollar – Bearish as of April 9.

Euro — Bullish as of April 9.

Gold —-Bearish as of March 27.

Silver—- Bearish as of March 27.

Crude oil —-Change to bullish as of April 11 .

Toronto Stock Exchange—-Bullish as of Feb. 12.

We are on a long term buy signal for the markets of the U.S., Canada, Britain, Germany and France.

toddp

Monetary conditions (+2 means the Fed is actively dropping rates; +1 means a bias toward easing. 0 means neutral, -1 means a bias toward tightening, -2 means actively raising rates). RSI (30 or below is oversold, 80 or above is overbought). McClellan Oscillator ( minus 100 is oversold. Plus 100 is overbought). Composite Gauge (5 or below is negative, 13 or above is positive). Composite Gauge five day m.a. (8.0 or below is overbought. 12.0 or above is oversold). CBOE Put Call Ratio ( .80 or below is a negative. 1.00 or above is a positive). Volatility Index, VIX (low teens bearish, high twenties bullish), VIX % single day change. + 5 or greater bullish. -5 or less, bearish. VIX % change 5 day m.a. +3.0 or above bullish, -3.0 or below, bearish. Advances minus declines three day m.a.( +500 is bearish. – 500 is bullish). Supply Demand 5 day m.a. (.45 or below is a positive. .80 or above is a negative). Trading Index (TRIN) 1.40 or above bullish. No level for bearish. 

  No guarantees are made. Traders can and do lose money. The publisher may take positions in recommended securities.

Gold Tests Resistance – Again

Gold is rattling against $1367 resistance as Donald Trump tweeted early this morning “Russia vows to shoot down any and all missiles fired at Syria. Get ready Russia, because they will be coming, nice and new and “smart!”.  Two takes below, one a wait and see, the other by an analyst who wrote yesterday before all of these Syrian missle tweets and Gold’s rise that “The Time is Now” for Gold to make a move. So far they are both right, but if Gold should break through this resistance at $1365 barrier the latter could be significantly more right – R. Zurrer for Money Talks

Gold Tests Resistance – Again

Just when everyone was getting used to gold sitting around and doing nothing while tech stocks provided non-stop thrills and chills, the metal took off this morning on the “news” (read “Tweet”) that Trump is aiming some cruise missiles at Syria. 

Now the $1,360 resistance level that has been an absolute brick wall since 2014 is looming once again, and gold-bugs are – once again – wondering where the next resistance lurks if this level is finally pierced. 


Gold-resistance-April-18

The correct answer is that the chart doesn’t (or at least shouldn’t) matter in a world where Russia might soon be trying to shoot down US cruise missiles, Chinese and US aircraft carriers are staking competing claims to the South China Sea and trillion-dollar deficits are explicit and unapologetic government policy. 

But until fundamentals retake control and precious metals start acting like bitcoin circa 2017, charts like this one are a fun diversion.

Gold Market Nirvana: The Time Is Now

Apr 10, 2018

  1. The main drivers of global stock, bond, and gold markets are interest rates and demographics. Unfortunately, most investors focus on items that get a lot of media attention but are almost irrelevant to price discovery in the markets.
  2. Please  click here now. I’ve predicted that there will be no trade war, but governments around the world will roll out a modest amount of mildly inflationary tariff taxes.
  3. Clearly, top economists at both Fitch and Goldman have the same outlook that I do. Moderate tariffs are getting a lot of flashy media coverage, but what really matters to the major markets is Fed policy, US citizen demographics, and Chindian citizen demographics.
  4. Some tax cuts have now been passed in America. Yellen and most democrats call them “ill-timed stimulus”. Most republicans appear to believe the tax cuts are well-timed stimulus that combined with deregulation could create tremendous GDP growth, using ridiculous demographics to do it. Throughout world history, this type of thinking has been typical in the late stages of ruling empires. 
  5. Libertarians believe there is no bad time to do a tax cut because tax cuts are about the restoration of citizen freedom and morality rather than economic stimulus. They believe these tax cuts must be accelerated until the income and capital gains taxes are eliminated. 
  6. The libertarians believe the US government resembles a mafia extortionist operation more than a government. Are they correct?
  7. Well, probably. I don’t think most republicans or democrats really want to face the reality of what governments around the world have become, and nor do the governments themselves. 
  8. Regardless, with the Fed engaging in significant QT and a rate hiking cycle, the ability of the US government to finance itself is about to come under stress that is unprecedented in America’s history. Sanctions and tariffs are irrelevant to this stress. QT, rate hikes, and demographics are of epic relevance.
  9. Please  click here now. Double-click to enlarge. I don’t think it’s wise to try to pick an exact top in the US bull market for stocks, but it’s very wise to understand that QT and rate hikes are creating the “beginning of the end” for this market. 
  10. In 1980 the Fed began a 35-year rate cutting cycle with the baby boomers entering their prime working and investing years. Tax cuts from Reagan increased the government debt, but the demographics of the baby boomers and the Fed’s massive rate cuts made the government’s debt problem a minor issue.
  11. Today, the Fed is engaging in a tightening cycle and the baby boomers are pensioners. The millennials don’t trust banks or government. Elderly savers are destroyed and generally soaked in debt. Tax cuts are morally correct, but they are turning the US government’s debt problem into an epic nightmare. Trump has more cuts planned, and rightly so. These cuts are going to ramp up the government’s debt nightmare, and from a libertarian gold enthusiast’s “end the extortionist insanity” perspective, that’s fantastic. 
  12. The bottom line: More stimulus is coming from the US government, and more tightening is coming from the Fed. This is what is known as “gold market nirvana”. Trump will soon announce infrastructure spending stimulus, and do so as Powell announces more rate hikes and accelerated QT. This will crush the bond market and unleash the inflation genie from her bottle.
  13. Western stock and bond markets are going to enter a period of massive volatility and then collapse. Gold is going to continue to rise steadily and then go ballistic as that happens. 
  14. Millions of Chinese gold market gamblers that bought physical bullion at $1450 – $1320 in 2013 are being “made whole” as gold moves steadily higher now. The world’s largest gold gambler class is poised to begin a new phase of aggressive buying once gold trades at $1450. 
  15. India’s “Gold Board” will soon be launched, which will likely have the power to decide the import duty. In Dubai, talks are underway between gold jewellers and the government to streamline the VAT.
  16. On the supply front, mine supply is poised to decline overall and in most countries except Canada and Russia. I’ve described the emergence of a “gold bull era” based on events in both the West and the East, and any gold market investor reading even a portion of what I’ve written here today can only come to the same conclusion.
  17. Please  click here now. Double-click to enlarge this key daily gold chart. Gold is poised in what I call a “golden coil” formation, and there’s a miniature bull wedge in play as well. It’s unknown whether gold drifts down one more time within the coil or just blasts above $1370 now. What is known is that the upside blast is coming. Fed tightening, Chindian buying, and US government stimulus are going to make it happen.
  18. Please  click here now. Double-click to enlarge this T-bond chart. The next big theme that US institutional money managers are going to face is the end of the bull market in bonds.
  19. For 35 years, investors’ stock market meltdowns have been buffered by bond market rallies. In early 2018, that changed. The bond market barely rallied on stock market crash days, and fell on some of them. It has not reached the panic stage for money managers, but they are getting concerned.
  20. Not since Paul Volker ruled the Fed has a Fed chair been as forceful about tightening as Powell. Last week, with the Dow down 700 points, he gave a speech to the media stating that more rate hikes were coming. A lot of money managers think he is bluffing. They don’t believe he will hike relentlessly or keep ramping up QT if the stock market falls.
  21. These money managers are greatly mistaken, and as more rate hikes, QT, and fiscal stimulus turn their supposed safe haven of T-bonds into flaming rice paper, they will turn to gold. It’s already starting. GLD-NYSE has seen tonnage rise to 859 tons during the latest stock market gyrations. The bond bull market is dead, and fiscal stimulus and Fed tightening are going to pressure the dollar as well as the stock and bond markets, leaving gold as the only safe haven for investors.
  22. Please  click here now. One of my largest gold stock holdings is of course Chow Tai Fook, China’s biggest gold jewellery retailer. I cover the action at my  www.gracelandjuniors.com website. This chart tells the story of Chindian demand for gold. Chinese gamblers don’t gamble much on paper gold markets. They buy gold bullion and jewellery to get in on the upside price action. 
  23. This stock is a key leading indicator for Western gold miners. On that note, please  click here now. Double-click to enlarge this interesting GDX chart. I’ve coined the term “Safehavenization of Gold Stocks”  to describe the rise of institutional money manager interest in gold stocks as an actual safe haven from the coming implosion of US government, debt, and stock markets. 
  24. The volume pattern is positive for GDX and most gold stocks, but what’s most interesting is that a price rally of just a few dollars a share represents almost a ten percent gain. For institutional money managers facing the hurricane winds created by fiscal stimulus and Fed tightening in stock and bond markets, gold stocks are becoming an ever-more enticing opportunity for both shelter and gain. Gold investors around the world should be totally comfortable buying various gold stocks on all two and three-day pullbacks. Sell a portion of what is bought on rallies, and hold the rest to enjoy the biggest rewards offered in the glory of the gold bull era!

Thanks! 

Cheers
st

Apr 10, 2018
Stewart Thomson  
Graceland Updates
website: www.gracelandupdates.com