
Energy & Commodities
One quick look at the long term Uranium price chart below highlights Uranium is a very long way from its high in 2007, and it certainly isn’t trending upward. That said, this analyst has found that Uranium stocks are bucking the Uranium metal trend significanly, and are rising from a very sold out low. That, this analyst believes, means “we’re looking at a big, cyclical move in uranium prices” – R. Zurrer for Money Talks

The White-Hot Metal
Have you noticed what’s happening in uranium lately? Not the metal, which continues to snooze. The miners. They are ramping up. Take a look at this chart …

Why is This Happening?
On the demand side …
Global nuclear capacity is ramping up. In fact, it should double to at least 58 gigawatts by 2020-’21, then up to 150 gigawatts by 2030, and much more by 2050. That’s according to a new research report by the World Nuclear Association.
The same report says that China — which has 36 nuclear power reactors in operation — is building 21 new atomic power plants. They’ll all need to be fueled up. Nuclear plants take three times as much uranium at start-up as they normally use in a year.
Japan shut down all its atomic reactors after the Fukushima earthquake/tidal wave caused three of them to melt down. That country recently started bringing its nuclear plants back online. It’s preparing for the eighth restart right now … out of 43.
This is important because one of the things suppressing the uranium price was Japan selling its nuclear stockpiles from shut-down plants into the market. Now, it will have to stock up again.
On the supply side …
Kazakhstan, the world’s biggest uranium producer, has cut its uranium production twice in the last year.
Then Cameco (CCJ), the biggest producing company in the West, suspended production at its McArthur River Mine in Canada. That all adds up to 17,762 metric tons per year of supply taken off the market.
And just recently, the Department of Energy suspended its practice of selling excess uranium. That amounts to 2,100 metric tons per year.
There’s a lot more to the story. But you get the gist of it. We are seeing a good ol’-fashioned supply/demand squeeze in the glow-in-the-dark metal.
The price of uranium has been depressed for years. But last year, the price went up. By 17%. That’s not much, but it’s the first time that uranium prices have gone higher in years.
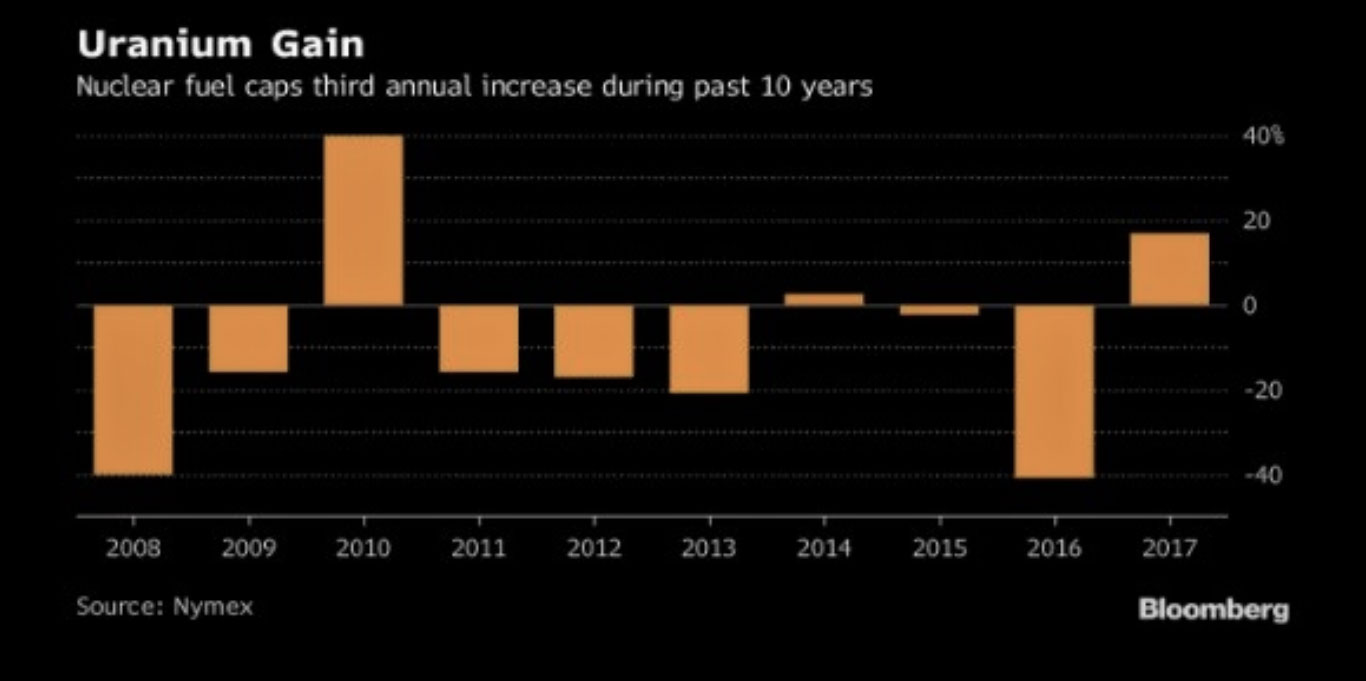 |
That’s nice. But you know what? Prices are still 67% below the 2011 peak!
You can see why I believe uranium might be at a tipping point. I believe we’re looking at a big, cyclical move in uranium prices. And it could be a melt-up, rather than a melt-down.
I’ve been around long enough that I’ve seen this before. In 2006-2007, my subscribers made one big profit after another on uranium stocks. Bam! Bam! Bam!
I just gave my Wealth Supercycle subscribers a new uranium report. It’s chock full of picks, too.
If you want your own copy of the report, click here.
The next big up-cycle in uranium is coming. You want to be onboard for it. My subscribers made a heck of a lot of money the last time this happened. This time could be even bigger.
All the best,
Sean


A UGM-109 Tomahawk missile detonating above a test target in 1986 –
President Donald Trump threw down the gauntlet Wednesday morning by telling Russia to prepare for a US missile strike on Syria in response to a suspected chemical weapons attack blamed on the Syrian government. According to Martin Armstrong long as the Dow doesn’t close below 23509.06 this will just be another opportunity to buy stocks at a lower price during a panic – R. Zurrer for Money Talks
- A Russian diplomat had previously threatened to shoot down US missiles, and the platforms firing them, if the US attacked Syria.
- But the Kremlin has urged caution, trying to talk the US down from a strike on Syria.
“Russia vows to shoot down any and all missiles fired at Syria. Get ready Russia, because they will be coming, nice and new and ‘smart!'” Trump tweeted. “You shouldn’t be partners with a Gas Killing Animal who kills his people and enjoys it!”
….also from MarketWatch@ 6:21am PST: Dow poised to drop more than 200 points as Syria, White House tensions simmer

There are several “Trade War” gaps down located quite a bit higher than where we are trading presently in the S&P 500 and Nasdaq 100. As a rule trade gaps ususally get filled before returnng to the trend in force. Especially likely in this anxious environment this analyst proposes. In short, should we fill those gaps as you can see on the charts below a very large rally will have to occur. R. Zurrer for Money Talks
SPX & NDX 60 MIN. CHARTS
Well, they got reversed in-day but I am still leaning toward a short-term scenario where the market at least tries to fill a Trade War hype gap or two. It may not be the ‘M’ top scenario but I feel like the last couple of weeks gave a would-be bounce some fuel with all the anxiety that got stirred up. But you’re right, the market does not give a shit what I feel like.
SPX has tested its daily SMA 200 and is still in a potential (60 min.) bounce pattern. A drop below 2590 puts that in peril.

NDX is still in its monthly, weekly and daily up trends and the 60 minute also has a pattern. Both of them are looking to fill their opening gaps. Still leaning toward a bounce to at least one of the upside gaps. I just don’t feel like I buy the bear at this moment. But my positioning is very balanced with longs, shorts, precious metals and a crap load of relatively* good yielding cash.

* Relative to that blight known as ZIRP that Bernanke put upon savers.
from Subscribe to NFTRH Premium for an in-depth weekly market report, interim updates and NFTRH+ chart and trade ideas; or the free eLetter for an introduction to our work.

 Politicians terrified of environmentalists and in favor of anti-business politicial philosophies consider that the $47 billion in government revenue that would have come from the Kinder Morgan pipeline just isn’t that important. Tell that to the people that were going to do the 800,000 man hours of work on the project – R. Zurrer for Money Talks
Kinder Morgan said it would halt nearly all work on a pipeline project that is crucial to the entire Canadian oil sands industry, representing a huge blow to Alberta’s efforts to move oil to market.
Kinder Morgan’s Trans Mountain Expansion is the largest, and one of the very few, pipeline projects that has a chance of reaching completion. Alberta’s oil sands producers have been desperate for new outlets to take their oil out of the country, and the decade-plus Keystone XL saga is the perfect illustration of the industry’s woes.
Keystone XL is still facing an uncertain future, and with several other major oil pipeline projects already shelved, there has been extra emphasis on the successful outcome of the Trans Mountain Expansion. That is exactly why Canada’s federal government, including Prime Minister Justin Trudeau, has gone to bat for the project.
But, despite federal approval, Trans Mountain still faces a variety of obstacles that have bedeviled the project for some time. It appears that opposition from First Nations, environmental groups, local communities affected by the route, and the provincial government in British Columbia have forced Kinder Morgan to throw in the towel, at least for now.
Kinder Morgan said on Sunday that it suspended most work on the $5.8 billion Trans Mountain Expansion.
Environmental groups hailed the announcement. “The writing is on the wall, and even Kinder Morgan can read it. Investors should note that the opposition to this project is strong, deep and gets bigger by the day,” said Mike Hudema, climate campaigner with Greenpeace Canada, according to Reuters. Related: Russia Wants To Drop Dollar For Oil Payments
Kinder Morgan’s CEO Steve Kean said the project would be scrapped unless the legal challenges could be resolved by May 31. The announcement sparked a sense of panic among various Canadian politicians. “We are determined to find a solution. With all our partners, we continue to consider all available options. As our Prime Minister has said, this pipeline will be built,” Canada’s Federal Natural Resources Minister Jim Carr said in a statement.
Alberta’s Premier Rachel Notley, not surprisingly, sounded more alarmed. She took to Twitter to not only lash out at British Columbia, but also vow that her province would push the pipeline, even if it meant taking a public stake in the project.
However, Kinder Morgan actually didn’t sound all that optimistic, despite heavy support from Ottawa and Alberta.
“We will be judicious in our use of shareholder funds. In keeping with that commitment, we have determined that in the current environment, we will not put KML shareholders at risk on the remaining project spend,” Kean said in a statement. Kinder Morgan Canada said the project faces “unquantifiable risk,” noting the threats made by the BC government to kill the project. The company had already spent over C$1 billion preparing the project but hadn’t yet commenced construction. The beginning of construction would mean spending would jump to $200 to $300 million per month, a level of spending that the company says is too risky given the uncertainty.
“The fact remains that a substantial portion of the Project must be constructed through British Columbia, and since the change in government in June 2017, that government has been clear and public in its intention to use ‘every tool in the toolbox’ to stop the Project,” Kinder Morgan Canada’s Keane said in a statement. “The uncertainty created by BC has not been resolved but instead has escalated into an inter-governmental dispute.”
Kinder Morgan Canada saw its share price fall by 10 percent on the news during midday trading on Monday. Related: Continuously Rising Energy Costs Will Cripple The Economy
“This is not good. I think the key point is it shows a lack of confidence in our political and regulatory system,” said Tim Pickering, president of Auspice Capital in Calgary, told Reuters.
Western Canada Select (WCS) has traded at a steep discount relative to WTI, at times widening to as much as $30 per barrel. With WCS prices wallowing in the mid-$30s per barrel, heavy oil producers are missing out on some C$30 to C$40 million per day in revenues, according to Reuters.
The pipeline is critical for Canada’s oil sands. The IEA has forecasted that Canadian oil production already began to exceed takeaway capacity last year, and the pipeline shortage could last for several more years even if Trans Mountain Expansion moves forward. But, if Trans Mountain is killed off, that would be nearly 600,000 bpd of capacity that won’t come online. That raises questions about when and if the bottleneck will ever be addressed. That threatens to prevent new capacity from coming online in the years ahead.
“If we cannot reach agreement by May 31st, it is difficult to conceive of any scenario in which we would proceed with the Project,” Kinder Morgan Canada said in a statement.
By Nick Cunningham of Oilprice.com
More Top Reads From Oilprice.com:
- Permian Bottleneck Could Impact Global Oil Markets
- Higher Oil Prices Boost Saudi Credit Rating
- Saudi Officials Worried About Oil’s Future
Ever critical for the value of investments in different currencies, the US Dollar is down again today for the third day in a row. Jack Crook’s forecast of the major currency pairs has been very accurate to date, and this analysis will tell you where you can expect the US Dollar, Euro, CDN Dollar, Japanese Yen Australian Dollar and the Great British Pound will be headed next. – R. Zurrer for Money Talks
US Dollar Index
Update: 8 April 2018/4:03 am ET
Price at update: 90.11
Wave Description: (i)|[v]|5 final thrust lower
Price Target: 87.27
Resistance: 90.98|92.40
Support: 89.82| 88.25
Forecast Negation: 92.98
Wave Analysis
Is Wave [iv]’s maddening triangle pattern finally complete? Did we see a near-term reversal pattern on Friday? We are working from the premise of yes and yes; and it is why we got long EUR/USD. Targeting down to at least 87.27 in Wave [v].

EUR/USD Daily
Update: 8 April 2018/4:03 pm ET
Price at update: 1.2281
Wave Description: (i)|[i]|5 impulse rally
Price Target: 1.2623
Resistance: 1.2623 1.2344
Support: 1.2476 1.2153
Forecast Negation: 1.1960
Wave Analysis
Working off the premise that wave [iv] complex triangle pattern is complete with the bullish engulfing reversal pattern on Friday. (Note last two recent bullish engulfing patterns spiked out short-term bottom—each followed by an approximate 300 pip bounce.) We have revised our price target to 1.2623 based on confluence extension of Wave [i] by 1.618 and Wave [v] equality with Wave [1]—both carry exactly to 1.2623 (our minimum target). There is scope to go higher: targets above 1.2623 are 1.2779; then 1.2876.

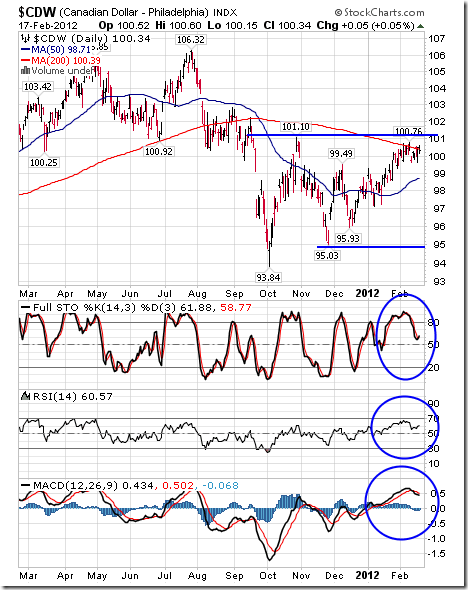
USD/CAD Daily
Update: 8 April 2018/4:03 pm ET
Price at update: 1.2769
Wave Description: B/(C)/[2] Zig Zag
Price Target: 1.2496 (then 1.3424)
Resistance: 1.2943|1.3128|0.7916
Support: 1.22729 | 1.2581|1.2445
Forecast Negation: 1.3124
Wave Analysis
Another zig zag pattern seems in play here- A-B-C targeting eventually to 1.3424 to complete major wave (C) of [2]. But in the meantime, we are expecting a push down to 1.2496-level in minor [c] to complete Wave B. Note the head and shoulders setup in this chart; the neckline was broken today and the price target of 1.2496 is based on the that pattern.
USD/JPY Daily
Update: 8 April 2018/4:03 pm ET
Price at update: 106.79
Wave Description: [iv]|5|(1) impulse rally
Price Target: 103.39
Resistance: 107.49/ 107.90
Support: 104.55|103.3 9
Forecast Negation: 110.83
Wave Analysis
We were thinking Wave [iv] of a narrowing triangle pattern was complete, but it seems there is more to go. But, this is a very complex correction to confidence on exactly how this plays out is murky still. Either way we do believe this move down targets to at least 103.39 in a final Wave [v] of 5 of (1); after that a multi-month rally should resume.

*Note, if you are interested in the Great British Pound and/or the Australian Dollar for the same analysis go HERE


-
I know Mike is a very solid investor and respect his opinions very much. So if he says pay attention to this or that - I will.
~ Dale G.
-
I've started managing my own investments so view Michael's site as a one-stop shop from which to get information and perspectives.
~ Dave E.
-
Michael offers easy reading, honest, common sense information that anyone can use in a practical manner.
~ der_al.
-
A sane voice in a scrambled investment world.
~ Ed R.
Inside Edge Pro Contributors

Greg Weldon

Josef Schachter

Tyler Bollhorn

Ryan Irvine

Paul Beattie

Martin Straith

Patrick Ceresna

Mark Leibovit

James Thorne

Victor Adair