
Currency
Despite fears a Trade War would dull the Dollars appeal, the dollar Index jumped again this morning. espite consistent headlines declaring the US dollar will fall because of the US China trade war. As you can see from the chart below, while the US dollar did fall though long before trade war worries became persistant, versus a basket of currencies in fact it has moved up over 1 percent since the end of January. The USD/CAD currency is also covered below – R. Zurrer for Money Talks
Note: Double click all charts for larger images
In yesterday’s Forex Trading Alert at 9:31am, we took a closer look at the current situation in the USD Index:
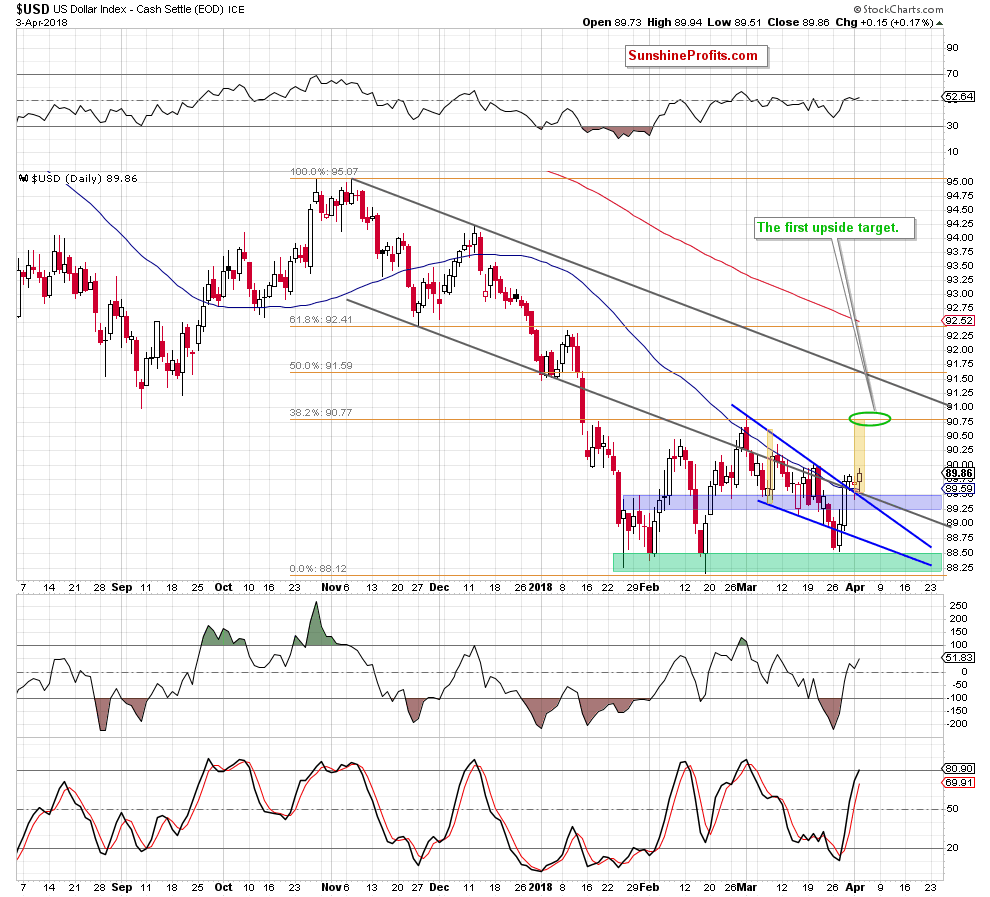
From the short-term point of view, we see that the greenback came back above two important resistance lines – the previously-broken lower border of the black declining trend channel and the upper line of he blue declining wedge.
Yesterday, the index verified this breakout, which together with the buy signals generated by the indicators suggest further improvement.
How high could the U.S. dollar go in the coming day(s)?
In our opinion, the first upside target will be around 90.77, where the 38.2% (Ed Note: at 6:24am PST April 5th the US dollar is up +0.24 at 90.36) Fibonacci retracement and the March peak are. Additionally, in this area the size of the upward move will correspond to the height of the rising wedge (we marked it with the green ellipse), which increases the probability of the pro-bullish scenario in near future.
If this is the case and the index climbs to our first upside target, we’ll also see a realization of the bearish scenario in the case of EUR/USD as the exchange rate will test the March low and our downside target at 1.2173.
USD/CAD Rewards Bears
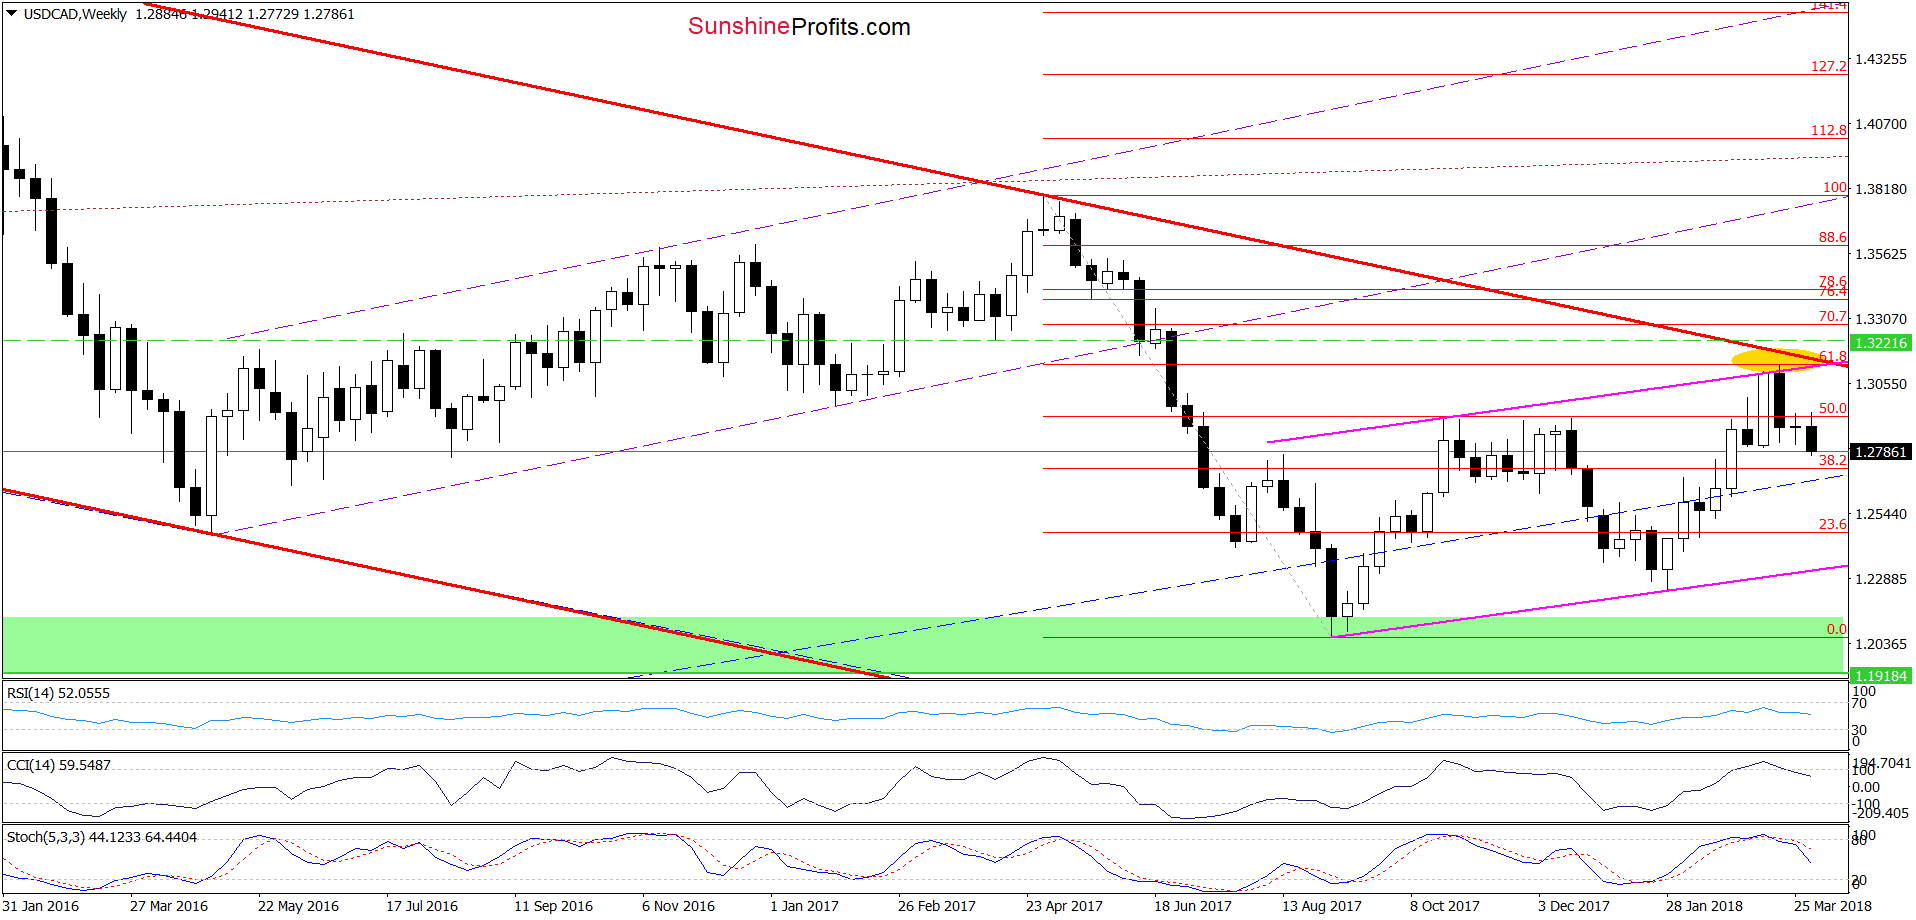
Looking at the medium-term chart, we see that although USD/CAD moved a bit higher earlier this week, currency bears took control quite quickly, which resulted in another move to the downside. Additionally, the sell signals generated by the weekly indicators remain in the cards, supporting currency bears and lower values of the exchange rate.
Are there any short-term factors that could thwart these plans?
Before we answer to this question, let’s recall the quote from our last commentary on this currency pair:
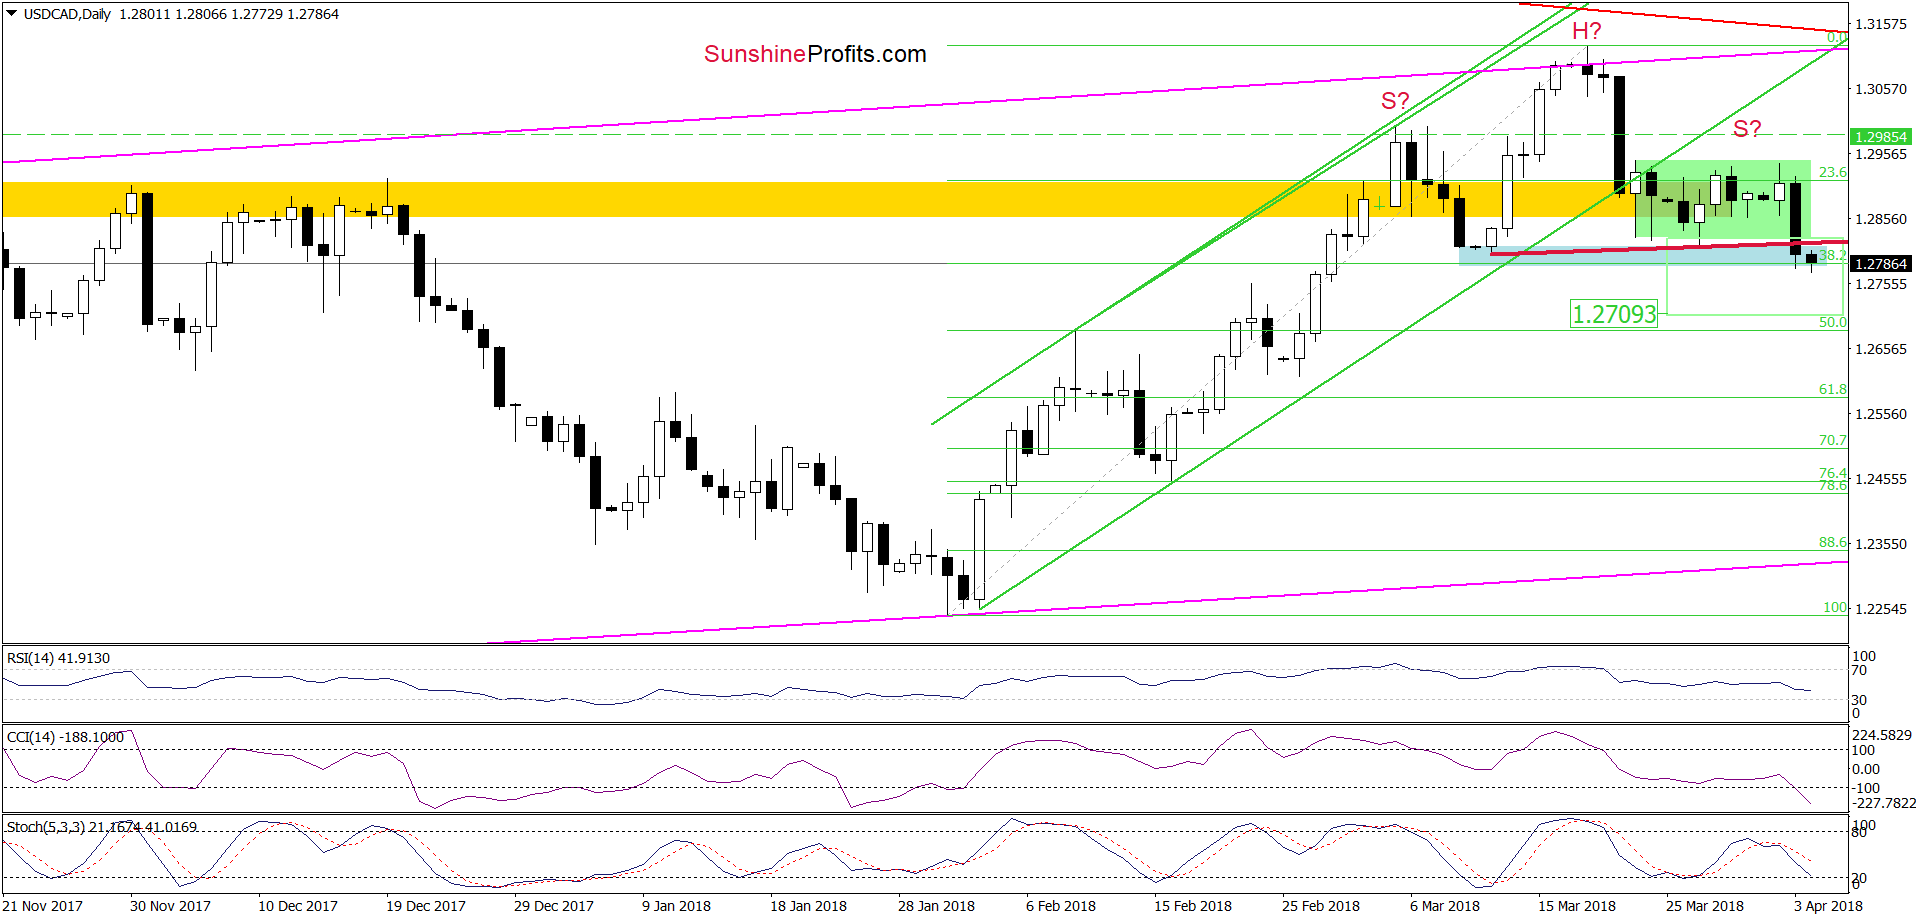
(…) although USD/CAD bounced off the blue support zone, the pair is still trading in the green consolidation around the yellow resistance zone and well below the previously-broken lower border of the green rising trend channel.
What does it mean for the exchange rate? In our opinion, as long as the pair remains under the upper border of the formation, another attempt to move lower is very likely.
If this is the case and USD/CAD extends losses from here, we’ll see (at least) a re-test of the blue support zone in the coming days, which will make our short positions even more profitable (as a reminder, we opened them on March 19, when USD/CAD was trading at around 1.3116).
As you see on the daily chart, the situation developed in tune with our assumptions and USD/CAD declined sharply after unsuccessful attempt to break above the upper border of the green consolidation. Thanks to yesterday’s downswing, the pair dropped under the lower line of this formation and reached our next downside target – the blue support zone and the 38.2% Fibonacci retracement.
Although this support area could trigger a rebound, the sell signals generated by the indicators remain in the cards, which together with yesterday’s breakdown suggest further deterioration and a drop to around 1.2709, where the size of the move will correspond to the height of the green consolidation.
And speaking about the bearish potential… Looking at the daily chart, you probably already noticed a potential head and shoulders formation. You’re right, the right arm of the pattern doesn’t look perfectly like in technical analysis books, but yesterday’s downswing took the exchange rate under the neck line of the formation, increasing the probability of a bigger move to the downside. Nevertheless, in our opinion, such price action will be more likely and reliable if USD/CAD falls below the blue support zone. In this case, the likelihood of a decline under the above-mentioned downside target will increase significantly.
So, how low could the exchange rate go if the situation develops in line with the pro-bearish scenario?
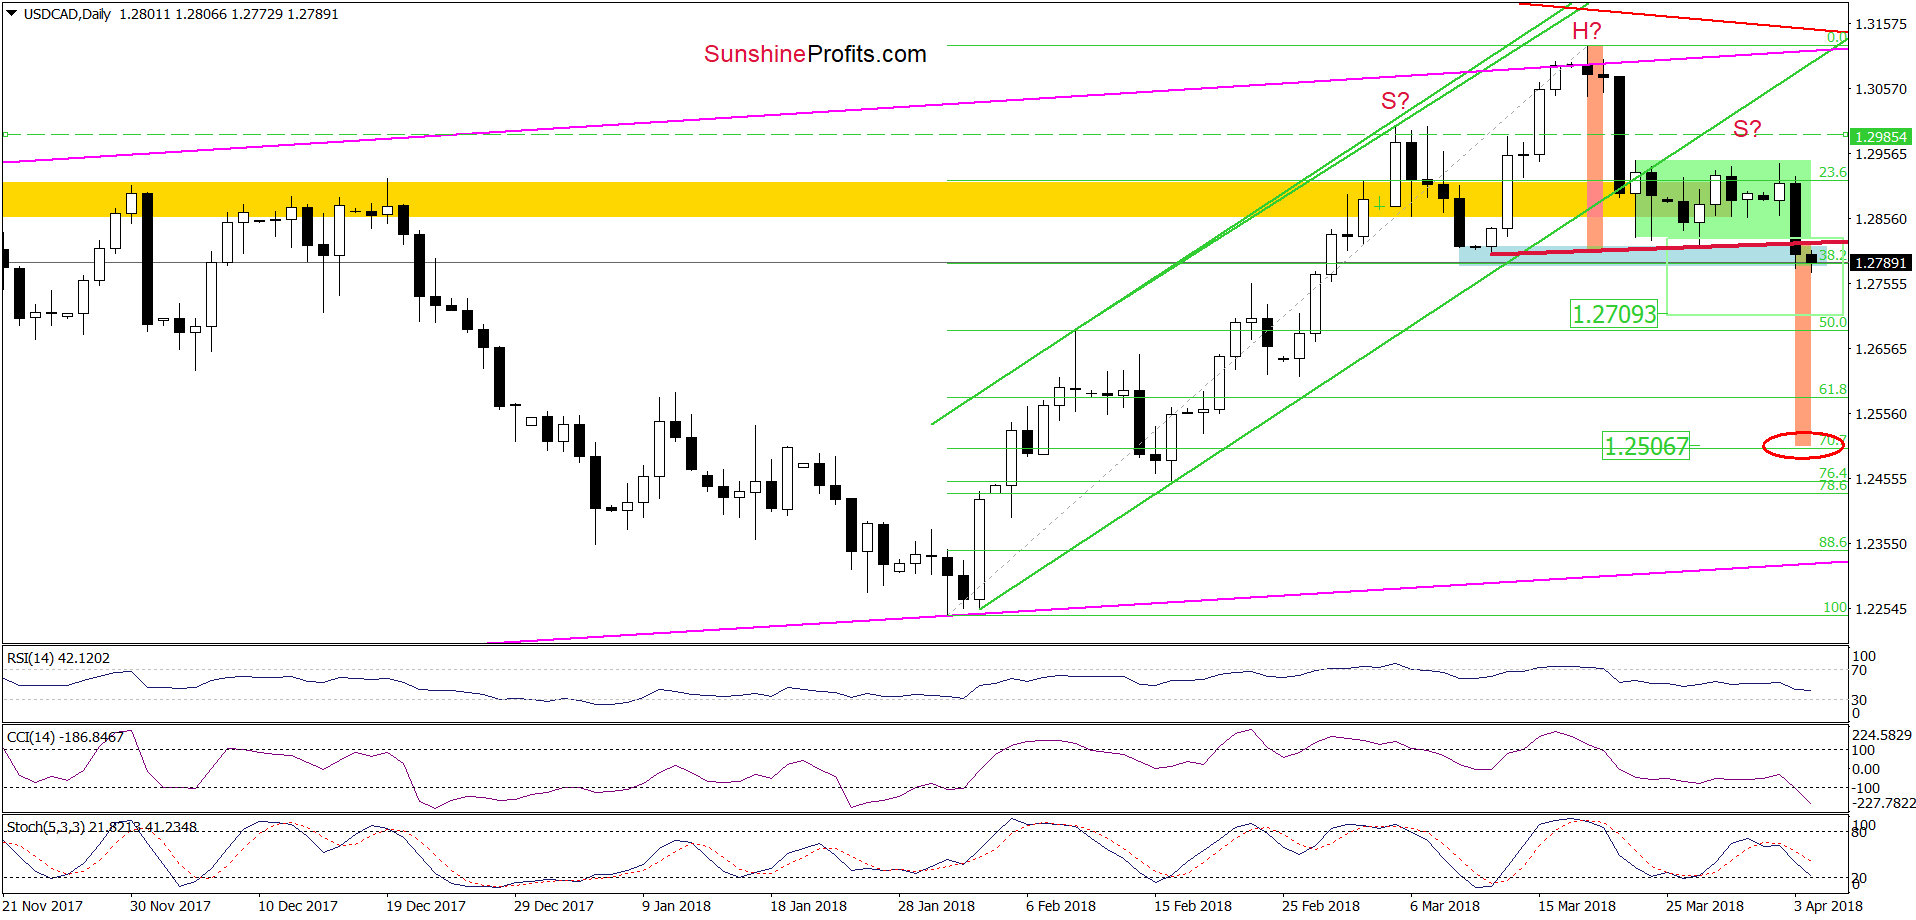
In our opinion, the next downside target will be around 1. 2506, where the size of the downward move will correspond to the height of the head and shoulders formation. Nevertheless, before we see the pair at this level, currency bears will have to break under 50% and 61.8% Fibonacci retracements first. Therefore, we will continue to monitor the market and keep our subscribers informed should we see a confirmation/invalidation of the above.

Tyler has chosen 3 instruments that go up when the market goes down. In case the long term trend line is broken these vehicles would be very profitable when we see another wave of strong selling pressure. Bottom line, you can make a lot of money in a brief period of time on declining prices by using these instruments – R. Zurrer for Money Talks
For many, this sounds like a bad thing but traders can embrace market weakness for a couple of reasons. First, there are numerous ETFs and ETNs that go up when the market goes down. Second, the market tends to take the stairs up and the elevator down. That means the profits come quickly if you are well positioned early in a correction.
Here are three vehicles to consider, and what to watch for, should the market break its long term upward trend line of support.
– Robert Zurrer for Money Talks
STRATEGY OF THE WEEK
In this week’s Market Minutes video https://youtu.be/KuVEfHab92E, I discuss how the market is threatening to break the long term upward trend line. While we don’t have that break down yet, it could happen soon and if it does, we could see another wave of strong selling pressure.
For many, this sounds like a bad thing but traders can embrace market weakness for a couple of reasons. First, there are numerous ETFs and ETNs that go up when the market goes down. Second, the market tends to take the stairs up and the elevator down. That means the profits come quickly if you are well positioned early in a correction.
Here are three vehicles to consider, and what to watch for, should the market break its long term upward trend line of support.
STOCKS THAT MEET THAT FEATURED STRATEGY
1. T.HXD
T.HXD is a leveraged and inverse fund to the TSX 60 index. If the Canadian market falls, this will go up. Since it is leveraged, it is a short term vehicle that suffers from value decay over time as it has to be rebalanced each day. A good way to take advantage of a quick correction but should not be held long if the trade is not working. Watch for it to break out through $6.60 with higher than normal volume.
2. VXX
The VXX’s value is based on the implied volatility of the S&P500 short term futures contracts. When markets correct, there is typically a sharp increase in volatility and that makes the VXX go up. The VXX is already elevated because volatility rose starting in February. If the long term upward trend line on the SPY is broken, volatility should go up some more. Watch the 3 year chart of the SPY for that break down.

3. SDS
SDS is an inverse and leveraged ETF for the S&P 500. If this benchmark index goes down 1%, the SDS should go up about 2%. Watch the SPY chart for a break of the trend line which should bring a breakout on the SDS through $43.50.

….also Tyler’s Market Newsletter:

![]()
In this week’s issue:
- Stockscores’ Market Minutes Video – Watch the Market Index
- Stockscores Trader Training – Be the Fussy Trader
Stockscores Market Minutes – Watch the Market Index
The trend of the market and whether it is oversold or overbought has an important effect on the movement of individual stocks. This week, I discuss how to assess the market factor, provide my weekly market analysis and look at the trade of the week on EEM.
Click here to watch on Youtube
To get instant updates when I upload a new video, subscribe to the Stockscores YouTube Channel
Trader Training – Be the Fussy Trader
Traders, particularly those who need to make money rather than those who would like to make money, tend to have a fear of missing out. They hear about a trading idea or find an opportunity with their own effort and make the trade with less thought than they might put into buying a microwave. They can invest thousands of dollars on an impulse, much like the drunken gambler who throws down $1000 on Five Red.
One reason for this sort of reckless approach to trading is the belief that trading ideas are like gifts. They only come along from time to time and you should feel grateful for the opportunity. If you spend 10 hours researching a company or receive the occasional bit of insight from someone who should know more than the rest of us, it’s easy to understand why you wouldn’t want to let a seemingly promising trade slip through your fingers. The problem is that this gratitude for trading ideas leads you to lower your standards and place trades that are not much more than a gamble.
Have you ever made a trade and then, just a few minutes or days later, asked yourself what the heck you were thinking? If you are normal, then it’s likely that you have because it is easy to focus on the dream of making a profit. You should focus your attention on the trading situation as it has been presented to you by the market rather than the words of an expert. Some trading opportunities are so well marketed that it’s hard to see the truth because you fixate on the profit potential that has been dangled before you as the prize.
It is critical to only take trades that meet the criteria of a strategy that you have found to have a positive expected value. Rather than look for a reason to take the trade, which is easy, look for a reason not to. Ask yourself, “If I buy this stock, who will be selling to me, and what does she know that I don’t know?” Looking at the other side of the argument will often highlight considerations that you have missed.
Being fussy is a lot easier when you recognize that the market-even a slow market-will give you opportunities. The markets have been pretty quiet this year but there are still stocks outperforming the market every day.
And if you can’t find a trade today, tomorrow or in the next week, eventually you will. There is always another bus coming down the road. If you miss one, just wait for the next.
I have found that you will actually make more money by trading less. If you maintain a very high standard for what trades you make, you will always pass on some trades that end up doing very well. By being selective, however, you will also avoid many marginal trades that would tie up your capital and then incur a loss. By being fussy and trading less, you end up taking only the very best trades and your results will be better overall.
It is easy to be fussy when the market is strong and there are lots of opportunities. It’s like fishing when every time you cast your line you get a bite. With that kind of success, you will quickly throw back any fish that is too small because you know there’s going to be something better coming along soon. You only take the best of the best.
When the fish stop biting and you spend hours with no bounty, you take the first fish that grabs your hook. It could be a tiny fish that you would never keep on even an average day, but with your desire to catch something, you keep it anyway. It would be better to have just not gone fishing at all.
You’ll do the same thing when trading a slow market. Eager to make a profit, you will take trades that show some potential even if they don’t meet all of your requirements. You will work hard to uncover a trade rather than wait for the obvious no-brainer trades that you take when the market is in a giving mood.
I like to say that in trading, when the going gets tough, the tough get lazy. You can’t control the market, so if the market is not giving you opportunities, it’s better to do nothing. Your hard work will not change what the market does.
This is hard for many people who have been programmed to relate hard work to success. If you try harder than the next person in a sport, you should get a better result. If you study harder for an exam, you should get a better mark. If you work longer hours at your job, you should make more money. In the stock market, if you work harder to find good trades, you will probably lose money.
The best trades are easy to find. Working hard to uncover something leads you to find questionable trades that you have to talk yourself into. It’s better to walk away when you have doubts.
This is not to say that hard work is not rewarded in trading. Traders who work hard at practicing their analytical skills or developing new strategies will be rewarded. People who devote their time and effort to improving their emotional control will be better traders. These are things that you can control and affect with hard work, but hard work won’t change what the stock market does.
Follow on Twitter | View Youtube Channel
If you wish to unsubscribe from the Stockscores Foundation newsletter or change the format of email you are receiving please login to your Stockscores account. Copyright Stockscores Analytics Corp.
References
- Get the Stockscore on any of over 20,000 North American stocks.
- Background on the theories used by Stockscores.
- Strategies that can help you find new opportunities.
- Scan the market using extensive filter criteria.
- Build a portfolio of stocks and view a slide show of their charts.
- See which sectors are leading the market, and their components.
Disclaimer
This is not an investment advisory, and should not be used to make investment decisions. Information in Stockscores Foundation is often opinionated and should be considered for information purposes only. No stock exchange anywhere has approved or disapproved of the information contained herein. There is no express or implied solicitation to buy or sell securities. The writers and editors of this newsletter may have positions in the stocks discussed above and may trade in the stocks mentioned. Don’t consider buying or selling any stock without conducting your own due diligence.
This monthly newsletter covers all major markets, Stocks, Bonds, Gold Canadian Markets and current market sentiment. This author is definitely worth reading. His hotline recommendations have yielded over 15% compounded since December 31, 2010. On his more conservative long term performance Stephen is ranked as one of only four services to have beaten the buy and hold over the past ten years – R. Zurrer for Money Talks
COMPLEX BOTTOMING PROCESS
It’s Monday morning. I’m putting the finishing touches on the April newsletter and the market is not looking very good. In fact, it’s getting mangled. It’s my belief that we’re putting in a trading bottom, but it’s very choppy right now.
Most of the technical gauges that we look at are oversold and sentiment is showing a lot of bearishness on the part of option buyers and investment advisors. This is what you expect at an inflection point.
A good example of oversold is shown in the chart below. The five week moving average of advances minus declines on the NYSE is approaching minus 500. This is the level which has seen some very good trading bottoms over the past months.

AAII FIGURES ARE CONSTRUCTIVE
We’re finally seeing some bearishness come into the American Association of Individual Investors survey. This is the part that has been missing from the overall bearish sentiment figures. Now, it’s finally happening. When this survey shows 35% bears, we tend to be near some sort of multi week rally.

GOLD
We’re bearish on gold, but the yellow metal probably isn’t too far from a tradable bottom. RSI is rapidly approaching an oversold condition and the price isn’t far from support.

BONDS
Bonds look to have made a saucer bottom and are now working higher. This means lower rates and most stocks favor this condition. The banks are an exception. RSI is very overbought, but near term setbacks aside, this market looks like it wants to move higher.

CANADIAN MARKETS
Canadian stocks have had a correction that resembles the U.S. stock market, but it too appears to be in an improving situation. It was recently oversold and it is holding previous lows.

TRADING THROUGH FEBRUARY
For 2018, we have closed out five trades. Three have been successful and two have lost money. The last one was a doozy of 14 points. But, we are still profitable for the year by 1.81 SSO points. The SSO itself is lower by 3.98 points.
Since December 31, 2010, our hotline recommendations have profited by 92.16 SSO points which works out to be over 15% compounded. The chart for that period is shown below.

FINAL THOUGHTS
Everything seems to be lining up for multi week uptrend, but there is one caveat. If we have entered a bear market, these oversold conditions can become much more oversold. Right now we have a bit of a nervous twitch. After all this market has been in an uptrend for 9 years.
But bear markets tend to be associated with recessions and there is nothing suggesting that currently. Profits are good and business optimism is high. However, we do need to be alert to changes. We’ll be here to help with that.
INTERMEDIATE TERM
Since 1993, we have given instructions to mutual fund investors to be either 100% invested or 100% on the sidelines. According to Timer Digest, of Greenwich, CT, which monitors over 100 advisory services world wide, we are only one of four services to have beaten the buy and hold over the past ten years.
We were rated # 1 for the past ten years at year end, 2003, 2004 and 2005. In 2006, we slipped to # 3. At the end of 2007 we were ranked # 4.
We were bond timer of the year at the end of 2007, 2008 and 2016. Which means we were ranked number 1 for those three years. We were rated # 1 in gold timing for 1997 and again in 2011. We were #2 in gold for the year 2014. Late update. We were tied for Timer of The Year 2017 by Timer Digest. We were number 3 in gold timing.
MANAGED ACCOUNTS
In association with Financial Growth Management, we can make available to you a low risk bond income program. Your account would be actively managed through TD Ameritrade or Trust Company of America.
Your funds will be exchanged between high-yield bond funds and money market funds based on a proprietary mathematical model. Our goal is to return 10-12% per year during a 3 to 5 year market cycle with very low risk.
If you would like more information, please contact Ray Hansen at 714 637 7784.
END OF LETTER

SPEAKING ENGAGEMENTS
If your group needs a speaker on the stock market give our office a call at 909 338 8354


Martin Armstrong has been consistent in forecasting higher prices for stocks, arguing that the market is no where near as overbought as the majority think. Martin just published this proprietary chart above going back to 1915 that makes the case that the market was far more overbought when capital was flooding into the US in the past than it is today – R. Zurrer for Money Talks
QUESTION: Where does your overbought index stand on the stock market?
ANSWER: This Index is proprietary. It peaked at 12.55 during October 1919 as capital had flowed to the United States due to World War I. The Index then declined thereafter into the August 1921 bottom at 10.40. From this point, the Index rallied into October 1925 peaking at 13.16, fell back for 15 months bottoming again in October 1927. The final rally lasted 14 months peaking at 12.95. The bottom came in July 1933 about 13 months after the actually low in nominal dollar terms during June 1932.
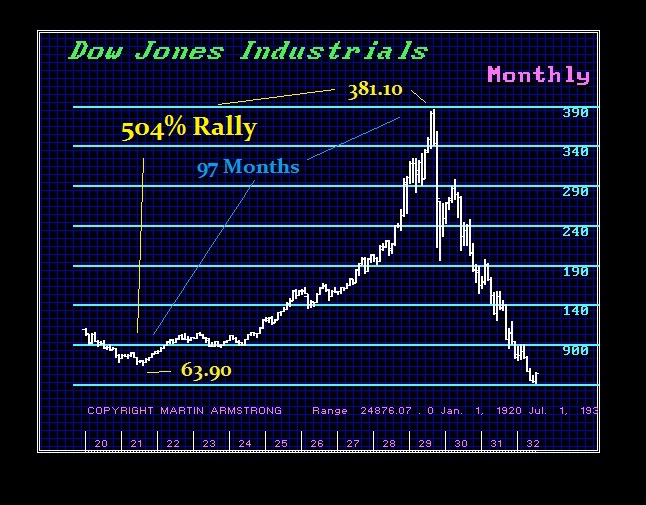
In nominal terms, the Dow tested the 1,000 level in 1966, 1968, and 1973 and again in 1980. We can see the shift in trend that came following the historical low in 1981. The core of this index is capital flows so it tends to reflect just how capital flees and concentrates moving relative to US assets. Looking at the most famous bull market of the Roaring ’20s, the duration was 97 months which we exceeded from the 2009 low in April 2017. The 2009 low was 6469.95 and the January high was 24,741.70. which was a rally of only 282% – not anywhere close to the Roaring ’20s.
This index is proprietary and it affords us a look at the asset class from a global perspective. This is part of the reason we have been warning that the bull market is by no means overbought and the bulk of forecasting out there has made this the most hated bull market in history because they look only at the nominal index without placing it within its global context.
…also from Martin: Market Talk- April 2, 2018

-
I know Mike is a very solid investor and respect his opinions very much. So if he says pay attention to this or that - I will.
~ Dale G.
-
I've started managing my own investments so view Michael's site as a one-stop shop from which to get information and perspectives.
~ Dave E.
-
Michael offers easy reading, honest, common sense information that anyone can use in a practical manner.
~ der_al.
-
A sane voice in a scrambled investment world.
~ Ed R.
Inside Edge Pro Contributors

Greg Weldon

Josef Schachter

Tyler Bollhorn

Ryan Irvine

Paul Beattie

Martin Straith

Patrick Ceresna

Mark Leibovit

James Thorne

Victor Adair