
Gold & Precious Metals

Golds performance has outstripped the booming S&P 500 since the year 2000. Even with dividends reinvested, the soaring Stock Market is still trailing the yellow metal! That’s even with Gold dribbling down $600 since its high of $1920 8 years ago. Definitely time to take a look at Gold’s near and long term potential – R. Zurrer for Money TAlks

In a January post, I showed how the price of gold rallied in the months following the 2015 and 2016 December interest rate hikes—as much as 29 percent in the former cycle, 17.8 percent in the latter. Gold ended 2017 up double digits, despite pressure from skyrocketing stocks and massive cryptocurrency speculation.

I forecast then that we could see another “Fed rally” this year following the rate hike in December 2017. Hypothetically, if gold took a similar trajectory as the past two cycles, its price could climb as high as $1,500 this year.
As I told Kitco News’ Daniela Cambone last week, I stand by the $1,500 forecast. Before last week, investors might have been slightly disappointed by gold’s mostly sideways performance so far this year. But now, in response to a number of factors, it’s up close to 3 percent in 2018, compared to the S&P 500 Index, down 2.4 percent.
Living with Volatility
While I’m on the topic of equities, the S&P 500 dividend yield, for the first time in nearly a decade, is now below the yield on the two-year Treasury. Historically, the economy has slowed around six months after dividends stopped paying as much as short-dated government paper. This could spur some stock investors to trim their exposure and rotate into other asset classes, including not just bonds but also precious metals, which I believe might help gold revisit resistance from its 2016 high of $1,374 an ounce.

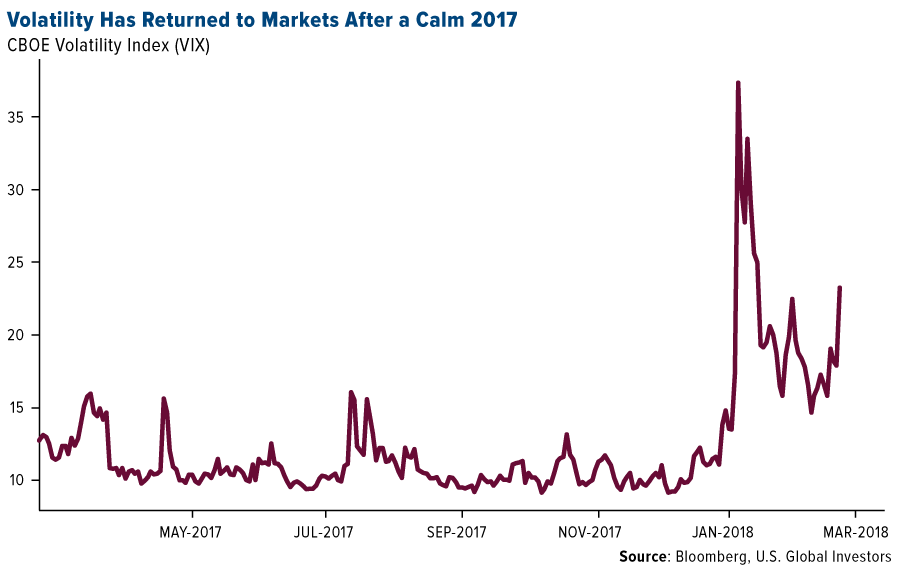
Volatility has also crept back into markets. It began with the positive wage growth report in February, implying the possibility of faster inflation. More recently, the CBOE Volatility Index (VIX), or “fear gauge,” has surged on the departures of Gary Cohn as chief economic advisor and Rex Tillerson as secretary of state, as well as the application of tariffs on steel and aluminum imports. Last week, President Donald Trump ordered tariffs on at least $50 billion of Chinese goods, stoking new fears of a U.S.-China trade war. In response, the Asian giant proposed fresh duties on as much as $3 billion of U.S. products, including wine, fruits, nuts, ethanol and steel pipes.
As I see it, there could be other contributing factors pushing up the price of gold. A good place to start is with Trump’s recent appointment of former CNBC star Larry Kudlow as White House chief economic advisor.
Kudlow’s Kerfuffle Over Gold
Between 2001 and 2007, I appeared on Kudlow’s various CNBC shows a number of times, and though he always struck me as highly intelligent, informed and accomplished—he served as Bear Stearns’ chief economist and even advised President Ronald Reagan—it was clear he had a strong bias against gold. This was the case even as the price of the yellow metal was on a tear, rising from $270 in 2001 to more than $830 an ounce by the end of 2007.
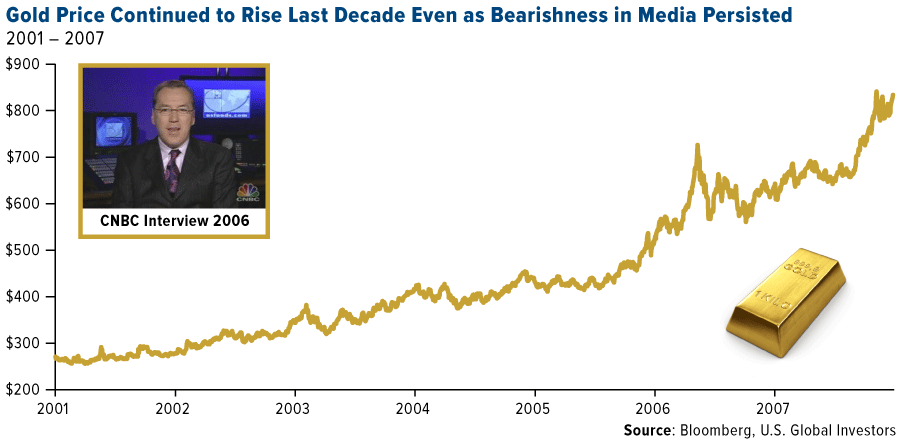
Kudlow showed his true colors toward gold as recently as this month, telling viewers: I would buy King Dollar and I would sell gold. As you can see below, this has’t been a prudent trade for more than a year now.

Earlier this month, Kudlow wrote that falling gold is good, as it “bodes well for the future economy.” He said he agreed with a friend, who called the metal an “end-of-the-world insurance contract.”
While there are those who would agree with him, it’s important to remember that gold is used for much more than as a portfolio diversifier, and its price is driven by a number of factors. These include Fear Trade factors, from inflation to negative real interest rates, and Love Trade factors such as gift-giving during cultural and religious festivals. The precious metal has important industrial applications as well.
And since I first went on Kudlow’s program, gold has outperformed the S&P 500’s price action nearly two-to-one, as I showed you back in December. Even with dividends reinvested, the market is still trailing the yellow metal.

So it’s fine if gold isn’t your favorite asset, but to dismiss it wholesale as Kudlow has again and again is, with all due respect, irrational.
It’s Not About Steel, It’s About Stealing
Kudlow isn’t just anti-gold, however. He’s also anti-China, and even though he’s traditionally opposed tariffs in general, he supports Trump’s efforts to levy taxes on Chinese imports. Specifically, the duties are designed to offset the cost of intellectual property allegedly stolen by the Chinese over the past several years.
China’s J-31 fighter jet, for example, is believed to be a knockoff of Lockheed Martin’s F-35, the most expensive piece of U.S. military equipment. It’s for this reason that Lockheed’s CEO, Marillyn Hewson, was present when Trump signed the authorization to impose new tariffs.

Our intellectual property is hugely important to the U.S. economy. As important as steel and aluminum are, they account for only 2 percent of world trade, and in the U.S., it’s even less than a percent of gross domestic product (GDP). Technology exports, on the other hand, represent about 17 percent of U.S. GDP.
That said, the implications of a trade war with the world’s second-largest economy certainly have many investors concerned—all the more reason to consider adding to your gold allocation at this time. As always, I recommend a 10 percent weighting, with 5 percent in gold bullion, 5 percent in high-quality gold mining stocks and ETFs.
Is Trump Betting on the Wrong Guy?
On a final note, we were pleased to have an old friend visit our office last week. Michael Ding, a veteran of the U.S. Global investments team, joined us to share some laughs and his thoughts on what’s happening in Asian markets right now.
Specifically, Michael said that Ray Dalio, founder of mammoth investment firm Bridgewater Associates, which manages around $160 billion, has become something of an economic guru for members of the Chinese ruling party’s highest-ranking members, including Premier Li Keqiang. Dalio—whose most recent book, Principles, nowtops China’s bestseller list—is reportedly advising the country’s top bankers and economists on how to deleverage safely without triggering a so-called “hard landing.”
A trade war between the U.S. and China, Ray Dalio said recently, would be a “tragedy.”
So to put it in perspective: Whereas Trump has just now brought on Kudlow, the Chinese are leaning on a fellow American, Dalio, one of the smartest, most gifted money managers in the world—not just of our time but of all time.
Did Trump make the right call? Which player would you want on your team: Kudlow or Dalio? For my money, I would pick Dalio.
Learn more about investment opportunities in China by clicking here!
The trade-weighted US dollar index, also known as the broad index, is a measure of the value of the United States dollar relative to other world currencies.
The S&P 500 is a stock market index that tracks the stocks of 500 large-cap companies. It seeks to represent the stock market’s performance by reporting the risk and return of the biggest companies.
The CBOE Volatility Index, known by its ticker symbol VIX, is a popular measure of the stock market’s expectation of volatility implied by S&P 500 index options, calculated and published by the Chicago Board Options Exchange (CBOE). It is colloquially referred to as the fear index or the fear gauge.
There is no guarantee that the issuers of any securities will declare dividends in the future or that, if declared, will remain at current levels or increase over time.
Holdings may change daily. Holdings are reported as of the most recent quarter-end. None of the securities mentioned in the article were held by any accounts managed by U.S. Global Investors as of 12/31/2017.

Crude Oil is currently scratching at recent highs, but this analysis makes a strong case we will see an immediate drop back $5 to $6 in the next 5-10 days. Click on all chart for larger versions – R. Zurrer for Money Talks
Crude Oil – Hello Elliott, My Old Friend…
The test of the resistance line, the triangle apex reversal, the a-b-c waves in the zigzag pattern… What connects them? Give us 28 paragraphs and 974 words and you will see that these seemingly mismatched concepts will form a meaningful and promising scenario
Technical Analysis of Crude Oil
Let’s start with the well-known daily chart (charts courtesy of http://stockcharts.com).

In our Monday’s Oil Trading Alert, we wrote that oil bulls took control shortly after the opening of the Friday session (…) and climbed to the major resistance zone, which stopped light crude’s rally at the end of January, triggering declines in the following weeks.
Will history repeat itself once again and we see similar price action in the coming days?
As you see on the daily chart, the red resistance zone created by the previous 2018 peaks is currently reinforced by the upper border of the green rising trend channel, which suggests that reversal may be just around the corner – especially when we factor in the fact that the daily indicators increased to their overbought areas, which could translate into sell signals in the very near future.
From today’s point of view, we see that the situation developed in tune with our assumptions and crude oil reversed and pulled back after the test of the upper border of the green rising trend channel, which suggests further deterioration in the coming days.
But will we really see the next downward move in near future? After all, oil bears disappointed us many times during the last month, so why should it be different now and why we should trust them?
The Reasons
First, the bears have on their side the above-mentioned strong resistance zone, which successfully stopped their opponents two times earlier this year.
Second, the Stochastic Oscillator generated the sell signal.
Third, Elliott wave theory…
What do we mean by that? Let’s examine the chart below.

Looking at the daily chart once again (but this time from a wider and different perspective), you can see that we divided the entire upward move, which started in June 2017 for individual waves in accordance with Elliott wave theory.
The potential first wave ended on August 1, 2017, the second wave ended on August 31. The third wave stretched until January 25. After this peak the price of crude oil corrected the previous upward move, which created the first wave (marked with a) in a potential zigzag pattern. As you see, the green support zone triggered a rebound, which created a potential wave b of a zigzag, which includes another zigzag at the moment of writing these words.
What does it mean for crude oil and how oil bears can use this pattern?
The most important feature of wave b is that it cannot retrace 100% of wave a. In other words, if the above sequence of waves is well-written, we’ll see another downward move in the coming days. In this way, black gold will create wave c in the above-mentioned big zigzag.
How Low Could Crude Oil Go?
If crude oil goes to the south from current levels, we’ll see (at least) a decline to the lower border of the medium-term blue rising trend channel seen on the above chart (currently around the February low of $58.10).
This is the Time, This is the Place
Once we already know where (potentially) the next wave of declines will head, it’s time to find out when we can expect another bigger reversal that will end the move to the downside. What can help us with this issue?
If you do not know yet, don’t worry about that, because we will describe everything in the following paragraphs (after all, you have us to analyze the charts carefully and share our insights).

So, coming back to the earlier question… what can help us determine the date of the next reversal? Triangle apex reversal pattern. What does it mean in practice?
Looking at the above chart, you can see the yellow triangle created by the resistance line based on the late February and early March highs and the support line based on the mid-February and mid-March lows. The intersection of his arms took place yesterday, which resulted in a reversal.
On the above chart, however, we can notice one more tringle (marked with the black dashed lines). As you see, it is created by the resistance line based on the February peaks and the support line based on the December and February lows. When will these lines intersect? Around April 10. What’s interesting, this date is also confirmed by the blue triangle (we marked it with dashed lines on the first daily chart in today’s alert) and two medium-term triangles seen on the weekly chat below.

From this perspective, we see that the blue triangle is created by the resistance line based on the June 2016 and January 2017 peaks and the support line based on the April 2016 low and mid-November 2016 low. The green triangle is created by the resistance line based on the February and April 2017 highs and the support line based on the August 2016 and June 2017 lows.
Additionally, analyzing the above chart, we noticed that April 4, 2016 and April 10, 2017 brought reversals, which increases the probability that we’ll likely similar price action in the coming month.
Will April 9/10, 2018 show the bottom of the fourth wave in the five-wave sequence? Taking all the above into account and combining it with the fact that in the same “time zone” the duration of the wave c will be equal to the duration of the wave a (we marked them with black rectangles on the last daily chart) we believe that oil bears will do their best and realize this scenario, making our short positions profitable.
Finishing today’s Oil Trading Alert, please keep in mind that the above waves’ structure may break only if the price of light crude increases above the major red resistance zone. Nevertheless, at the moment of writing these words, all available technical and fundamental factors favor the pro-bearish scenario in the following weeks.
Thank you.
Nadia Simmons
Forex & Oil Trading Strategist
Przemyslaw Radomski, CFA
Founder, Editor-in-chief, Gold & Silver Fund Manager
Sunshine Profits – Tools for Effective Gold & Silver Investments
Get 7 days of free access to our premium daily Oil Trading Alerts as well as Gold & Silver Trading Alerts. Sign up now.
* * * * *
All essays, research and information found above represent analyses and opinions of Przemyslaw Radomski, CFA and Sunshine Profits’ associates only. As such, it may prove wrong and be a subject to change without notice. Opinions and analyses were based on data available to authors of respective essays at the time of writing. Although the information provided above is based on careful research and sources that are believed to be accurate, Przemyslaw Radomski, CFA and his associates do not guarantee the accuracy or thoroughness of the data or information reported. The opinions published above are neither an offer nor a recommendation to purchase or sell any securities. Mr. Radomski is not a Registered Securities Advisor. By reading Przemyslaw Radomski’s, CFA reports you fully agree that he will not be held responsible or liable for any decisions you make regarding any information provided in these reports. Investing, trading and speculation in any financial markets may involve high risk of loss. Przemyslaw Radomski, CFA, Sunshine Profits’ employees and affiliates as well as members of their families may have a short or long position in any securities, including those mentioned in any of the reports or essays, and may make additional purchases and/or sales of those securities without notice.

Game theory postulates that rising oil prices increases the payoff for OPEC members to cheat on their deal. Game Theory is “the study of mathematical models of conflict and cooperation between intelligent rational decision-makers” and is mainly used in economics – R. Zurrer for Money Talks

- OPEC members have a deal to cap production levels until December.
- Oil prices are rising.
- When prices are higher, there is less incentive to cooperate with production caps.
With oil prices rising, Organization of Petroleum Exporting Countries members are facing a dilemma.
Extending output caps means making more room in the market for non-member competitors, and coordinating a higher amount of output means lowering prices. So they might not do either, and game theory could help explain why.
“Game theory suggests that higher oil prices increase the pay-off from cheating on the deal, which means that compliance could fall in 2018,” Thomas Pugh and Liam Peach, economists at Capital Economics, wrote in a note to clients this week.
West Texas Intermediate crude oil has stayed above $60 a barrel most of this year, only falling during a major market selloff in February. And as prices rise, non-OPEC production is increasing. In November, US shale producers hit a record high for production, pumping more than 10 billion barrels a day.
For an individual country focused on maximizing revenue, producing as much oil as possible is usually the dominant strategy — what players should do regardless of the actions of other players.
But when everyone amps up production, it puts downward pressure on prices. In game theory, this is an example of the prisoner’s dilemma. Because everyone acts out of self-interest, players end up in a worse scenario than if they collaborated.
This is where OPEC collusion comes in. Member countries — Algeria, Angola, Ecuador, Equatorial Guinea, Gabon, Iran, Iraq, Kuwait, Libya, Nigeria, Qatar, Saudi Arabia and the United Arab Emirates — act as a single supplier.
But as prices rise, it creates more incentive for members to cheat and produce more. Because marginal revenue is higher than at lower prices, there is greater payoff from raising output — even in the face of production caps.
At the same time, the opportunity cost of complying also becomes greater.
“Cutting output to counter the effect of rising non-OPEC production would require giving up increasing amounts of market share and revenue,” Pugh and Peach added.
….also from Business Insider: Trump wants to go after Amazon
Mr. Todd is preparing to buy the plunging Stock Market short term unless it breaks an important level. Today he has also switched from bullish Gold & Silver to Bearish – R. Zurrer for Money Talks
Published @ 3:00pm PST Tuesday March 27, 2018
DOW – 345 on -1031net declines
NASDAQ COMP – 211 on 1564 net declines
SHORT TERM TREND Bullish
INTERMEDIATE TERM Bearish
STOCKS: Here are the factors in today’s selling. Nvidia backed away from driverless cars and this caused a drop of 7% in the stock and that infected other high techs. Then interest rates dropped sharply and this caused trouble for the banks which like higher rates.
And of course, there is the old reliable Facebook which was down over 5% for the session and is now 22% below its high.
Another point. The end of the quarter comes on Thursday and we’ll probably see a lot of choppy action as institutions rearrange their portfolios for the quarterly reports. Of course, computer driven algorithms are a factor and are probably the reason for the extreme point action.
I’m sticking with a short term bullish posture. We’re very oversold and sentiment is extremely negative. However it’s important that we hold the closing lows of Friday.
GOLD: Gold dropped $11. The dollar was higher and the yellow metal was overbought.
CHART: The S&P 500 is doing a retest of the early February lows. This is a support zone since it arrested the last big decline. Most technical measures are oversold and we have a very high put call ratio. It should resolve to the upside unless we have entered a bear market. I’m not of that opinion, but it does require close attention.

BOTTOM LINE: (Trading)
Our intermediate term system is on a sell.
System 7 We are in cash. Stay there for now.
System 9 We’re on a buy for system 9 from Friday March 16 to March 30.
NEWS AND FUNDAMENTALS: Consumer confidence came in at 127.7, lower than last month’s 130.0. The Case Shiller home price index rose 0.8% more than the estimated 0.7%. On Wednesday we get oil inventories, the trade deficit and pending home sales.
INTERESTING STUFF: Shallow men believe in luck. Strong men believe in cause and effect. ——–Ralph Waldo Emerson
TORONTO EXCHANGE: Toronto lost 82.
BONDS: Bonds surged.
THE REST: The dollar rebounded. Crude oil was lower.
Bonds –Change to bullish as of March 27.
U.S. dollar – Bearish as of March 26.
Euro — Bullish as of March 26.
Gold —-Change to bearish as of March 27.
Silver—- Change to bearish as of March 27.
Crude oil —-Change to bearish as of March 27.
Toronto Stock Exchange—-Bullish as of Feb. 12.
We are on a long term buy signal for the markets of the U.S., Canada, Britain, Germany and France.

Monetary conditions (+2 means the Fed is actively dropping rates; +1 means a bias toward easing. 0 means neutral, -1 means a bias toward tightening, -2 means actively raising rates). RSI (30 or below is oversold, 80 or above is overbought). McClellan Oscillator ( minus 100 is oversold. Plus 100 is overbought). Composite Gauge (5 or below is negative, 13 or above is positive). Composite Gauge five day m.a. (8.0 or below is overbought. 12.0 or above is oversold). CBOE Put Call Ratio ( .80 or below is a negative. 1.00 or above is a positive). Volatility Index, VIX (low teens bearish, high twenties bullish), VIX % single day change. + 5 or greater bullish. -5 or less, bearish. VIX % change 5 day m.a. +3.0 or above bullish, -3.0 or below, bearish. Advances minus declines three day m.a.( +500 is bearish. – 500 is bullish). Supply Demand 5 day m.a. (.45 or below is a positive. .80 or above is a negative). Trading Index (TRIN) 1.40 or above bullish. No level for bearish.
No guarantees are made. Traders can and do lose money. The publisher may take positions in recommended securities.
Martin Armstrong reports the latest movements on the interest rate front as well as the remarkable move by Germany which will convince the world the European project is authoritarian (Germany arrested a Catalonian politician enforcing Spain’s dictatorship) – R. Zurrer for Money Talks
QUESTION: Mr. Armstrong; It appears that now the Bundesbank has adopted your view of rising interest rates. How fast do you see rates rising?
ANSWER: Yes, the Bundesbank President Jens Weidmann has come out and warned that banks should start to make provisions for interest rate risks associated with rising interest rates. The normalization of the interest rates is essential and as always, it is now too little too late. The economic environment is changing much more rapidly than most suspect. It is true that the German banks have increased their equity significantly since the financial crisis. While the central banks are warning that rates are rising, they misjudge the fact that banks are by no means as resilient as they were before the 2007-2009 crisis.
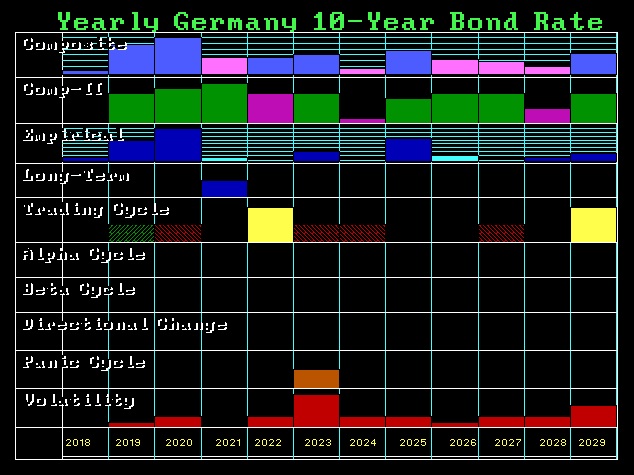
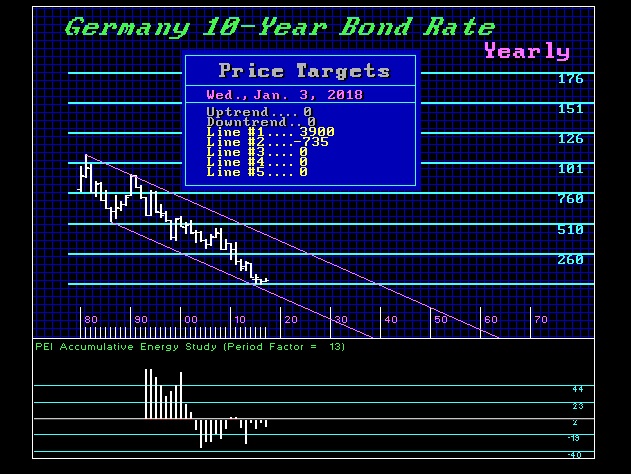
German 10-year rates will start to rise rapidly following a monthly closing above 0.79%. The next stop will be 2% and thereafter, we will see a test of the 4% level. Once we exceed the 2007 high of 4.67%, we will see a rapid rise to the 5.6% area and an annual closing above that will warn of a test of the 8.5%-11% zone and that can be easily by 2020.
….related from Martin: The Fed is Raising Rates Because of the Pension Crisis
…also breaking: Germany Arrests Former Head of Catalonia for Spain Confirm the Spanish Constitution Violates Human Rights

-
I know Mike is a very solid investor and respect his opinions very much. So if he says pay attention to this or that - I will.
~ Dale G.
-
I've started managing my own investments so view Michael's site as a one-stop shop from which to get information and perspectives.
~ Dave E.
-
Michael offers easy reading, honest, common sense information that anyone can use in a practical manner.
~ der_al.
-
A sane voice in a scrambled investment world.
~ Ed R.
Inside Edge Pro Contributors

Greg Weldon

Josef Schachter

Tyler Bollhorn

Ryan Irvine

Paul Beattie

Martin Straith

Patrick Ceresna

Mark Leibovit

James Thorne

Victor Adair