
Mike's Content
Michael’s Guest James Thorne who manages billions explains current market risk, the current decline and where and when to take advantage of the next opportunities that will last for the next 3-4 years.
….also from Michael: A Hall of Fame Bad idea


One look at Stewart’s chart above indicates that we are in a buying zone right here. That leaves the questions what will perform the best and how rising interest rates will effect this market in this 24 point analysis – R. Zurrer for Money Talks
Mar 27, 2018
- I’ve predicted that in 2018 the US stock market would suffer a series of crashes somewhat akin to the 1987 event, but smaller in size.
- Please Double-click the chart above for a larger version of this interesting chart of the US stock market. Clearly, these mini-crashes are starting to happen.
- Having said that, I haven’t sold any of my US bank stocks and I have no plans to do so.
- To understand why I’m still “long and strong” the bank stocks in this environment, please click here now. Bank profits are soaring because of tax cuts, QT, and rate hikes.
- Corporate boards are still using the bulk of the profits for stock buybacks and bonuses for the “fat cats”, while throwing crumbs to the lower-paid workers.
- As disgusting as that is, it’s a good environment to own stock market indexes, and a great environment to own bank stocks.
- This is the stage of the business cycle where “big growth” transitions to “decent growth with inflation”. Simply put, in this environment bank stocks do well, growth stocks stumble, and gold stocks start to get modest liquidity flows from institutions.
- As the cycle moves to “inflation with low growth”, growth stocks crash, bank stocks fade, and gold stocks soar.
- Please click here now. Double-click to enlarge this key T-bond chart. US interest rates are rising now and poised to rise relentlessly for the next several years.
- There are “institutional thresholds” of importance in major markets. For the US stock market, institutions will generally continue to buy stocks until the ten-year yield reaches the 4%-5% range.
- Please click here now. Double-click to enlarge.
- Goldman is predicting four rate hikes this year and I’m predicting a minimum of three. The yield should get close to 4% by the end of this year.
- I realise that most gold bugs are “stock market crash enthusiasts”. There’s no question that the US stock market has soared mainly because the “hot air” of QE and low rates has incentivized corporate boards to focus on stock market buybacks rather than worker wages and business expansion.
- Having said that, patience is required. Investors need to focus on the slow but steady cyclical transition from growth to inflation as the Fed pushes the enormous QE money ball out of government bonds and into the fractional reserve banking system.
- Please click here now. Double-click to enlarge this fabulous daily gold chart. The rectangle pattern is flag-like, and suggests gold is coiling to burst above my key $1370 resistance zone.
- Short term traders who took my recommendation to buy the $1310 area should be sellers in this $1340-$1355 area. That’s because there could be quite a bit more coiling action before a true breakout above $1370 occurs. The bottom line is that investors need to be patient and traders need to book profits now!
- Looking at the big picture, the inflation trade is clearly becoming more positive for gold every day. The Trump decision to appoint John “The Hawk” Bolton to a key post in his administration makes the geopolitical trade for gold a positive one as well.
- What about the love trade? Well, please click here now. The 2019 Indian elections are approaching and the Modi government is likely to win again.
- Modi is backed with “monster money” and to ensure he wins again he’s launching a huge farm income program called MSP. This program is inflationary because it boosts crop prices. That alone is positive for the global price of gold.
- The MSP program also is poised to create a massive boost in farmer income, and rural Indians always use extra income to buy more gold. Please click here now. This MSP policy launch is happening at the same time as the influential Niti Aayog panel pushes the Modi government to implement a massive gold-positive policy agenda.
- I’ve been adamant that 2018 would see the absolute end of gold-negative policy from the Modi government, and the launch of positive policy. That’s clearly in play, and it’s going to exponentially accelerate relentlessly.
- Please click here now. Double-click to enlarge this GDX chart. The technical action is superb, and investors should now be buyers of their favourite GDX and GDXJ component stocks on all two and three-day pullbacks.
- Please click here now. Double click to enlarge. With food inflation set to surge in India and general wage and price inflation on the move in America, it’s time for investors to take a more serious interest in silver stocks. The big upside action won’t start until there’s a volume-based breakout from the bull wedge pattern on this silver stocks ETF chart.
- Call option buyers should wait for that breakout before buying, but all silver stock enthusiasts should be buyers of key SIL component stocks right now. Use two and three-day pull backs to take buy-side action, in preparation for the imminent upside rocket ride!
Thanks!
Cheers
st
Mar 27, 2018
Stewart Thomson
Graceland Updates
website: www.gracelandupdates.com
Stewart Thomson is a retired Merrill Lynch broker. Stewart writes the Graceland Updates daily between 4am-7am. They are sent out around 8am. The newsletter is attractively priced and the format is a unique numbered point form; giving clarity to each point and saving valuable reading time.
Risks, Disclaimers, Legal
Stewart Thomson is no longer an investment advisor. The information provided by Stewart and Graceland Updates is for general information purposes only. Before taking any action on any investment, it is imperative that you consult with multiple properly licensed, experienced and qualifed investment advisors and get numerous opinions before taking any action. Your minimum risk on any investment in the world is 100% loss of all your money. You may be taking or preparing to take leveraged positions in investments and not know it, exposing yourself to unlimited risks. This is highly concerning if you are an investor in any derivatives products. There is an approx $700 trillion OTC Derivatives Iceberg with a tiny portion written off officially. The bottom line:

Tyler’s has found two stocks, a marijuana stock that after decling for 5 months is ready to move and a powerfully moving biotech stock. He also reveals some more trading rules in this weeks StockScores newsletter. – Robert Zurrer for Money Talks

![]()
In this week’s issue:
- Stockscores’ Market Minutes Video – Plan the Trade, Trade the Plan
- Stockscores Trader Training – How to Be a Better Trader
- Stock Features of the Week – Abnormal Breaks
Stockscores Market Minutes – Plan the Trade, Trade the Plan
All traders should approach their trading with a plan for what to do in the different situations that the market may give them. This week, I discuss this, my regular weekly market analysis and the trade of the week on VXX.
Click here to watch on the Stockscores Youtube Channel
To get instant updates when I upload a new video, subscribe to the Stockscores YouTube Channel
Trader Training – How To Be a Better Trader
I created a new video this week which shows how the system I use for finding my day trades works. I am an algorithmic trader, which means I use logic-based rules to pick the stocks that I will buy or short. I do not use my own judgment when trading, I save the thinking for when I am developing my strategy rules.
You can watch the video on Youtube by clicking here.
The development of my rules is based on data that I collect each day. I have computerized tools which take in the trading data for every stock that I monitor and identifies all of the entry signals and subsequent performance. In this video, I show that data as well as the performance of the strategy since the start of February.
I then compare what I actually do to what I should have done if I was perfect in my execution. I never expect to do as well as the computerized results. There is slippage on getting the trade orders filled, commissions and human error that can all lower my actual performance relative to the ideal. Even though my computer model alerts me instantly when there is a trade that meets my rules, I may still miss it, especially at the open of the trading day when there are a lot of trades to be made. Sometimes this can help as I may miss a trade that ends up being a loser.
One area where collecting trading data is particularly helpful is when I feel like I missed out. Today was a good example because my buy signals suffered a small loss overall today. However, if I had changed one rule, they would have been very profitable today (-4RR vs +38RR where RR is reward for risk. If I risk $100 per trade and lose 4RR, I have lost $400. If I make 38, I have made $3800).
Since changing one rule made a big difference today, it is easy to think that I should make that change going forward. However, I did analysis on how changing that rule would have affected the overall profitability of my strategy since Feb 1 and it cut the average profit per trade down more than 50% overall.
This shows that today was an anomaly and that I should not change my strategy rules. Until I have a large data set that shows a change in my rules produces more profit, I will stick with the rules as they are.
Each week, I go through a process to optimize my trading rules based on the large data set that I have accumulated. I make tweaks to my rules to do what works the best.
I also compare my actual performance to what I should have done if I was perfect. I look for areas where I fall short and try to understand what the cause of the short fall is so I can modify my process and trading plan to be better. This is part of the never-ending process to be a better trader. Data, while time consuming to collect, is extremely valuable toward that goal.
Be sure to watch the video, it will help make this approach make more sense. Click here to view.

This week, I ran the Abnormal Breaks Market Scan strategy on the Canadian market in search of stocks breaking through resistance with abnormal price and volume action. I found two that stood out:

1. V.GENE
V.GENE is a break out of a pennant pattern with strong price action. Volume is higher than normal but not extremely abnormal which is one weakness. I rate this a 7/10. Support at $1.85.

2. V.HEMP
V.HEMP has been in a downward trend for the past five months but broke that downward trend line with abnormal volume today. Rate this an 8/10. Support at $1.

Follow on Twitter | View Youtube Channel
If you wish to unsubscribe from the Stockscores Foundation newsletter or change the format of email you are receiving please login to your Stockscores account. Copyright Stockscores Analytics Corp.
References
- Get the Stockscore on any of over 20,000 North American stocks.
- Background on the theories used by Stockscores.
- Strategies that can help you find new opportunities.
- Scan the market using extensive filter criteria.
- Build a portfolio of stocks and view a slide show of their charts.
- See which sectors are leading the market, and their components.
Disclaimer
This is not an investment advisory, and should not be used to make investment decisions. Information in Stockscores Foundation is often opinionated and should be considered for information purposes only. No stock exchange anywhere has approved or disapproved of the information contained herein. There is no express or implied solicitation to buy or sell securities. The writers and editors of this newsletter may have positions in the stocks discussed above and may trade in the stocks mentioned. Don’t consider buying or selling any stock without conducting your own due diligence.
Trade freedom has been dominating the headlines and adding to the growing economic risks and market volatility. Trump’s tariffs on steel and aluminium imports have prompted fears of a trade war, albeit with a low probability and with some comfort offered with the exemption clauses. This does, however, remind us that negotiating with the US is difficult and that NAFTA negotiations have yet to be resolved. A more important and difficult issue is that of intellectual property rights in relation to China. For now, markets seem to be looking through the bravado because it is mutually beneficial for all sides to avoid a trade war which would negatively impact global economic growth prospects. This week we quantify trade freedoms to validate that seemingly prosaic position.
Using data from The Heritage Foundation, we see there have been notable reductions in trade barriers across the world over the past twenty or so years. Figure 1 highlights the Trade Freedom Index – for the world and four major economies. The Index is a composite measure of the absence of tariff and non-tariff barriers that affect imports and exports of goods and services. Trade freedom for the world has improved from under 60 per cent in 1995 to just under 80 per cent in 2018. The US along with Canada and Germany are close to 90% on the trade freedom score. In the case of China, there has been significant improvement from 20 per cent in 1995 to over 70 per cent in the latest measure. The rhetoric really does seem to be misplaced.
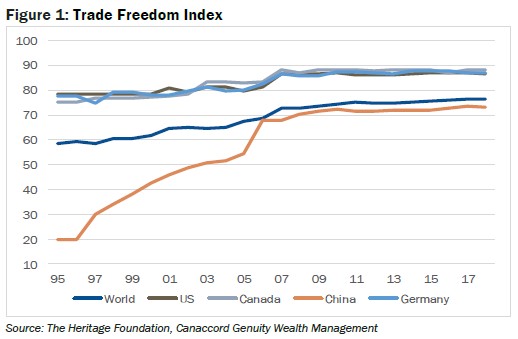
If Trump wants to bash China, maybe he should be focusing on investment freedoms (constraints on the flow of investment capital, and financial freedom which is a measure of banking efficiency and independence from government control). Measures that track investment freedoms have deteriorated over the past twenty years. We suspect that common sense will eventually prevail and that the market is correct to heavily discount the prospect of a trade war and focus instead on the improving fundamentals.
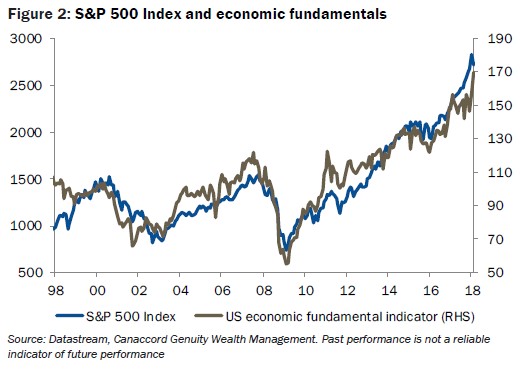
The US economy created 313,000 new jobs in February which was the biggest gain since mid-2016 according to the non-farm payrolls, a key leading indicator of economic activity. Jobs created in January and December were revised up to 239,000 and 175,000 respectively. The unemployment rate was unchanged at 4.1% last month. Average hourly earnings, which had spooked market fear of heightened inflationary pressures, rose by just 2.6 per cent year-on-year in February down from 2.8 per cent in January (which in turn was revised down from 2.9%). The inflation scare seems to have passed, but growth remains buoyant with the University of Michigan Consumer Sentiment Indicator coming in strong and with the economy projected to grow by some 2.8% annualised in Q1 2018 from 2.6% in Q4 2017 according to the Atlanta Federal Reserve GDPNow model.
The economic fundamentals are important and we validate that in Figure 2 which highlights the close relationship between the S&P 5000 Index performance versus an economic composite indicator since 1998. The economic composite indicator is a blend of the Michigan Consumer Sentiment Index, the initial jobless claims and the CRB Spot Index. As George Michael might have said, “I think there’s something you should know…”, we should be focussing on the fundamentals and discounting the rhetoric for now.
Brent Woyat, CIM, CMT
Investment Advisor, Portfolio Manager
Canaccord Genuity Wealth Management
T: 604.699.0869 | F: 604.643.1802
All information is given as of the date appearing in this document and Canaccord Genuity Wealth Management (CGWM) does not assume any obligation to update it or to advise on further developments related. All this information has been compiled from sources believed to be reliable, but the accuracy and completeness of the information is not guaranteed, nor in providing it do CGWM assume any liability.
All views expressed in this document are provided for informational purposes only and does not constitute an offer or solicitation to buy or sell any securities. The statements expressed herein are not intended to provide tax, legal or financial advice, and under no circumstances should be construed as a solicitation to act as a securities broker or dealer in any jurisdiction. All views are intended for general circulation to clients and do not have any regard to the specific investment objectives, financial situation or general needs of any particular person.
Forward-looking statements and past performance are not guarantees of future results. To the fullest extent permitted by law, neither CGWM nor its affiliates or any other person accepts any liability whatsoever for any direct or consequential loss arising from any use of the information contained in this document. Canaccord Genuity Wealth Management in Canada is a division of Canaccord Genuity Corp. Member – Canadian Investor Protection Fund and the Investment Industry Regulatory Organization of Canada
Oil companies that have been around for more than half of a century going bankrupt? With the sell-off in the Stock Markets & the negative issues plaguing the U.S. shale energy industry spreading to the Oil Majors, Steve St. Angelo makes the case it’s just a matter of time before they do – R. Zurrer for Money Talks
As the sell-off in the broader stock markets intensifies, it will be bad news for the world’s largest oil companies. Why? Because cracks are already beginning to appear in the biggest and most profitable global oil companies. While rising costs and higher debt levels have been plaguing the U.S. shale oil industry, these negative factors are now impacting the major oil companies as well.
When the oil price fell below $100 in 2014, it spelled doom for the U.S. and global oil industry. As oil prices continued to decline, energy companies were forced to increase their debt and reduce their capital expenditures (CAPEX). Cutting CAPEX spending while adding debt aren’t a good recipe for positive financial earning in the future.
According to several energy analysts, they believe 2018 will be a turnaround year for the major oil companies. Unfortunately, the fate of the price of petroleum and the oil companies are tied to the broader markets. When the markets rise, it’s good for the oil price and energy companies, and when the markets fall, then the opposite is true. However, the next major market selloff will likely cause irreversible damage to the global oil industry.
Investors need to realize that the global oil industry required $120+ oil in 2013 to replace reserves and bring on more oil production. When that price level was not obtained that year, oil companies began to cut CAPEX spending even before the price fell below $100 a barrel in 2014. Today, with the price of oil trading at $64, it is approximately half of what the global oil industry requires to fund new production growth.
So, there lies the rub. Even though oil companies are more profitable currently, it was achieved by destroying future production. As we can see in the chart below, CAPEX spending in eight of the largest global oil companies fell 56% from $245 billion in 2013 to $109 billion in 2017:

Yes, it’s true that a lower oil price forces oil companies to cut CAPEX spending to remain profitable, but it will also negatively impact their earnings in the future. While all the major oil companies cut their CAPEX spending significantly over the past four years, Brazil’s Petrobras and ConocoPhillips both reduced it the most by 70%.
Now, to offset the falling oil price, many of the oil companies resorted to adding more debt to pay shareholder dividends or to fund CAPEX spending (or both). For example, Shell’s long-term debt increased from $36 billion in 2013 to $74 billion in 2017 while ExxonMobil, one of the most profitable major oil companies in the world, saw its debt increase significantly from $7 billion to $24 billion during the same period:

These eight major oil companies have increased their debt right at the very time the stock markets are beginning rolling over. As I have mentioned, when the stock market suffers a big correction-crash, so will the oil price. A falling oil price will force oil companies to cut their CAPEX spending, once again, to provide positive cash flow for their shareholders. Furthermore, rising debt levels and interest rates have severely cut into these energy companies’ profits.
In 2013, these eight oil companies paid $5.7 billion to service the interest on their debt. However, that nearly tripled to $15.4 billion in 2017. Thus, $10 billion in profits were vaporized just so these major oil companies could service their debt. We must remember, during major market corrections, ASSET VALUES DECLINE, while DEBTS & LIABILITIES stay the same. Which means, a much lower oil price will make it increasingly difficult for these oil majors to remain profitable as a large portion of their profits is now being used to pay their interest expense:

These three charts represent the CRACKS that are now beginning to appear in world’s largest oil companies. Even though the oil majors have been somewhat immune to much of the negative issues plaguing the U.S. shale energy industry, it seems like the disease is finally spreading to them. It’s just a matter of time before the Falling EROI – Energy Returned On Investment and Thermodynamics starts bankrupting oil companies that have been around for more than half of a century.
While this may seem like I am overly pessimistic, the data and the facts speak for themselves.
Lastly, the public has no clue just how critical the oil supply is to our Just-In-Time-Inventory-Economy. Even though the housing market is still booming, what would our Suburban Economy look like with 50+% less of petroleum liquid fuels?? Please don’t belch out that Electric Cars (EV’s) are the answer… they are not. Also, the current electric battery technology used to power a semi-tractor trailer would only have enough energy to also transport a fraction (2,000 lbs) of the freight compared to a typical diesel engine (48,000-50,000 lbs).
Unfortunately, technology has not solved our problems…. it has just created even bigger ones. When you understand this simple principle, then it’s easy to see how the world unfolds in the future.
Check back for new articles and updates at the SRSrocco Report.

-
I know Mike is a very solid investor and respect his opinions very much. So if he says pay attention to this or that - I will.
~ Dale G.
-
I've started managing my own investments so view Michael's site as a one-stop shop from which to get information and perspectives.
~ Dave E.
-
Michael offers easy reading, honest, common sense information that anyone can use in a practical manner.
~ der_al.
-
A sane voice in a scrambled investment world.
~ Ed R.
Inside Edge Pro Contributors

Greg Weldon

Josef Schachter

Tyler Bollhorn

Ryan Irvine

Paul Beattie

Martin Straith

Patrick Ceresna

Mark Leibovit

James Thorne

Victor Adair