
Gold & Precious Metals
Watch for 3 three key numbers at next Friday’s close: 1. The March Monthly/Quarterly/Next Friday close above the $1330.00 level (hasn’t happened for 6 years, not since 2012. 2. Staying above the 200 day moving average at 12.92.07 3. Last, see if the GDX and GDXJ break above roughly $23 for GDX and $34 for GDXJ. – R. Zurrer for Money Talks
Gold has firmed above $1300 in recent days and is holding comfortably above $1300 for now. We think the market will break to the upside sometime this year. The question is when. Here are 3 things to watch that will tell us if Gold is on the cusp of that break-out soon or later.
First, keep your eye on Gold’s close at the end of next week. It’s not only the end of the week and month but also the end of the quarter. While Gold has traded above $1350 multiple times in the past two years, it has not made a quarterly close above $1330 since 2012. Since this is a quarterly time frame, we would need to see a close above $1340 or even $1345 to mark a significant breakout. If Gold can make such a close next Friday then the odds are good that it could break above $1375 fairly soon.

Gold Quarterly Chart
Second, (and I always beat this to death) Gold needs to break its downtrends relative to foreign currencies (FC) and equities. The Gold/equities ratio appears to be breaking out but needs follow through for confirmation. The 200-day moving average in that chart appears to have stopped declining. If the ratio can hold above the 200-day moving average then it’s obviously a bullish sign. Meanwhile, Gold/FC has work to do. Over the last 10 months, it has traded in a tighter and tighter range. That trendline resistance could go hand in hand with resistance at $1365-$1375.
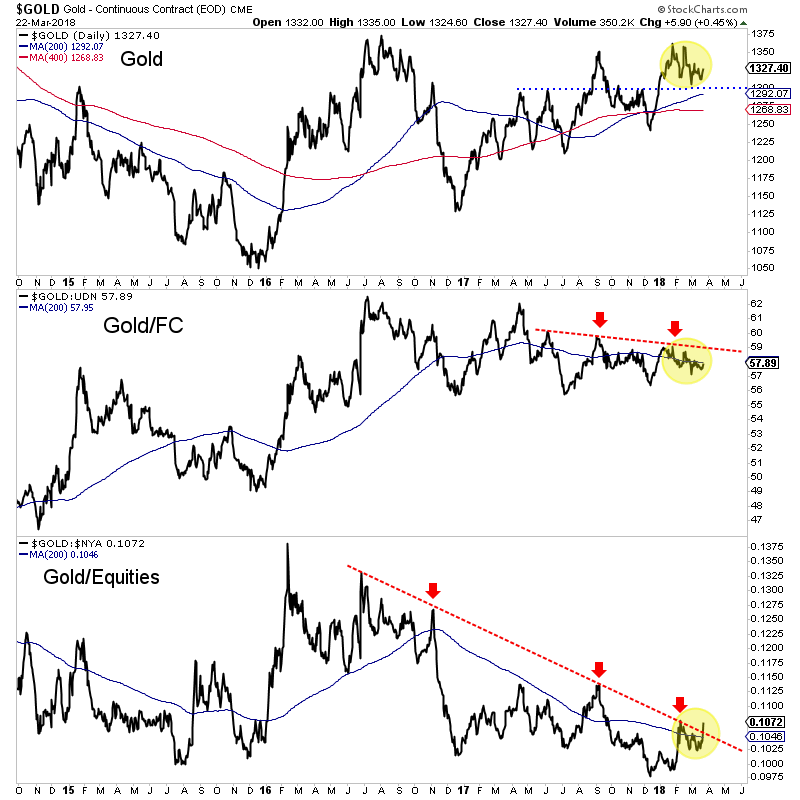

Of course, the price action in Gold itself will answer the question but these other charts can not only give an early hint but can also inform as to the sustainability of Gold’s strength. The first test will be the quarterly close next week. Then we can monitor if the Gold/equities ratio is holding its breakout and if Gold/FC is strengthening.
We have expected the move to a break-out in Gold could begin sometime in Q3. Let’s keep our eyes peeled on the above charts as the genesis of that move has a chance to begin earlier than expected. In the meantime, we continue to be patient but are accumulating the juniors we think have 500% return potential over the next 18-24 months.
Jordan Roy-Bryne


Perspective
Guys at the Fed still think that crude oil prices going up is bad for the stock market. Obviously, there is still little regard for empiricism at the Fed. The stock market goes up with crude and then it goes down when crude goes down. The establishment has a similar problem in thinking that rising interest rates are bad. No, short-dated rates, such as T- Bills, increasing confirm that the boom is on. Reversing and turning down indicates the boom is over.
Since the first of February, the Bill-rate has jumped from 1.40% to 1.77%.
Then there are solar cells that generate electricity from raindrops rolling down the matrix. Could be exciting in Vancouver, which is the city by the rainforest. The way we locals tell the weather is straightforward. If you can see the mountains, you know it is going to rain. If you can’t see them, you know it is raining.
And then if it rains after dark – solar cells would work! The presence of “Goldilocks” is noted.
That meteorology staffers are using super computers to mine cryptocurrencies may be as sound as their forecasts that the Earth is going to fry.
Stock Markets
On the bigger picture, financial markets have been enjoying a fabulous boom. Is it complete?
Our concern is that when it expires, the recession will start virtually with the bear market. During the usual cycle the stock market peaks some 9 to 12 months before the economy does. At the end of great financial bubbles, the record has been that the recession starts virtually as speculation blows out and collapses.
We used this in 2007 when the S&P peaked in October and the recession started in that fateful December. Fateful, because that was the month that Harvard economist, Greg Mankiw, boasted that nothing could go wrong. The Fed had a “dream team” of economists. Fateful, because it was the start of the worst contraction since the 1930s.
Our October 4th Pivot outlined that even the DJIA would be “bubbled”, which was a bold call. Also outlined was that there were previous examples of outstanding speculations completing in the December-January window. The Bitcoin phenomenon peaked in the middle of December and seems to be following the path following the climax of previous bubbles such as with gold and silver in January 1980, or the Nikkei in December 1989.
Another point was that the senior indexes would likely peak somewhat after the feverish speculations did. The high for the S&P was set on January 26th, which was also the high for the NYSE Comp (NYA).
Following the initial hit, the market was likely to churn around, building a base for a rally into May-June.
So far, so good, but to be prudent it is best to look to the threats that accompany magnificent frenzies. The real threat is that the markets have been hyper. The “threats” from credit markets or industrial commodities are actually catalysts.
Any change in the credit markets could place some big accounts offside. As with Bear Stearns in June 2007, Clarence Hatry in the summer of 1929 and Jay Cooke (“a savior of the nation”) in late September 1873. A decline in industrial commodities would be a negative.
As we have been noting, credit markets could enjoy some seasonal “sunshine” at around May. When financial conditions are speculative () there can be a turn to adversity later in the year (??).
BOB HOYE, INSTITUTIONAL ADVISORS
E-MAIL bhoye.institutionaladvisors@telus.net
WEBSITE: www.institutionaladvisors.com

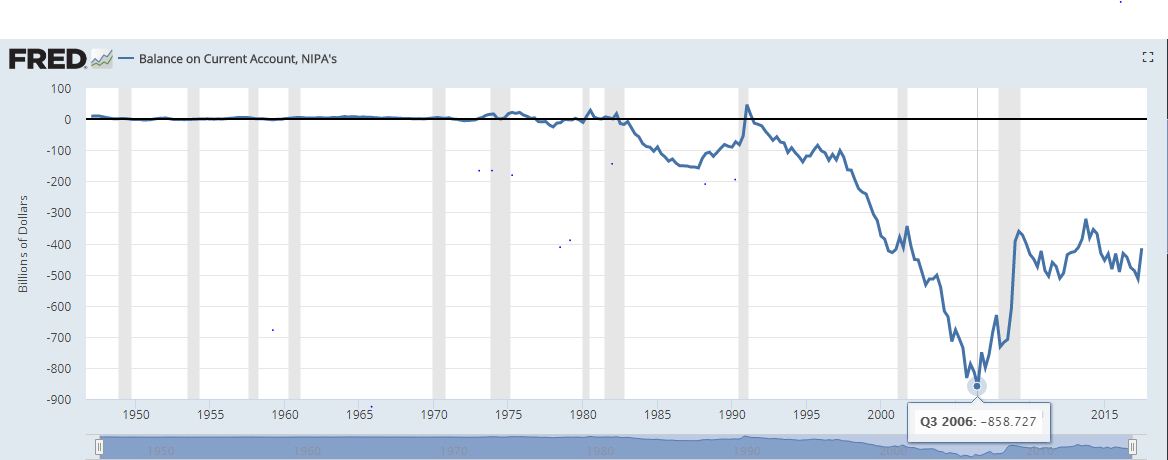
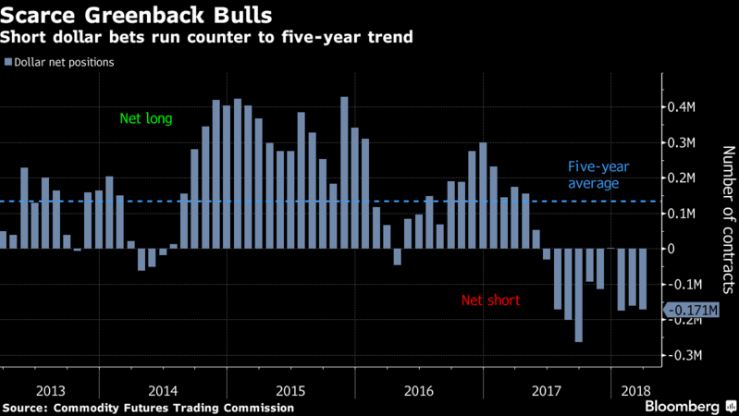 Bloomberg has reported that dollar bulls are nearly extinct down to just 2.3 %. The majority, which is always wrong, are all focused on the nonsense of the budget and the current account deficits. The record high for the dollar was 1985 when even the British pound fell to $1.03. So the balance of payments went negative from 1980 to 1986 and the dollar rose. OMG!How was that possible? When you actually correlate the Balance of Payments with the dollar, something amazing emerged. The dollar rises with the balance of payments going negative. Gee whiz! That is against all perpetual bear’s reasoning.
Perhaps this magical logic is just sophistry because they use their theory and don’t bother to check if it holds up over the course of time. I have been warning countless times that the Balance of Payments is by no means simply TRADE. It includes all flows of capital outward. That includes interest. The biggest trade deficit of the USA is not with Europe, but China, who just so… Larger Chart
…happens to be the LARGEST investor in US government bonds. That means they collect the lion share of interest expenditures. The days of buying just pick umbrella for your cocktail are long gone.
The Balance of Payments bottomed in 2006 and began to rise from that 3rd quarter low. When did the dollar bottom? In 2008 as the Balance of Payments was improving. Strange! Guess that logic does not hold up.
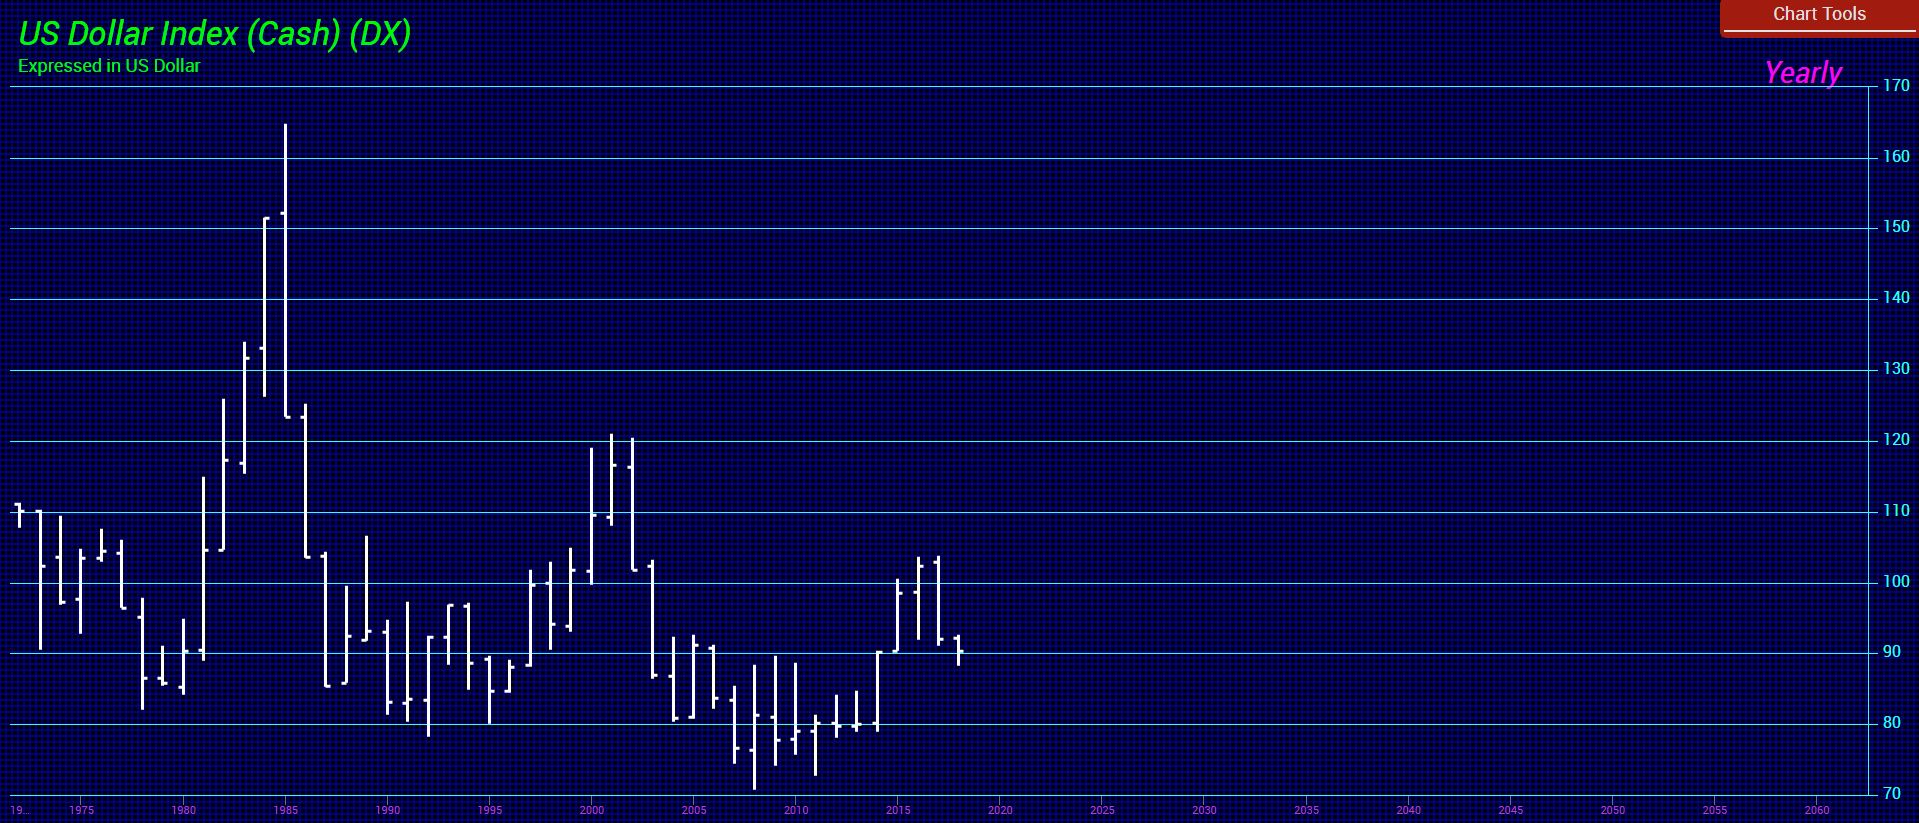
Most people look at the Dollar Index for a guide as to being bullish or bearish. What they do not realize is how it is constructed is not really relevant. Currently, the index is calculated by taking the exchange rates of six major world currencies the Euro, Japanese yen, Canadian dollar, British pound, Swedish krona and Swiss franc. Then they apply a weight which is arbitrary. The Euro, for example, has a weight factor of 58%. The Japanese yen has a weight of about 14%. From a trade flow and capital flow perspective China is at the top of the list. The trade deficit with China (with includes interest expenditures that flow to China) stands at 123,676 billion compared to 343,078 billion for the entire European Union with Germany coming in at 49,363 billion. Japan now is still more in capital flows than Germany coming in at 67,117 billion. The weights that make up the Dollar Index are not truly reflected in either trade or capital flows. Furthermore, the index was created only in 1973. It shows the high in 1985 and the low in 2008, which really does reflect Europe rather than trade or even capital investment flows.
…..also from Martin after Thursdays Market drop: Market Talk- March 22, 2018

With markets whipping back and forth this extreme volatility has generated unusual trading opportunities. Anticipating imminent price action in each of the markets examined below will refine entry/exit points & protect capital for long term investors, or generate short term trading profits. This analysis was gernerated mid-day March 22nd – R. Zurrer for Money Talks
 Gold Apr Contract ( jUN , ETF: (GLD))
Rallying ahead of Wednesday’s FOMC news and extending sharply higher after it as nonetheless retraced to test 1325.50 at Thursday’s low. At least closing back under it was needed to reinstate the downside momentum. Now closing back under 1319.00 is the nearest signal.
Eurodollar Mar Contract (EC, ETF: (FXE, UUP))
Holding Wednesday’s bounce at the 1.2390-1.2410 bounce limit didn’t prevent probing higher overnight to test 1.2465. But that excess had disappeared by Thursday’s open, which extended back down intraday to 1.2365. Closing any lower would confirm the corrective bounce had ended, so long as 1.2390-1.2410continues to hold as resistance.
Silver May Contract (SI, ETF: (SLV))
Probing sharply higher into and out of and after Wednesday’s FOM events was retraced back down Thursday to test 16.40 down to 16.33. Just closing under 16.55 prevents launching a new upleg, and allows another close under 16.40 to resume the decline.
30-year Treasury Jun Contract (US, ETF: (TLT))
Ending Wednesday’s volatility at 143-16 continued to prevent sellers from gaining traction for their third consecutive daily effort. Gapping up more than 1 point Thursday through Monday’s 144-20 close was the consequence. It extended to probe last week’s 145-06 highs intraday, but the resistance held. Its reaction down to “lower prior highs” at 144-22 also held. Closing beyond either end of that range is likely to extend in that direction.
Crude Oil Apr Contract (CL, ETF: (USO, USL) (UWTI-long, DWTI-short))
Confirming Tuesday’s breakout Wednesday now requires at least an eventual third higher close. Meanwhile, testing 65.00 created potential for reacting down. The 64.25 pullback limit was tested, with room down to 62.70 before undermining the near-term likelihood of resuming the rally to 66.85.
Natural Gas May Contract (NG, ETF: (UNG, UNL))
Wednesday’s reversal extended down slightly deeper Thursday. The behavior can’t yet be considered “ineffectual optimism” for approaching its 2.62 target with such a slow pace, but it doesn’t contradict the ongoing likelihood for breaking through it by at least a dime.
Mark expects the market to change directions after yesterdays nearly 3% Stock Market rout that was caused by a brace of factors from tariffs to a potential bond market crash. Using his 35 years of experience and his VOLUME REVERSAL ™ methodology Mark gives us a thorough analysis of this violent collapse and expected rally – R. Zurrer for Money Talks

Stocks showed a substantial move to the downside during trading on Thursday, with the major averages adding to the modest losses posted in the previous session. If you didn’t know, astrologically Mercury went retrograde and won’t go direct until April 15. Google it. Meanwhile, the ‘Ides of March’ and the Vernal Equinox often signals a change in market direction. The major averages ended the session near their worst levels of the day. The Dow plunged 724.42 points or 2.9 percent to 23,957.89, the Nasdaq tumbled 178.61 points or 2.4 percent to 7,166.68 points or 2.4 percent to 7,166.68 and the S&P 500 plummeted 68.24 points or 2.5 percent to 2,643.69. The sell-off on Wall Street supposedly reflected concerns about the impact of a potential trade war after President Donald Trump announced tariffs on at least $50 billion worth of Chinese imports, an absurdity about such a small amount as compared with the overall trade deficit with China. Instead, our sources say a potential bond crash may be the real reason.
Technically, I had mentioned that the 24,400 to 25,400 range was to be watched and lo and behold we broke it to the downside! Today’s actions completed a 5-wave decline off the highs, taking the Nasdaq 100 from 7200 to 6682, a loss of more than 500 points in a very short period of time. The S&P 500 went from over 2800 to 2642, 158 points. At this point, when you have key support near and short term oversold, with an extreme negative tick near the close of minus 1419 the chances of at least a bounce may be imminent, but we’ll see what happens tomorrow! We are definitely oversold at this point. Looking out a few days/weeks at the SPX, a return to SPX 2533 appears to be the markets objective. Short term support is at the 2632 and 2594 pivots, with resistance at 2656 and 2731 (See chart below).
Before the newly announced tariffs take effect, the Office of the US Trade Representative will release a list of more than 1,000 possible tariff lines, technical codes that apply to a particular good. There will then be a 30-day comment period during which companies and industry groups can raise objections to certain goods being included in the tariffs. During this time there will also be a public hearing on the tariffs. After the comment period, the USTR will determine which goods the tariffs will apply to and release those findings. So, it could be well into May or June before the tariffs are fully implemented. The restrictions on trade will most likely push up prices on imports of Chinese goods. For businesses that use the imports in their end products, the tariffs will most likely drive up costs and lead to increased prices or cuts in other areas of business.
The House of Representatives approved a $1.3 trillion spending bill to avert a government shutdown and fund federal agencies through Sept. 30. The Republican-led chamber backed the measure 256-167, sending it to the Senate ahead of a midnight Friday deadline. But 90 of the 238 House Republicans voted against it. Coupled with recently enacted tax cuts, the bill is projected to lead to budget deficits of more than $800 billion for this year. Conservatives balked at the deficit spending. Democrats complained that in the rush to pass the bill, few if any lawmakers had time to read through the 2,232-page tome to see what it actually contained. The bill was unveiled late on Wednesday.
Trump is frustrated over trade imbalances and the theft of intellectual property by China. His proposed tariffs aren’t likely to remedy the situation, and could make it worse. China’s Commerce Ministry issued a statement saying, “China will not sit idly to see its legitimate rights damaged and must take all necessary measures to resolutely defend its legitimate rights.” Reports suggest China will impose tariffs on US exports of the major agricultural products sorghum, soybeans, and hogs. More than half of the soybeans and sorghum exported by the US goes to China.
China is a major market for US agricultural products, cars, machinery, and other products. In 2016, China was the third largest market for US exports. Conversely, more than 41% of clothing and 72% of footwear sold in the US are made in China. Analysts believe that not only will US and Chinese businesses and consumers suffer from dampened demand and higher prices of goods, but other countries will experience collateral damage. US-China bilateral trade investment ties are integrated with global supply chains. So, a US-China trade war is necessarily going to have an effect on companies and consumers in other countries. And US-China relations are not good right now. The tariffs could encourage domestic Chinese sentiment to turn against the US. The announcement comes after the passage of a law allowing top US officials to visit Taiwan, a measure that China strongly opposes. Beijing views the self-ruled island as a “rogue province” that belongs to China. Truth is, we don’t know all the implications. We could have an all-out trade war, or the complexity of the global supply chain might limit the fallout. One thing seems highly probable – higher prices for consumer goods. Tariffs are essentially a tax. And while the Trump administration recently passed a tax break, the biggest beneficiaries were corporations. Tariffs will hit consumers squarely in the pocketbook. No surprise that Walmart and Target were each down 1.2% today. Boeing fell more than 5 percent. China has specifically threatened the US. aircraft maker if Trump raised levies. In 2016, the Communist Party newspaper said its Boeing orders, among them a $38 billion package announced when China’s president visited, could be replaced with Europe’s Airbus. Banks and insurers sold off as well. A slump in Treasury yields as investors sought havens weighed on the sector’s earnings prospects. JPMorgan Chase lost 4.2 percent. China’s Global Times — which has links to the ruling Communist Party – this week accused the U.S. of “dumping” soybeans, raising concern that the crop will be among the first items China targets. Currency depreciation could be one channel through which authorities in Beijing aim to increase the competitiveness of their products. The dollar rose 0.5 percent relative to the Chinese offshore yuan. China’s holdings of American bonds, notes and bills have already dipped to a six-month low as of January.
On the U.S. economic front:
A report released by the Labor Department showed a modest uptick in first-time claims for U.S. unemployment benefits in the week ended March 17th. The report said initial jobless claims edged up to 229,000, an increase of 3,000 from the previous week’s unrevised level of 226,000. Economists had expected jobless claims to dip to 225,000. A separate report released by the Conference Board showed a bigger than expected increase by its index of leading U.S. economic indicators. The Conference Board said its leading economic index climbed by 0.6 percent following a 0.8 percent increase in January. Economists had expected the index to rise by 0.3 percent.
Steel stocks turned in some of the market’s worst performances on the day, resulting in a 6.2 percent drop by the NYSE Arca Steel Index. Considerable weakness was also visible among financial stocks, with the KBW Bank Index and the NYSE Arca Broker/Dealer Index slumping by 4.1 percent and 3.6 percent, respectively. Oil service, pharmaceutical, transportation, and chemical stocks also moved notably lower amid broad based weakness on Wall Street.
In the bond market, treasuries showed a significant rebound following the drop seen in the previous session. Subsequently, the yield on the benchmark ten-year note, which moves opposite of its price, slid by 7.5 basis points to 2.832 percent.
Economic Reports
February Durable Goods Orders to be released at 8:30 AM EST on Friday are expected to increase 1.6% versus a drop of 3.7% in January. Excluding Transportation Orders, February Durable Goods Orders are expected to increase 0.5% versus a decline of 0.3% in January.
Canadian February Consumer Price Index to be released at 8:30 AM EST on Friday is expected to increase 0.5% versus a gain of 0.7% in January.
Canadian January Retail Sales to be released at 8:30 AM EST on Friday are expected increase 1.3% versus a drop of 0.8% in December.
February New Home Sales to be released at 10:00 AM EST on Friday are expected to increase to 620,000 units from 593,000 units in January.

-
I know Mike is a very solid investor and respect his opinions very much. So if he says pay attention to this or that - I will.
~ Dale G.
-
I've started managing my own investments so view Michael's site as a one-stop shop from which to get information and perspectives.
~ Dave E.
-
Michael offers easy reading, honest, common sense information that anyone can use in a practical manner.
~ der_al.
-
A sane voice in a scrambled investment world.
~ Ed R.
Inside Edge Pro Contributors

Greg Weldon

Josef Schachter

Tyler Bollhorn

Ryan Irvine

Paul Beattie

Martin Straith

Patrick Ceresna

Mark Leibovit

James Thorne

Victor Adair